This is an Open-Access article distributed under the terms of the Creative Commons Attribution Non-Commercial License(http://creativecommons.org/licenses/by-nc/3.0) which permits unrestricted non-commercial use, distribution, and reproduction in any medium, provided the original work is properly cited.
Journal of Welding and Joining, Vol.32 No.2(2014) pp22-28
탄뎀 가스메탈아크 용접공정의 최적화에 관한 실험적 연구
이종표*,†․김일수*․이지혜*․박민호*․김영수*․박철균*
*목포대학교 공과대학 기계공학과
An Experimental Study on Optimizing for Tandem Gas Metal Arc Welding Process
Jongpyo Lee*,†, Illsoo Kim*, Jihye Lee*, Minho Park*, Youngsoo* Kim and Cheolkyun Park*
*Dept, of Mechanical Engineering, Mokpo National University, Mokpo 534-729, Korea
†Corresponding author : [email protected]
(Received September 3, 2013 ; December 12, 2013 ; Accepted March 31, 2014)
Abstract
To enhance productivity and provide high quality production material in a GMA welding process, weld quality, productivity and cost reduction affects the number of process variables. In addition, a reliable welding process and conditions must be implemented to reduce weld structure failure. In various industries the welding process mathematical model is not fully formulated for the process parameter and on the welding conditions, therefore only partial variables can be predicted. The research investigates the interaction between the welding parameters (welding speed, distance between electrodes, and flow rate of shielding gas) and bead geometry for predicting the weld bead geometry (bead width, bead height). Taguchi techniques are applied to bead shape to develope curve equation for predicting the optimized process parameters and quality characteristics by analyzing the S/N ratio. The experimental results and measured error is within the range of 10% presenting satisfactory accuracy. The curve equation was developed in such a way that you can predict the bead geometry of constructed machinery that can be used for making tandem welding process.
Key Words : GMA welding, Mathematical model, S/N ratio, Taguchi techniques, Tandem welding
ISSN 1225-6153 Online ISSN 2287-8955
1. 서 론
용접기술은 전자부품과 같은 소형제품으로부터 대형 구조물에 이르기까지 산업전반에 걸쳐 각 분야의 제품 을 생산하기 위한 필수 기반기술 중에서도 대단히 중요 한 위치를 차지하고 있다. 이러한 용접기술은 공업기반 기술로서의 역할뿐만 아니라 산업환경의 급격한 발전과 함께 자동화, 안정화, 초정밀화 등 다양한 요구들을 충 족시킬 수 있도록 종래 기술의 개선과 신기술에 대한 개발을 병행함으로서, 다양한 작업조건에 대응할 수 있 도록 기술이 혁신되고 첨단기술로서의 면모도 갖추게 되었다1-3).
최근에는 용접장비 및 용접재료 개발에 힘입어 2-토 치(Tandem) FCA용접이 활발하게 적용되고 있다. 그 러나 1-토치 용접조건 설정과는 달리 탄뎀 용접의 경우
품질에 영향을 미치는 인자가 더 많이 존재하게 된다. 이 러한 인자들을 현장 조건에 맞추어 용접사의 경험적인 측 면에서 작업조건을 설정함으로써 언더컷(Undercut), 오버랩(Overlap), 부등각장(Unbalance leg length), 블로우홀(Blowhole), 핏트(Pit) 등의 불량을 더욱 효 과적으로 감소시킬 수 있는 기술이 요구된다. 일반적으 로 후판 용접에서는 고가의 포지셔너(Positioner)나 로 봇이 이용하므로 시스템의 설비금액이 비싸지만, 탄뎀 용접법을 사용하면 설비가 반으로 끝나 투자효과는 높 은 편이다4,5).
Nomura는 용접속도를 향상시키기 위해서 고속 회전 토치와 아크센서를 이용한 용접선 추적을 사용하려는 연구가 수행되었으며6), 김동철은 대입열용 조선용강에 탄뎀 EGW 용접을 수행하여 입열 변화에 따른 용접부 의 물성 변화에 대하여 조사하였다7). 비록 용접자동화 에 필수적인 최적의 용접변수 예측을 위한 다양한 기법
연 구 논 문
Top-bead width
Top-bead height
Fig. 3 A schenatic didgram of bead geometry
Selected variable
Electrode distance Shielding gas Welding speed Input variables
Fixed variables
Lead torch current Lead torch voltage Tail torch current Tail torch voltage
Welding process
Output variables
Bead height Bead width
Fig. 4 Input and output vaiables of the welding process
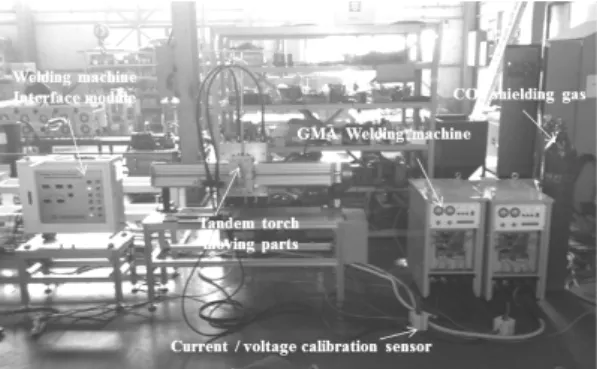
Fig. 1 Tandem GMA welding experimental setup
Weld bead Tail torch
Lead torch Welding direction
16mm
400mm
200mm
Fig. 2 A schematic diagram for tandem weld process 도 및 보호가스 유량의 변화에 따라 S/N비를 통하여 비드형상과 용접변수에 대한 용접품질특성을 분석하고, 통계적 기법을 활용하여 주어진 용접변수를 기준으로 용 접품질을 예측하여 판단할 수 있는 수학적모델을 개발 하고자 한다.
2. 용접 실험 2.1 실험 방법 및 절차
탄뎀 GMA 용접 비드형상 예측 공정 최적화를 위하 여 용접실험 구성은 상용GMA용접기 2대와 2전극 토치 구동부, 보호가스(CO2), 모니터링 시스템, Interface 모 듈이 사용되었다. 일반적으로 용접결함을 줄이기 위해 선행토치는 솔리드와이어(SM-70 와이어, 1.2∅)를 사 용하여 용접을 수행하며 후행토치는 많은 용착량을 확 보하기 위해 플럭스 코어드 와이어(K-71T 와이어, 1.2∅)를 사용하였다. 보호가스 역시 2개의 봄베를 이 용하여 개별적으로 용접기를 통해 공급되도록 시스템을 구축하였다. Fig. 1은 용접실험에 사용된 전체 시스템
× × 의 규격인 시험편을 제작하였다. Fig.
2는 탄뎀 GMA 용접 공정 개략도를 나타낸다.
본 실험에서는 탄뎀 GMA 용접 비드형상 예측 공정 최적화를 위해 고정변수는 선행토치의 용접전류, 아크 전압, 후행토치의 용접전류, 아크전압으로 선정하였다.
입력변수는 용접속도, 전극간 거리, 보호가스 유량으로 선정하였으며, 이에 따른 출력변수로는 용접공정에서의 외관검사시 적정 표면비드 폭을 형성하였을 경우 안정 적인 용접부 비드형상으로 간주하기 때문 출력변수를 비 드형상(비드높이, 비드폭)으로 선정하였다. 용접성에 크 게 영향을 미치는 주요 1차 변수(용접속도, 토치간 간 격, 보호 가스 유량) 이 외에 다양한 공정변수가 존재 하지만 보다 효율적이고 체계적인 실험을 위하여 기타 변수의 값은 고정하고 실험을 수행하였다. Fig. 3은 비 드형상(비드높이, 비드폭)의 측정을 위한 모식도를 나 타낸다.
따라서 3가지 레벨의 용접속도는 2개의 공정변수, 전 극간 거리는 3개의 공정변수, 보호가스 유량은 2개의 공정변수로 인해 12개의 자유도가 생긴다. 직교 배열의 자유도는 공정변수의 자유도보다 더 크거나 동일하며, Fig. 4는 GMA 용접공정의 입력 변수 및 출력 변수를
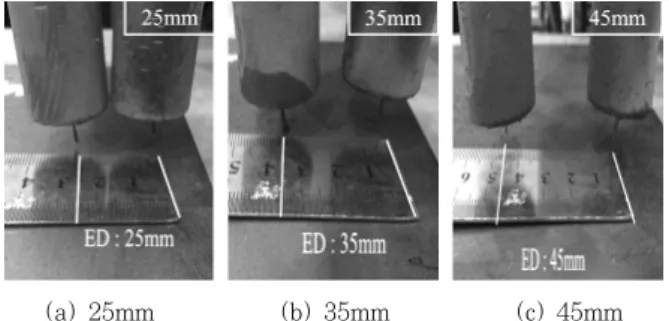
(a) 25mm (b) 35mm (c) 45mm Fig. 5 Tandem inter-electrode torch distances
Table 1 Process parameters and their levels
Parameter Unit Level
Welding
current Amp. Lead torch : 270 Tail torch : 324 Voltage Vol. Lead torch : 25 Tail torch : 31 Welding
speed cm/min 40 50
Electrode
distance mm 25 35 45
Shielding
gas l/min 9 18
Fig. 6 Measurement of bead geometry Table 2 Experimental results of fillet welding
No.
Lead torch current 270(A), Lead torch voltage 25(A) Tail torch current 324(A), Tail torch voltage 31(A) Welding
speed (cpm)
Shielding gas (l/min)
Electrode distance
(mm) Bead width (mm)
Bead height
(mm)
Specimen
1 40 9 25 20.65 2.74
2 40 18 25 18.67 3.43
3 40 9 35 20.55 3.12
4 40 18 35 20.48 3.52
5 40 9 45 20.31 2.48
6 40 18 45 18.29 2.65
7 50 9 25 19.89 4.74
8 50 18 25 19.58 5.37
9 50 9 35 17.37 3.63
10 50 18 35 18.79 6.32
11 50 9 45 18 5.05
12 50 18 45 17.37 5.68
포함한 용접공정의 모델을 보여준다. Fig. 5는 전극간 거리조건 설정을 나타내는 그림이며, Table 1은 공정 변수의 조건을 나타낸다. 2k 요인시험 방법으로 총 12 회의 용접실험을 실시하여 이면비드 폭과 높이에 대한 값을 얻고자 하였다.
2.2 실험 결과
본 실험은 선행토치의 전류와 전압을 270A, 25V로 후행토치의 전류와 전압은 324A, 31V 고정하였고, 전극 간 거리를 25mm, 35mm, 45mm으로 보호가스 유량을 9l/min, 18l/min으로 변화시키고 용접속도는 40cpm, 50cpm으로 나누어 실험을 총 12회에 걸쳐 실험을 수 행하였으며 전류 전압측정기를 이용하여 각 조건별 변 화를 확인하였다.
실험결과 모두 비드형상이 균일하며 외관상 결함을 나타내지 않았다. 또한 전류·전압에 대한 파형 측정 결 과에서 용접결합을 일으킬 정도의 큰 변화는 발견되지 않았다. 전반적인 용접실험에서의 전류 및 전압의 파형 과 차이를 보이지 않았고 비드형상 또한 용락과 같은 문제가 발생하지 않고 용접이 잘 이루어졌음을 확인하 였다.
또한, 전극간 거리에 따라 용융부의 형상에 미치는 영향을 판별하기 위해 단면형상(Macro)을 촬영하여 특성 을 분석하였다. 용접부의 비드형상을 측정하기 위하여 용
접이 완료된 시험편의 가로축 중간부분을 Laser cutting machine을 사용하여 60×30mm의 크기로 절단하고 단면부를 연삭한 후 폴리싱(Polishing)하였다.
측정된 12개의 용접부 단면 중 대표적인 비드형상과 각 용접조건에 대한 폭과 높이는 Table 2에서 보는바
No. of trial S/N ratio
1 -17.291 -1.920
2 -16.159 -2.868
3 -17.237 -2.449
4 -17.198 -2.992
5 -17.103 -1.558
6 -15.932 -1.796
7 -16.867 -4.563
8 -16.687 -5.327
9 -15.370 -3.137
10 -16.229 -6.407
11 -15.757 -4.949
12 -15.370 -5.695
Table 3 S/N response table for the bead geometry
The number of the trial
1 2 3 4 5 6 7 8 9 10 11 12
-2 -5 -8 -11 -14 -17 -20
S/N ratio
Fig. 7 S/N ratio for the bead width
The number of the trial
1 2 3 4 5 6 7 8 9 10 11 12
-1 -3 -5 -7
S/N ratio
Fig. 8 S/N ratio for the bead height
-3
-2
-1
0
The number of the trial
1 2 3 4 5 6 7 8 9 10 11 12
S/N ratio
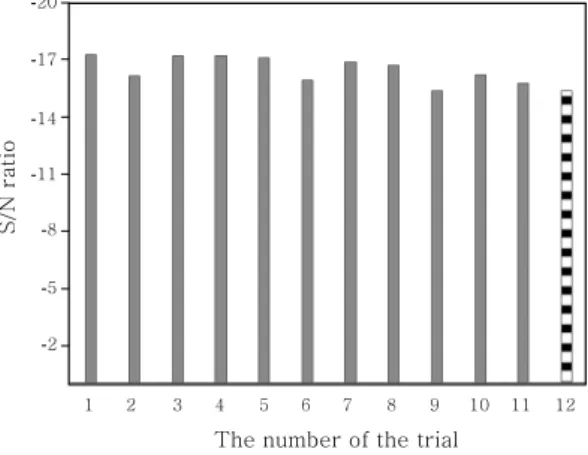
Fig. 9 S/N ratio for the bead geometry
3. 결과 및 고찰 3.1 다구찌 방법에 의한 분석
용접실험을 위해 설계한 L12 배열을 이용한 실험에 대한 결과를 이용하여 분석하였다. 용접실험 결과 측 정된 비드형상을 바탕으로 비드형상에 대한 품질특성 (Quality characteristics) 즉, 비드폭, 비드높이는 다 음과 같은 망소 특성의 S/N비 공식으로 표현한다.
log (1) 여기서, 는 j번째 실험의 i번째 품질특성의 S/N 비, 는 j번째 실험의 i번째 품질특성의 실험값을 의 미한다. 용접실험을 통해 획득한 데이터를 식 (1)를 이 용하여 계산한 비드형상에 대한 각각의 S/N비를 Table 3에 나타내었으며, 각각의 비드형상에 대한 S/N비의 결과를 그래프로 표현하면 Figs. 7~8과 같다.
12번의 실험을 통하여 평균 S/N비의 평균값의 비교 를 통한 비드형상에 대한 최적조건 선정에 관한 그래프 는 Fig. 9에서 나타내었다. 그 결과, 6번째 실험조건에 서 S/N비가 가장 큰 수치로 나타났으며 최적의 비드 형상이 형성됨을 확인하였다.
비드폭이 증가함을 알 수 있었다. 비드폭에 대한 보호
Electrode distance : 25mm Electrode distance : 35mm Electrode distance : 45mm 22
20
18
16
14
40 45 50
Welding speed(cm/min)
Weld bead width(min)
Fig. 10 The effect of welding speed on bead width
Electrode distance : 25mm Electrode distance : 35mm Electrode distance : 45mm 22
20
18
16
14
Weld bead width(min)
9 12 15 18
Shielding gas(1/min)
Fig. 11 The effect of shielding gas on bead width
Electrode distance : 25mm Electrode distance : 35mm Electrode distance : 45mm 5
4
3
2
40 45 50
Welding speed(cm/min)
Weld bead height(min)
Fig. 12 The effect of welding speed on bead width
9 12 15 18
Shielding gas(1/min)
Electrode distance : 25mm Electrode distance : 35mm Electrode distance : 45mm 5
4
3
2
Weld bead height(min)
Fig. 13 The effect of shielding gas on bead height
가스 유량의 영향을 Fig. 11에 나타내었으며 보호가스 유량이 증가함에 따라 비드폭은 감소함을 알 수 있었 다. 전극간 거리는 25mm, 35mm, 45mm을 기준으로
하였을 때 비드폭에 대한 용접속도와 보호가스 유량의 영향은 감소함을 알 수 있었다.
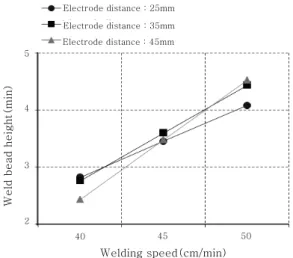
비드폭에 대한 용접속도의 영향을 Fig. 12에 나타내 었으며, 용접속도가 증가함에 따라 전극간 거리는 증가 함을 알 수 있었다. 비드폭에 대한 보호가스 유량의 영 향을 Fig. 13에 나타내었으며 보호가스 유량이 증가함 에 따라 전극간 거리는 증가함을 알 수 있었다. 전극간 거리 25mm, 35mm, 45mm을 기준으로 하였을 때 비드높이가 증가함에 따라 용접속도와 보호가스 유량의 영향은 증가함을 알 수 있었다.
3.3 2차 모델의 개발
용접 비드형상을 최적화하기 위한 용접공정의 입력변 수는 용접속도(), 토치 간 간격(), 보호 가스 유 량()로 정의하고, 출력변수는 비드폭 ()과 비드높 이 ( )로 정의하며, 입력변수와 출력변수사이의 관계 식은 2차 모델(second order model)로 가정하였으며, 다음 식(2)와 같다.
(2)
여기서, 는 입력변수(토치 간 간격, 보호가스 유량) 의 coded unit 이고, 는 용접에서 품질을 나타내는 출력변수(비드높이, 비드폭)를 나타내며, 실험결과 데 이터에 의해서 구해진 는 회귀계수로 정의한다. 는 최소자승법(The method of least squares)에 의해 구해진다. 측정된 실험결과 데이터로부터 다음과 같은 모델을 얻었다.
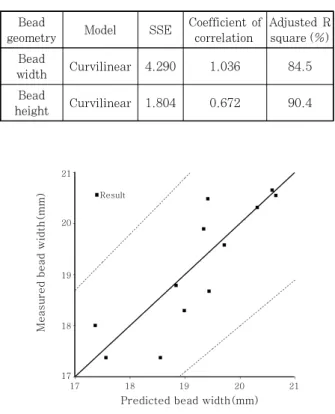
height Curvilinear 1.804 0.672 90.4
17
Measured bead width(mm)
18 19 20 21
Predicted bead width(mm) 17
18 19 20 21
Result
Fig. 14 Relationship between measured and calculated bead width on curvilinear model
Result
2 3 4 5 6
Predicted bead height (mm)
2 3 4 5 6
Measured bead height (mm)
Fig. 15 Relationship between measured and calculated bead height on curvilinear model
1) Bead width(B/W)
(3)
2) Bead height(B/H)
석표를 Table 4에 나타내었으며, 적합성 결여 테스트 p값과 결정계수를 비교해 볼 때 두 방정식 모두 용접공 정제어 및 자동화에 사용할 수 있다는 것을 확인할 수 있 었다. 개발된 방정식은 각각 비드폭의 총 변동은 84.5%
이며, 반면에 비드높이의 총 변동의 90.4%를 확인할 수 있었다. 개발한 모델의 검증을 위하여 개발한 2차 모델을 이용하여 실험값과 비교분석을 수행하였으며, 그 결과를 Figs. 14∼15에서 나타내었다.
4. 결 론
Tandem GMA 용접 공정 최적화를 구축하기 위하여 다구찌 기법인 S/N ratio를 이용하여 품질특성을 분석 하여 공정변수와 비드형상과의 상관관계를 비교․분석 하였으며, 회귀분석기법을 이용하여 곡선 방정식과 수 학적 모델을 개발하여 용접변수를 기준으로 용접품질을 예측한 결과 다음과 같은 결론을 얻었다.
1) 다구찌이론을 적용하여 3개의 공정변수(전극간 거리, 보호가스 유량, 용접 속도)와 2개의 비드형상(비 드폭, 비드높이)의 상관관계분석 결과 12번의 실험 중 6번째 실험조건에서 S/N비가 가장 크고 가장 뛰어난 다중 특성을 가지고 있음을 알 수 있었다.
2) 용접 실험에서 측정된 실험결과 값을 기초로 비드 형상에 대한 최적의 공정변수를 예측하기 위하여 다중 회귀 분석법을 사용하였으며, 상업용 통계컴퓨터 프로그 램을 이용하여 곡선방정식을 개발하였으며, 개발한 모 델의 예측값이 실험값의 오차범위 10% 내외로 분포함 으로 실험된 값에 대한 비드형상을 잘 설명하고 있음을 확인 할 수 있었다. 따라서 다중상관계수가 70%이상으 로 제어모델로 적정한 것으로 사료된다.
후 기
본 연구는 교육부와 한국연구재단의 지역혁신인력양성사 업으로 수행된 연구결과임 (No. 2013H1B8A2032082).
Reference
1. J. Crouch : Welding Review, 11-3(1992), 123-124
2. G. L. Lovegrove, G. J. Curtis and R. A. Farrar : Applications for Artificial Intelligence Expert Systems, ACM(1990), 653-659
3. Lucas W. and Brightmore A. D : elding Quality, The Role of computers, IIW(1988), 141-157
4. Hui-Jun Yi, Sung-Soo Kang, Gum-Bin Yu, Won-Hak Bae, Hyun-Soo Moon : Comparison of Mechanical Properties and Microstructural Charateristies of Tandem GMAW Weld Metal in 490MPa Grade Steel, KWJS, 27-2 (2009), 76-81 (in Korean)
5. Hyun-Woo Choi, Jong-Soo Yang, Sang-Myung Cho : A Study on the High Speed One Side Tandem Flux Cored Arc Welding, KWJS, (1999), 156-160 (in Korean) 6. H.Nomura, J.E.Middle : Development and Application
of Arc Sensor Control with a High Speed Rotating Arc Process, Sensors and Control Systems in Arc Welding, Chapman & Hall, Ch. 28, 247-256 (1994) 7. Dong-Chul Kim, Tae-Won Chang, Dong-Ryeol Yoon,
Tae-Wuk Woo, Chang-Gook Park : Tandem Electrogas Welding of Higher-strength Hull Structural Steel, KWJS, 2006, 75-76 (in Korean)