GPS ․ GIS 기법을 활용한 태풍 후 해운대 해빈지형의 3차원 변화 탐지 및 분석
홍현정1※․ 최철웅2 ․ 전성우3
Detection and Analysis of Post-Typhoon, Nabi Three-Dimensional Changes
in Haeundae Sand Beach Topography using GPS and GIS Technology
Hyun-Jung HONG1※․ Chul-Uong CHOI2 ․ Seong-Woo JEON31
요 약
국내 해빈지대는 인위적 개발과 기상학적 현상, 특히 태풍의 영향으로 다량의 모래가 유실되고 있어, 장기적 측면에서 침식이 지속적으로 발생하는 해빈지대의 모니터링이 요구되며, 해빈침식 방 지를 위한 종합대책 수립 및 시행 작업이 필요하다. 그러나 현재까지 정확한 측량이 이루어지지 않은 채, 모래 유실에 관한 문제 제기나 일시적 대책 마련에 급급하고 있다. 그러므로 본 연구에서 는 해운대 사빈지역을 대상으로, GPS 기법을 이용하여 해안지대의 정확한 공간자료 구축 방법을 제시하고, GIS 기법을 활용하여 태풍 Nabi로 인한 사빈지형 변화를 정량․정성적으로 탐지하고 분 석하였다. 연구결과, 태풍 후, 사빈 평균고도는 1.95 m, 총면적은 53,441 ㎡, 총체적은 104,639 ㎥ 로, 호안벽의 영향으로 사빈고도는 0.06m 가량 증가하였으나, 강풍과 북북동의 정온입사파 영향으 로 해빈면적은 3,096 ㎡, 체적은 2,320 ㎥ 가량 침식하였다. GPS․GIS 기법을 통합하여 해안지대 의 정확한 공간 DB를 구축하고 해안지형 변화를 정량․정성적으로 분석한다면, 국내 해안침식에 대한 체계적이고 효과적인 대책을 고안할 수 있을 것으로 사료된다.
주요어 : GPS, GIS, 태풍 Nabi, 사빈침식, 3차원 지형변화.
ABSTRACT
As beaches throughout Korea have suffered great losses of sand due to artificial developments and meteorological phenomena, particularly typhoons, it is necessary to monitor
2006년 6월 12일 접수 Received on June 12, 2006 / 2006년 8월 31일 심사완료 Accepted on August 31, 2006 1 한국환경정책평가연구원 Korea Environment Institute
2 부경대학교 위성정보과학과 부교수 Assistant, Prof., Department of Satellite Information Science, Pukyong National University 3 한국환경정책평가연구원 Korea Environment Institute
※ 연락저자 E-mail : [email protected]
beaches that are prone to erosion continuously, establish and enforce a comprehensive plan to attack coastal erosion with the object of the long-term management. However, debates and temporary measures, not based on accurate coastal zone surveys and analyses, have been established up to now. Therefore, with Haeundae sand beach as a case study, we proposed methods to collect accurate spatial data of the coastline and the sand beach through GPS survey. And we detected and analyzed topographic changes resulting from Typhoon Nabi quantitatively and qualitatively, by using GIS technique. Results showed a mean elevation of 1.95 m, a total area of 53,441㎡, and a total volume of 104,639 ㎥ after Typhoon Nabi. Mean elevation rose 0.06 m between the pre- and the post-typhoon surveys by a protective shore wall. However, strong winds and north-northeast surges brought by the typhoon caused erosion of the area and the volume, by 3,096 ㎡ and 2,320 ㎥. Accurate spatial databases of coastal zones based on integrated GPS․GIS techniques and quantitative and qualitative analyses of topographical changes will help Korea develop systematic and effective countermeasures against coastal erosion.
KEYWORDS : GPS, GIS, Typhoon Nabi, Sand Beach Erosion, 3D Topographical Change
INTRODUCTION
Sand beaches and cliffs of Korea's coastal zone attract tourists to shore resorts and swimming beaches. However, natural impacts including typhoons and tidal waves, combined with artificial developments including reclamation projects, the construction of tidal embankments, and indiscriminate sand mining have damaged the coastal environment. Haeundae swimming beach has also lost sand and dramatically decreased in scale due to typhoons and overdevelopment. The Haeundae district office has refilled beach sand since the early 1990s at a yearly cost of 30 million won. To protect coastal zones, such as coastlines, beaches, and tidal zones, the Korean Ministry of Maritime Affairs and Fisheries established the coast control law in 1999 and countermeasure to coastal erosion. Countermeasure includes data collections and data analyses, with the
overall goal of effectively managing coastal erosion. However, given the relatively short time since the implementation of the law and the start of coastal monitoring, the coast control project has thus far primarily focused on restoring facilities. Long-term measures to manage and protect the coastal zone have yet to begin.
Basic monitoring studies and preventive measures using levelling or photogrammetry have been conducted in Korea. Son and Park (2004) temporarily leveled a beach to examine coastal erosion. And Lee et al.
(2005) detected coast changes caused by erosion, using coordinates and depths surveyings. Choi and Kim (2001) analyzed long-term coastline changes using aerial photos, and Cho et al. (2001) quantitatively estimated changes in coastlines by coastal cliff erosion. However, unlike Korea, new techniques that do not rely on visual interpretations of images have also been introduced in the outside. White et al. (1999)
distinguished areas of erosion based on Landsat thermal images. And Li et al.
(2003) extracted three-dimensional coastline data from panchromatic stereo images observed by the IKONOS satellite.
On 6 September 2005, Busan experienced an indirect impact from the strong winds and heavy rain of Typhoon Nabi. Abundant beach sand appeared to have been lost, necessitating countermeasures when the typhoon passed through the East Sea. It is important to construct previous and present data on coastal zones, for establishing countermeasure to coastal erosion and predicting the next situation. And suitable survey techniques are selected according to the accuracy, the analysis plan and so on.
Although, in Korea, suggestions of problem or temporary counterplan on this phenomenon have been presented up to date, without the careful examination of survey technologies and periodical survey on beach.
Therefore, with Haeundae sand beach as a case study, we proposed methods to collect accurate spatial data of the coastline and the sand beach through GPS survey. And we detected and analyzed topographic changes resulting from a typhoon quantitatively and qualitatively, by using data from numerous survey points and GIS techniques. We would like to help ones to study coastal erosion from now on.
MATERIALS AND METHODS
In Korea, spatial data on beaches have been constructed typically by sand-elevation experiments or total station instruments.
While accurate measurement results can be
obtained from these methods, high costs and difficulties involved in surveying all sectors of beaches make these techniques impractical for monitoring beach zones.
Photogrammetry is also useful for analyzing temporal geographic changes as large areas can be surveyed periodically. However, the reliability goes down when observing object itself or analyzing object quantitatively and sectionally. Therefore, these methods can be applied as auxiliary survey methods to verify the accuracy under substantial coastal zone monitoring projects.
As GPS technologies provide the 3D position information regardless of time and changes in the weather, it applied to geodetic parts to require the detailed drawing equivalent to 'cm' degree.
Therefore we selected the GPS technology to construct the data for monitoring Haeundae sand beach topographical change by Typhoon, Nabi. Kinematic GPS acquires the coordinate of the object area as the below principal; One surveyor sets up GPS device 'A' in the point which a surveyor has knows the coordinate of; Another surveyor equiped with GPS device 'B' makes a round in the object area; then, GPS device 'A' sends signals to satellites;
satellites send signals, that is transmitted from the GPS device 'A', to GPS device 'B'; GPS device 'B' records coordinates of the object area in the real time. As kinematic GPS obtains quickly position information on all sectors of the object place, we surveyed the topography of Haeundae sand beach in kinematic GPS method. For the sand beach survey, we manufactured a special case to prevent rain
(a) Datum point survey (b) Foreshore survey (c) Backshore survey FIGURE 1.
(a) SPOT image of study area (b) Sand beach survey drawing (c) Sand beach survey drawing (Pre-Typhoon Nabi) (Post-Typhoon Nabi)
FIGURE 2.
or sand from entering GPS devices and improved storage memory to allow for longer data collection. We used geodetic surveying GPS devices such as Ashtech Z-FX and Trimble 5700, and adjusted the epoch time to 1 second and the mask elevation angle as 10°, considering receiving errors and refraction errors.
As the date of surveying, we selected the date conforming to the spring tide, when the difference between the rise and fall of the tide is the largest, in order to extract the coastline and the sand beach accurately under the identical condition that was exclusive of meteorological factors. So we conducted the first survey on 20-21 August 2005, prior to the arrival of Typhoon Nabi. With reference to the tidal prediction offered by Ministry of Maritime
Affair and Fisheries, the second survey was conducted on 19-20 September 2005 conforming to the first spring tide after Typhoon Nabi had passed. We selected Pukyong university in Busan as the temporary base point. We surveyed the foreshore by directly walking at 1.5m intervals from the coastline, as shown in Fig.1 (b), and surveyed the backshore by driving an off-road vehicle loaded with two GPS antennas as shown in Fig.1 (c).
We could improve the operation efficiency applying an off-road vehicle to the sand beach survey. As a result of comparing an efficiency of the walking survey with one of the vehicle survey, we could survey the distance equivalent to 3 km by 1 point per 90 min. But a vehicle could survey the distance equivalent to 9 km by 2 points per
90 min. As it words, the survey efficiency of using an off-road car was 6 times higher than one of using a pedestrian.
We processed data received from GPS devices using Trimble Geomatics Office V1.50 software. During the September GPS survey, some of GPS signals were lost due to the separation of the GPS device from the battery while driving the off-road car on the uneven sand beach. However, the condition of receiving GPS signals was generally good. After processing and adjusting the baseline, all errors at surveyed points were within min. ±1 cm and max. ± 1.8 cm, indicating the high accuracy of GPS surveys. We converted position information on processed points to the DGN file format supported by MicroStation SE software. And we manufactured original survey drawings as shown in Fig. 2.
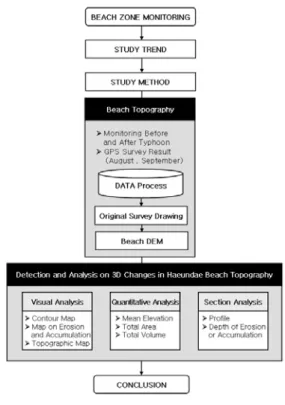
We set up survey results at predicted time to occur the low tide by Ministry of Maritime Affair and Fisheries as the sea level and we extracted the coastline and the sand beach topography of Haeundae from sand beach survey drawings. As grid data is more useful than vector data for the connection with RS data, the overlay analysis of layers and the simulation, we extracted digital elevation models (DEMs) composed of grids from GPS survey results using Intergraph MTA & InRoads. And then we accomplished the visual analysis, the statical analysis and the sectional analysis of DEMs, using GIS software such as Modular GIS Environment and Arcview GIS 3.3, and detected three dimensional changes in the sand beach. (Fig. 3)
RESULTS AND DISCUSSION
1. Visual detection and analysis of post-typhoon Nabi changes in sand beach topography
For the visual detection and analysis, we draw contour maps (Fig. 4), coastline maps, and a map of sand beach erosion and accumulation (Fig. 5) using pre- and post-typhoon sand beach DEMs. Distances between contours and the distribution of contours indicated that the sand beach topography near the shore protection wall was more elevated after Typhoon Nabi and formerly steep slopes had become gentler.
However, the topography was uneven as sand was not distributed evenly in all areas.
FIGURE 3. Flow chart of study methods We examined changes in the sand beach
FIGURE 5. (a) Coastlines (b) Distribution map of erosion and accumulation FIGURE 4. Contour maps of the sand beach (a)
Before typhoon (b) After typhoon area by extracting the coastline contours (given by a height of 0 m relative to sea level). Analysis results showed that based on the Busan Aquarium, the west sand beach had increased by 2510 ㎡ and the east sand beach had eroded by 4316 ㎡. The map of erosion and accumulation, as shown in Fig. 5(b) also showed accumulation of the west sand beach and erosion of the east sand beach.
2. Quantitative detection and analysis of post-typhoon Nabi changes in sand beach topography
As the number of the pixel distribution by elevations can be acquired by the histogram of the sand beach DEM having z values, it is useful to derive the histogram of DEM when the quantitative analysis such
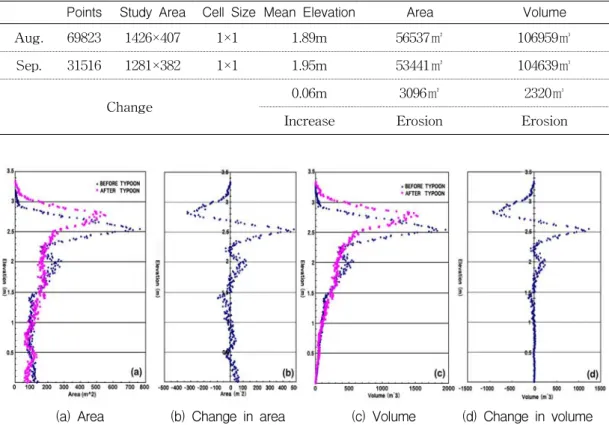
as computing and analyzing the mean elevation, the area and the volume. To improve the accuracy of histogram, we set up the interval of the histogram as 1 cm and extracted histograms of pixels composing sand beach DEMs. From histograms of sand beach DEMs, We derived computed mean elevations, areas and volumes. We then created charts of areas and volumes by elevations, as shown in Table 1 and Fig. 6.
The statistical analysis of the sand beach DEM for the September survey showed a mean elevation of 1.95 m, a total area of 53,441 ㎡, and a total volume of 104,639 ㎥.
Though the mean elevation had gained 0.06 m, the area and the volume had decreased by 3096 ㎡ and 2320 ㎥, respectively.
The mean elevation likely increased because sand near the coast moved toward
Points Study Area Cell Size Mean Elevation Area Volume
Aug. 69823 1426×407 1×1 1.89m 56537㎡ 106959㎥
Sep. 31516 1281×382 1×1 1.95m 53441㎡ 104639㎥
Change 0.06m 3096㎡ 2320㎥
Increase Erosion Erosion
Table 1. Statistical summary of sand beach topographic change (Based on 0m above sea level)
(a) Area (b) Change in area (c) Volume (d) Change in volume FIGURE 6. Sand beach topographic change graphs by elevations
the coastal road and accumulated at the shore protection wall. In contrast, strong winds and waves by the storm led to decreases in the total area and the volume.
Sand beach elevation categories increased or decreased after Typhoon Nabi as follows:
decrease at 0 - 0.4 m, increase at 0.4 - 0.6 m, decrease at 0.6 - 1.0 m, increase at 1.0 - 1.5 m, decrease at 1.5 - 2.7 m, and increase above 2.7 m. Post-typhoon volumes by elevations changed very little at 0 - 1 m, accumulated at 1 - 1.5 m, decreased at 1.5 - 2.7 m, and accumulated above 2.7 m. The elevation exhibiting the maximum erosion in area and volume was 2.5 m. These findings indicate that waves moved onto the sand
beach to an elevation of 2.5 m; the receding waves carried away large quantities of sand from areas above and below 2.5 m in elevation. If the area and the volume conforming this elevation that tourists take place are eroded continuously, the value of Haeundae sand beach as a tourist resort would be dropped.
3. Sectional detection and analysis of post-typhoon Nabi changes in sand beach topography
For the sectional detection and the analysis, we divided Haeundae sand beach in 10 sectors at equal interval as 160 m, starting from Chosun Beach Hotel like Fig.
Sector
Distance 1 2 3 4 5 6 7 8 9 10
0 E
․
0.1654․ ․ ․ ․ ․ ․ ․
0.0989A
5 E
․
0.9999․ ․ ․ ․ ․ ․ ․
0.5864A
10 E 0.0713 0.7535 0.2491 0.0208 0.4795 0.4013 1.0739
A 0.945 0.8248 0.0178
15 E 0.3344 0.4498 0.0111 0.28575 0.7386 0.4124 0.4970
A 1.3594 1.3403
․
20 E 0.5974 0.1460 0.0399 0.3228 0.6774 0.3446 0.5926
A 1.7739 1.4279
․
25 E
․
0.3174 0.1823 0.5831 0.1375 0.8068․
A 0.7970 0.1988 0.0065
30 E
․
0.0373 0.0418 0.4874 0.4158․
A 0.1660 0.5434 0.0531 0.0698
35 E
․ ․
0.1769 0.1994․
A 0.1400 0.3999 0.0821 0.1183 0.0413
40 E
․ ․ ․
A 0.3173 0.2566 0.1113 0.2784 0.1330 0.0128 0.0170
45 E
․ ․ ․ ․ ․
A 0.1170 0.0185 0.2253 0.1150 0.0589
50 E
․ ․ ․
0.0224 0.0741․ ․
A 0.1719 0.0968 0.1049
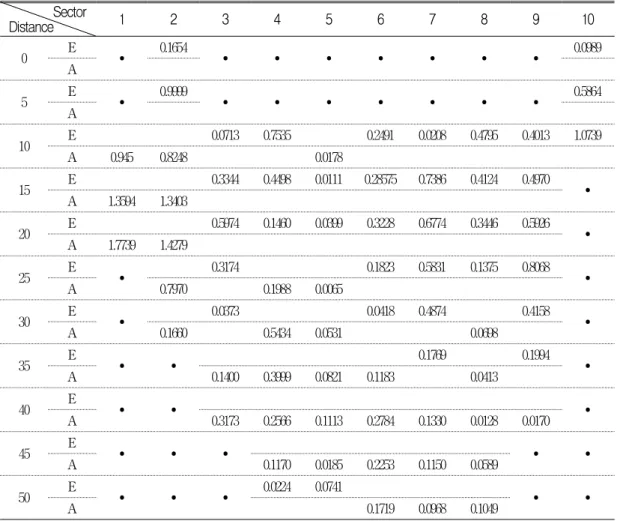
Table 2. Erosion(E) and accumulation(A) depths by cross sectors (Unit:m) 2(a) and generated cross sections of the
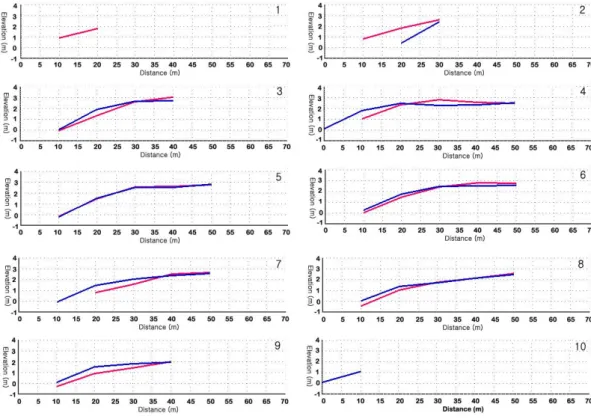
sand beach topography before and after Typhoon Nabi. We then overlaid these cross sections and computed depths of erosion and accumulation, as shown in Fig. 7 and Table 2.
Trends in erosion or accumulation for cross sections were as follows: 0 - 5 m, erosion of the east and the west sand beaches; 5 - 25 m, accumulation at the west sand beach, erosion of the central and the east sand beaches; 25 - 30 m, accumulation at the west sand beach, erosion of the east
sand beach; 30 - 35 m, accumulation at the central sand beach, erosion of the east sand beach; 35 - 40 m, accumulation at the central and the east sand beaches; 40 m and above, accumulation at the central sand beach.
Except for the 0 - 5 m section, all sections of the west sand beach experienced accumulation, while slight erosion occurred at the central sand beach. Furthermore, except for the 35 - 40 m section, erosion affected all other sections of the east sand beach.
4. Causal Analysis of post-typhoon Nabi
FIGURE 7. Elevation graphs by cross sections (Blue: Before typhoon nabi, Red: After typhoon nabi)
changes in sand beach topography
Above detections and analyses showed that sand generally accumulated at the west sand beach, while erosion was the tendency elsewhere. Erosion particularly affected the east sand beach. In fact, during the September GPS survey, it was difficult to access the east sand beach;
whereas this area had been covered with sand in August, Typhoon Nabi had driven in broken rocks that blocked access in September. It is estimated that these phenomenon are affected by Dongbaek Island.
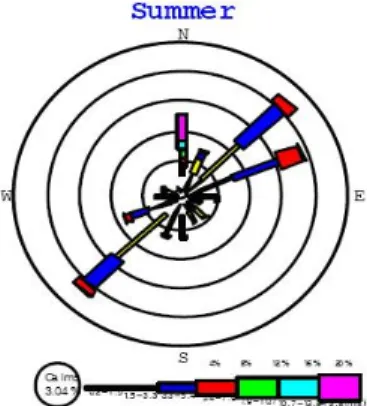
At the study area, Typhoon Nabi, which had a maximum wind velocity of
12.5 m/s in a north-northeast direction, generated surges exceeding 3 m.
North-northeast surge reached the sand beach and washed away sand, particularly at the central and the east sand beaches.
However, a natural spur, Dongbaek Island, blocked surges from directly reaching the west sand beach. Therefore, it is estimated that sand beach erosion was not generated at the west sand beach by Dongbaek Island.
It is estimated that these phenomenon are affected by season, too. According to the video monitoring on Haeundae sand beach accomplished by Ministry of Maritime Affairs and Fisheries of Korea, the west sand beach is eroded and the east sand beach, accumulated in summer.
FIGURE 8. Change in sand beach shape by
seasons (2004) FIGURE 9. Summer wind rose
We demonstrated this phenomenon by scanning and ortho-rectifying aerial photos and digitizing the sand beach. We set up sectors ranging from Chosun Beach Hotel indicated in Fig. 7 to Mipo port. As a result of measuring areas confirming to each sectors, the area of the west sand beach was decreased and one of the east sand beach, increased in summer because movement of minute sand affected by monsoon (Fig 8). However, the west sand beach was accumulated and the east sand beach, eroded in winter. Therefore, it is estimated that the typhoon eases the erosion on the west sand beach in summer.
CONCLUSIONS
To estimate the effects of the typhoon on the sand beach topography, we monitored Haeundae Sand Beach before and after Typhoon Nabi using GPS surveys. This study achieved the following.
We used a kinematic GPS method to survey Haeundae sand beach topography and investigated changes in the sand beach
topography caused by Typhoon Nabi. Sand beach surveys were conducted before and after Typhoon Nabi. All errors for surveyed points were within min. ±1.0 cm and max.
±1.8 cm, indicating the high accuracy of GPS surveys. We extracted DEMs from survey results and the resulting structured spatial data revealed the state of Haeundae sand beach before and after Typhoon Nabi.
Visual analysis of the sand beach topographic change revealed that the typhoon had created a gentler slope to the once-steep sand beach. The typhoon also increased the sand beach elevation near the shore protection wall. The shore protection wall likely prevented the strong typhoon winds from moving sand onto the coastal road; sand was unevenly distributed after the typhoon.
Quantitative analysis of the September topographic survey results showed a mean elevation of 1.95 m, a total area of 53,441㎡, and a total volume of 104,639 ㎥. Mean elevation rose 0.06 m between the pre- and post-typhoon surveys. However, the area and the volume decreased by 3096 ㎡ and 2320 ㎥, respectively. Maximum erosion by the area and volume occurred at elevations
of 2.5 m. These results indicate that waves extended up the sand beach to an elevation of 2.5 m and receded, carrying along large quantities of sand.
Sectional analysis of the sand beach topographic change showed general accumulation at the west sand beach.
However, erosion generally affected other areas. The east sand beach clearly experienced erosion. Areas exposed to the strong north-northeast surge, such as the east and the central sand beaches, particularly suffered sand beach erosion.
However, Dongbaek Island and monsoon blocked surges from fully reaching the west sand beach, which did not erode in general.
In this study, we demonstrated that it is possible to construct easily accurate spatial data on the coastal zone within a short period using GPS survey, and to detect precisely topographical changes using GIS method. We are sure that the creation of spatial data by GPS survey and analysis of spatial data by GIS technique, would be useful to detect the topographic change under the influence of meteorological or artificial factors. Furthermore they would be also a great help to monitor all coastal zones over the nation, to design systematic and effective countermeasures to coastal erosion and to provide that the essential information for the management of bathing resorts. Therefore, based on the methodology indicated in this paper, the collection of
spatial data and the monitor on domestic
coastal zones should be accomplished as soon as possible.
REFERENCES
Chul Uong Choi and Young Seup Kim. 2001.
Coastline Change on the Haeundae Beach using the Digital Aerial Photo. Korean Association of Geographic Information Studies 4(4):73-85.
Hyung Seok Lee, Dae Yong Um and Eun Suk Jang. 2005. Monitoring of Coastal Erosion and Accretion Changes using Sea Wall Surveying. Korean Association of Geographic Information Studies 8(2):186-195 Il Son and Kyeong Park. 2004. The Change of
Hagdong Shingle Beach and its Causes-By Monitoring theChange of Beach Profiles-.
Korean Regional Geography 10(1):177-191.
Ju Whan Cho, Dhong il Lim and Baeck Oon Kim. 2001. Observation of Shoreline Change Using an Aerial Photograph in Hampyung Bay, Southwestern Coast of Korea. Korean Earth Science Society 22(4):317-326.
The KukMin Ilbo. 2004/06/13. 'Warning'; Big Loss of Beach Sand by Building Artificial Structures in Summer Exodus.
Kevin White and Hesham M. El Asmar. 1999.
Monitoring Changing Position of Coastlines Using Thematic Mapper Imagery, an Example from the Nile Delta. Geomorphology.
29: 93-105.
Li, R., Di, K. and Ma, R.. 2003. 3D Shoreline extraction from IKONOS satellite imagery.
Photogrammetric Engineering and Remote Sensing 69(1):59-68.
Ministry of Maritime Affair and Fisheries.
2005. Beach Map. www.nori.go.kr