Print ISSN: 2288-4637 / Online ISSN 2288-4645 doi:10.13106/jafeb.2020.vol7.no9.209
China-ASEAN Trade Relations: A Study of Determinants and Potentials
Hiep Xuan TRAN
1, Nhan Thanh Thi HOANG
2, Anh Thuy NGUYEN
3, Hoan Quang TRUONG
4, Chung Van DONG
5Received: June 25, 2020 Revised: July 05, 2020 Accepted: August 10, 2020
Abstract
The purpose of this study is to investigate the development and determinants of China-ASEAN trade relations over the period of 2000-2018.
Employing both the qualitative and quantitative approaches, the results show that the trade relations between China and the Association of South East Asian Nations (ASEAN) have remarkably developed and rapidly grown over times, with a significantly important concentration on the segments of high technological and medium technological products. We also find that China’s economic scale is crucially impacting on the China-ASEAN trade relations under both the aggregate and sub-sector level. It is interesting to notice that there is no evidence to support accession to the World Trade Organization (WTO) and officially forming of ASEAN-China Free Trade Agreement (ACFTA) to enhance trade relation between both sides. The findings also quantitatively indicate that there is much significant potential for the expansion of mutual trade between China and some members of ASEAN such as Brunei, Laos and Malaysia, while less potential is predicted for other members of ASEAN. It is strongly suggested that China and ASEAN should find a new proactive approach and make more efforts in improving the mutual political trusts to enhance trading activities in the coming years.
Keywords: China-ASEAN, Trade Structure, Technological Content, Trade Potential JEL Classification Code: F10, F12, F13, F14, F17
in 1991, a changing regional and global context has provided opportunities for China and ASEAN countries to forge closer relations. These include the constructive role played by the government of China in dealing with the Asian financial crisis coupled with changing U.S. priorities in Asia during the late 1990s, China’s accession to WTO in 2001,the full establishment of the ACFTA in 2010, and the forming of ASEAN Economic Community (AEC) at the end of 2015 (Santasombat, 2018).
Especially, in 2013 China launched its Belt and Road Initiative (BRI), including the Maritime Silk Road and the Silk Road Economic Belt, aiming to boost China’s global trade by building rail and sea links connecting it with Southeast Asia and Europe (Balandchard, 2018). Besides the BRI, the Asian Infrastructure Investment Bank (AIIB) – a China-led initiative officially launched in 2014, aiming to improve connectivity between the countries in the Asian region via funding of vast infrastructure projects (Chen, 2018). The two sides’
cooperation also takes place in other frameworks such as
“ASEAN plus three” (ASEAN and its three partners, China, Japan and South Korea), and the Regional Comprehensive Economic Partnership-RCEP (currently including ASEAN, China, Japan, South Korea, Australia and New Zealand).
Obviously, the reciprocal trade flow is one of the most notable successes in the development of China-ASEAN
1. Introduction
Following the implementation of the reform and opening- up policy in 1978, China has achieved very high economic growth for next four decades with sharp changes in terms of economic size, economic structure, and China’s position in the global economy (Ju & Yu, 2018). Meanwhile, ASEAN was established back in 1967, but it has been recently considered an emerging economic bloc in the region (Truong et al., 2019a;
2019b). Following the establishment of strategic partnership
1
First Author. Institute of Socio-Economic Research, Duy Tan University, Da Nang, Vietnam. Email: tranxuanhiep@dtu.edu.vn
2
Dong Do University, Hanoi, Vietnam. Email: nhanth_iwep@yahoo.com
3
Faculty of Political Economy, VNU University of Economics and Business, Hanoi, Vietnam. Email: maichithuyanh@gmail.com
4
Institute for Southeast Asian Studies, Vietnam Academy of Social Sciences, Hanoi, Vietnam. Email: quanghoan2310@gmail.com
5
Corresponding Author. Institute of World Economics and Politics, Vietnam Academy of Social Sciences, Vietnam [Postal Address: 1 Lieu Giai, Ba Dinh, Hanoi, 10000, Vietnam]
Email: chungdv.iwep@vass.gov.vn
© Copyright: The Author(s)
This is an Open Access article distributed under the terms of the Creative Commons Attribution Non-Commercial License (https://creativecommons.org/licenses/by-nc/4.0/) which permits unrestricted non-commercial use, distribution, and reproduction in any medium, provided the original work is properly cited.
economic relations. The figures from United Nations Conference on Trade and Development (UNCTAD) show that the mutual trade activities had reached a peak of US$497.6 billion in 2018 from only US$39.7 billion in 2000.
Consequently, not only China, but also ASEAN as a bloc and each member of ASEAN as well have turned into the crucially significant counterparts to each other, somehow much more important in favor of ASEAN. This study seeks responses to two question: What are factors influencing China-ASEAN trade, under both aggregate trade and technological content?
Is there much room for trade expansion between China and ASEAN countries?
The existing literature includes much research on mutual trade flows among partners or between regions. With a rapid economic growth and playing an increasingly vital role in the international trade, it is no doubt that the East Asian region has been the object of attention of scholars (Gaulier et al., 2007; Athukorala, 2011; Armstrong, 2015;
Truong et al., 2019a, 2019b). One of the most common findings from the literature is that manufacturing sectors have mainly traded and occupied a largest share in total trade flows in the region. The major role comes from global companies in Japan, right after China, and followed by South Korea. Going in line with this trend, members of ASEAN bloc have joined and penetrated more deeply economic networks regionally and internationally, especially taking a vital role in the global value chain. It is not surprising that China-ASEAN trade relations have been the center of attention by not only policy-makers
of both sides, but also international scholars. We might list here a range of influential works by Wong and Chan (2003), Men (2007), Devadason (2010), Chin and Stubbs (2011), Chakraborty and Kumar (2012), Liqin (2012), Tai and Soong (2014), Tham et al. (2016), Hye et at. (2016), Rao and Pathak (2016), Chiang (2019), He and Wang, (2019), and Oktora and Firdani (2019).
An in-depth review on the literature reveals an academic gap. Even though the reciprocal trade relation between China and ASEAN has been examined, most have been done through qualitative approaches such of descriptive statistics or comparative studies. There is a huge lack of empirical evidence on the determinants of China-ASEAN trade under both aggregate trade and sub-sector trade analyzed with quantitative methods such as econometrics.
By applying the gravity model with a PPML (Poisson pseudo-maximum-likelihood) estimator proposed by Santos Silva and Tenreyro (2006, 2011), our current paper will investigate the factors influencing trade activities between China and ASEAN as a whole and sub-sectors, i.e., technological content over the period 2000 to 2018.
We also provide a prediction of trade potential between China and ASEAN to help readers and policy-makers have a broader view in the years ahead.
The remainder of present paper is structured as follows.
Section 2 considers trade performance and trade structure.
Section 3 looks in details at the determinants of China- ASEAN trade. Section 4 explores the trade potential. Section 5 provides concluding remarks.
- 50 100 150 200 250 300 350
2000 2001 2002 2003 2004 2005 2006 2007 2008 2009 2010 2011 2012 201 3 201 4 201 5 201 6 201 7 201 8
China's export to ASEAN
China's import from ASEAN
China's trade balance with ASEAN
Source: Author’s combination and calculation using data from UNCTAD.
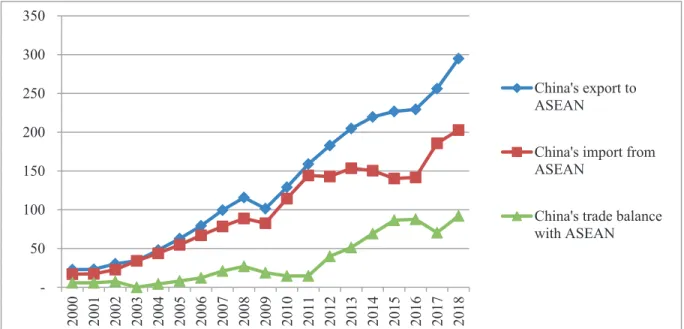
Figure 1: Bilateral Trade in Goods between China and ASEAN (US$ billion)
2. Main Characteristics of China-ASEAN Trade Relations
Retrieved from the database of UNCTAD, Figure 1 compiles and visualizes the trade performance between China and ASEAN for period 2000 to 2018. Total trade and separate components of trade have been grown widely for both sides. In particular, the total exports by China to members of ASEAN jumped to US$294.8 billion in 2018, from US$22.7 billion in 2000 and US$129.0 in 2010. This means that within less that 20 years, China’s exports to ASEAN increased thirteen-folds.
Total imports to China from southeast Asian countries grew dramatically, recording US$202.7 billion in 2018, compared to US$16.9 billion in 2000, US$54.7 billion in 2005 and US$114.4 billion in 2010. The balance of trade is in China’s favor. Computation from data of UNCTAD reports that trade surplus is worsening in ASEAN, climbing up US$92.0 billion in 2018, growing roughly fifteen-fold compared with the figure of US$5.7 billion in 2000. It is worth noting that China’s trade surplus with ASEAN expanded very rapidly after the full establishment of the ACFTA in 2010, suggesting that signing the ACFTA was much better for China than ASEAN members (see Figure 1).
On an important level, processed data from UNCTAD show that in 2018 the share of trade, exports and imports with China on ASEAN’s trade, exports and imports with the world reached 17.25%, 13.94% and 20.58%, respectively. China has been ASEAN’s top trading partner for 10 consecutive years. In the opposite direction, ASEAN is China’s third largest trading partner, after the European Union (EU) and the USA, for eight years in a row. More specifically, in 2018 China was the largest source of imports for nine out of the 10 ASEAN economies (Cook, 2019). In the same year, China was the largest national export market for four ASEAN member states, namely, Indonesia, Myanmar, Singapore and Thailand; and the second largest for three of them, namely,
Laos, Malaysia (after Singapore) and Vietnam (after the USA). Meanwhile, China was the third largest national export market for the Philippines, the fifth largest for Cambodia, and only the eighth largest for Brunei (Cook, 2019). In terms of market distribution, Table 1 shows that trade exchange between China and ASEAN principally focused on the largest member economies, namely, Singapore, Malaysia, Indonesia, Thailand, and Vietnam, while the trade volume between China and Brunei, Myanmar, Laos and Cambodia was very low.
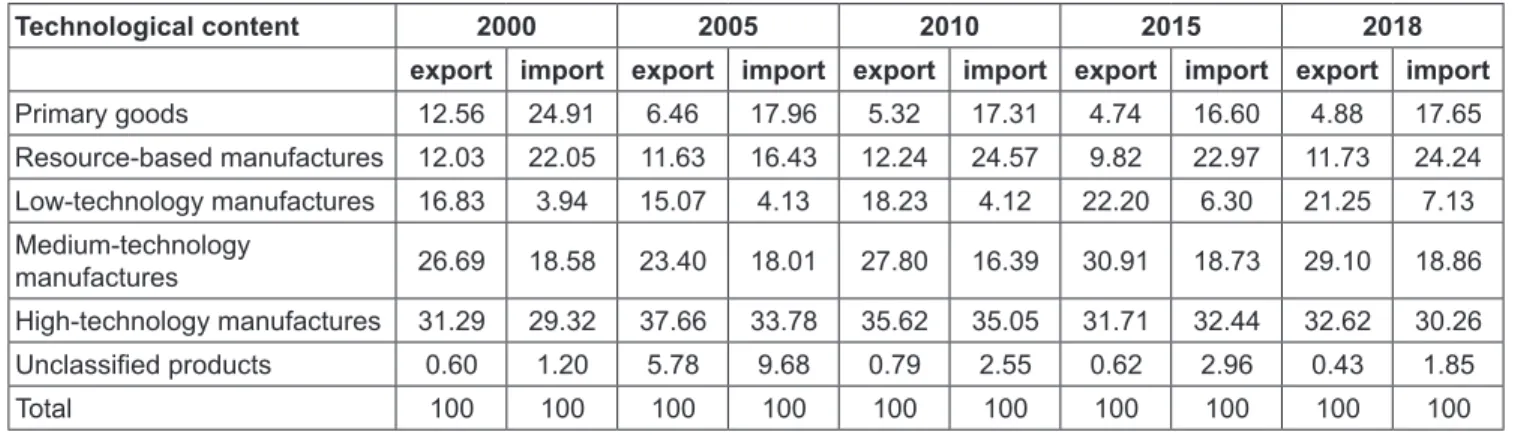
Going into the nature of trade, by using data from UNCTAD, Table 2 illustrates that the exports and imports between China and ASEAN consist of technological content.
In terms of exports, Table 2 indicates that over the 2000- 2018 period, China’s exports to ASEAN market had focused mainly on high technology and medium technology products, with the total share of the two sub-sectors accounting for about 60%. The next important sub-sector is low technology manufactured products, accounting for one-fifth of China’s total exports to ASEAN in 2018. On the other hand, the share of primary goods remained very low after 2005.
In terms of imports, Table 1 illustrates that China’s imports from ASEAN countries also concentrated on high technology products, accounting for about 30%. It is followed by resource-based product group that consisting of one-fourth of China’s total imports. The share of primary products in China’s imports from ASEAN declined over years, reaching 17% in 2018, while the share of low technology manufactured goods remained unchanged between 2000 and 2018, sharing 18%. All in all, the nature of the trade between China and ASEAN significantly focused on high technology and medium technology products, particularly in China’s export. This to some degree reveals the improvement of production capability in China and ASEAN countries as the high technology products often contain higher added value comparing to those with the low technology content (Truong et al., 2019b; Wong & Chan, 2003).
Table 1: China’s export to ASEAN by technological content (%)
Technological content 2000 2005 2010 2015 2018
export import export import export import export import export import
Primary goods 12.56 24.91 6.46 17.96 5.32 17.31 4.74 16.60 4.88 17.65
Resource-based manufactures 12.03 22.05 11.63 16.43 12.24 24.57 9.82 22.97 11.73 24.24 Low-technology manufactures 16.83 3.94 15.07 4.13 18.23 4.12 22.20 6.30 21.25 7.13 Medium-technology
manufactures 26.69 18.58 23.40 18.01 27.80 16.39 30.91 18.73 29.10 18.86
High-technology manufactures 31.29 29.32 37.66 33.78 35.62 35.05 31.71 32.44 32.62 30.26
Unclassified products 0.60 1.20 5.78 9.68 0.79 2.55 0.62 2.96 0.43 1.85
Total 100 100 100 100 100 100 100 100 100 100
Source: Author’s combination and calculation using data from UNCTAD.
3. Determinants of China-ASEAN Trade 3.1. Econometric Specification
As known widely, the gravity model was first used by Tinbergen (1962) to consider the influence of geographical distance and economic size on international bilateral trade.
Then, the model becomes one of the most popular approaches in exploring the determinants of international trade. The gravity model is shown as follows:
ijt it jt
ij
trade g M M
= D (1)
where, Trade
ijis trade value between targeted country i and destinated country j in year t; M
i, M
jpresent economic masses; D
ijis distance, and g is the gravitational term. It is straightforward to find that the equation (1) can be expressed in a linear form as following:
lntrade
ijt= lng + lnM
it+ lnM
jt+ lnD
ij+ σ
ijt(2) To investigate influencing factors on bilateral trade between China and ASEAN countries, we apply a gravity variation proposed by Anderson and Wincoop (2003), which is presented as follows:
lntrade
ij= β
0+ β
1lnM
it+ β
2lnM
jt+ β
3lnD
ij+ β
4R
ijt+ β
5γ
ijt+ σ
ijt(3) where R is a set of multilateral resistances, γ is a vector of gravity dummies, and σ is error term.
Admittedly, influencing factors on trade flows are different from each component, which may affect positively exports, but negatively import, and vice versa. Thus, we will estimate determinants of trade flows between China and ASEAN for imports and exports separately, which is exhibited in specific form as follows:
0 1 2
3 4 5
( ) ( )
ijt it jt it jt
ij ijt ijt ijt
lntrade ln gdp gdp ln income income
lnD R
β β β
β β β γ σ
= + +
+ + ∑ + ∑ +
(4a)
0 1 2
3 4 5
( ) ( )
ijt it jt it jt
ij ijt ijt ijt
lnexport ln gdp gdp ln income income
lnD R
β β β
β β β γ σ
= + +
+ + ∑ + ∑ +
(4b)
0 1 2
3 4 5
( ) ( )
ijt it jt it jt
ij ijt ijt ijt
lnimport ln gdp gdp ln income income
lnD R
β β β
β β β γ σ
= + +
+ + ∑ + ∑ +
(4c)
where, gdp denotes gross domestic products of China (i) and members of ASEAN (j) in year t; D is geographical distance between parties; R is a set of trading multilateral resistances including official member of the WTO (wto), the ACFTA (acfta), and joining BRI (obor); γ is a vector of gravity dummies consisting of sharing border (border), landlocked country (landlocked) and common language (language); and σ is error term.
3.2. Estimation Issues
It is important to realize that there are various elements that affect bilateral trade among countries. Thus, it is unavoidable there exists unobserved heterogeneity in estimating determinant variables (Gujarati, 2004). To reduce this problem, we use panel data for regression. Additionally, panel data also works well in investigating undetectably specific factors (Egger, 2002). In the literature, working with panel data, there are three techniques used for estimation – pool, fixed effects and random effects approaches. However, all three approaches cannot deal with a case of multiplicative model or a case of zero trade. As a result, these methods might possibly turn out with biases. In order to remedy this problematic issue, we employ the so-called PPML estimator, introduced by Santos-Silva and Tenreyro (2006). With strong theoretical foundation and significant empirical evidence, PPML approach has been considered as one of the most efficient techniques for estimating gravity equation (2011). Then, the estimation equation system (4) can be rewritten as follows:
0 1
2
3 4 5
( )
( )
ijt it jt
it jt
ij ijt ijt ijt
trade ln gdp gdp ln income income
lnD R
= +
+
+ + ∑ + ∑ +
β β
β
β β β γ σ (5a)
0 1
2
3 4 5
( )
( )
ijt it jt
it jt
ij ijt ijt ijt
export ln gdp gdp ln income income
lnD R
= +
+
+ + ∑ + ∑ +
β β
β
β β β γ σ (5b)
0 1
2
3 4 5
( )
( )
ijt it jt
it jt
ij ijt ijt ijt
import ln gdp gdp ln income income
lnD R
= +
+
+ + ∑ + ∑ +
β β
β
β β β γ σ (5c)
To check the appropriateness of PPML estimator,
heteroscedasticity-robust Reset Test-Ramsey test was also
performed as further empirical evidence. For the purpose of
providing a broader picture and comparing with the PPML
estimator, we operate the estimation with random effects
approach as well.
3.3. Data Analysis
Data and all relevant variables are gathered in a panel set including trade flows of exports and imports, gross domestic, geographical distance, gravity factors, and trading multilateral resistances over the period 2000-2018 period.
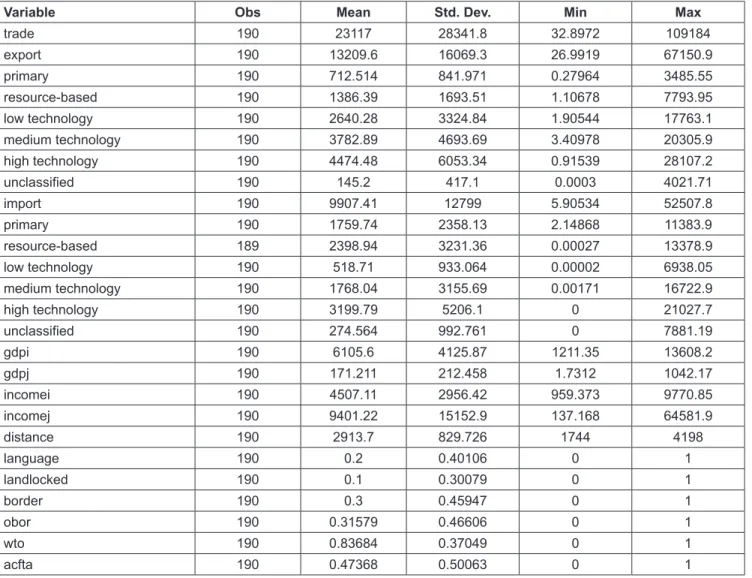
Descriptive statistics are summarized in Table 2.
Figures for trade value of exports and imports between China and ASEAN presented in U.S. dollars are retrieved from the UNCTAD database, while those on the gross domestic product are obtained from the World Development Indicators and the World Bank. In the literature, partners with a larger volume tend to trade more, thus factors of the gross domestic products are predicted with positive outcomes.
Variables of distance and gravity terms are obtained from GeoDist and CEPII, and are expected to turn out traditional results. Trading multilateral resistance variables are inserted
in the model to augment the adequacy of estimation; in addition, these variables expectedly reduce unobserved problems. Data on multilateral resistances are taken from official websites of regional and international organizations and official websites of interested governments.
3.4. Estimated Results
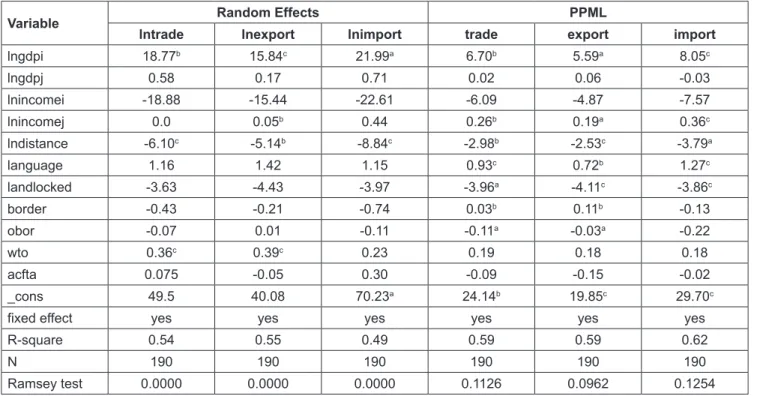
First, we estimate gravity equation system with both Random effects approach and PPML approach for aggregate trade and its components of exports and imports. The results are reported in Table 3. The outcomes for Ramsey test shown in the second to last row confirm that the PPML estimator is more appropriate. In addition, results with PPML technique are seemingly more significant than those with the Random effects estimator (higher S-square and more statistically significant coefficients).
Table 2: Descriptive Statistics
Variable Obs Mean Std. Dev. Min Max
trade 190 23117 28341.8 32.8972 109184
export 190 13209.6 16069.3 26.9919 67150.9
primary 190 712.514 841.971 0.27964 3485.55
resource-based 190 1386.39 1693.51 1.10678 7793.95
low technology 190 2640.28 3324.84 1.90544 17763.1
medium technology 190 3782.89 4693.69 3.40978 20305.9
high technology 190 4474.48 6053.34 0.91539 28107.2
unclassified 190 145.2 417.1 0.0003 4021.71
import 190 9907.41 12799 5.90534 52507.8
primary 190 1759.74 2358.13 2.14868 11383.9
resource-based 189 2398.94 3231.36 0.00027 13378.9
low technology 190 518.71 933.064 0.00002 6938.05
medium technology 190 1768.04 3155.69 0.00171 16722.9
high technology 190 3199.79 5206.1 0 21027.7
unclassified 190 274.564 992.761 0 7881.19
gdpi 190 6105.6 4125.87 1211.35 13608.2
gdpj 190 171.211 212.458 1.7312 1042.17
incomei 190 4507.11 2956.42 959.373 9770.85
incomej 190 9401.22 15152.9 137.168 64581.9
distance 190 2913.7 829.726 1744 4198
language 190 0.2 0.40106 0 1
landlocked 190 0.1 0.30079 0 1
border 190 0.3 0.45947 0 1
obor 190 0.31579 0.46606 0 1
wto 190 0.83684 0.37049 0 1
acfta 190 0.47368 0.50063 0 1
It is a well-known fact that the economic scale of China is one of the most crucial factors influencing both aggregate trade and separate elements of imports and exports. It is rationally understandable that with a huge economy and a rapid economic development, China is able to export more to ASEAN. With the same reason, China also needs to import more from ASEAN members. The estimated results for traditional gravity dummy variables mostly turn out with expected signs in which common language and sharing border (excepting for import) enhance bilateral trade, while a landlocked country is likely to deter trading activities between two parties. The estimated coefficients for wto and acfta are statistically insignificant, suggesting that joining the WTO and participating in the ACFTA seemingly do not contribute to trade flows. These results strongly support a recent argument that traditional regional-international trade platforms like the WTO, even the ACFTA are faded away in their effects and now the world needs new cooperation mechanisms such multilateral regionalism (Baldwin, 2006;
Baldwin and Low, 2009). Finally, estimated coefficients for obor are statistically significant and come up with reversed expectation, implying that recent efforts by China in promoting and fulfilling the BRI has made relatively limited gains. This may come from political concerns of ASEAN states about the hegemonic ambition of China, which might be beyond the purpose of economic
cooperation and development (Greiman, 2014; Das, 2018;
Gong, 2019).
Next, we produce estimation for sub-sections of trade classified by technology content. The results are reported in Table 4. Obviously, the estimated results for sub-sections of trade flows are partially different from outcomes for aggregate trade and trade components of exports and imports. The economic size of China helpfully contributes to export and import of low technology products to/from ASEAN members since the coefficients are statistically significant, while there is no impact on other sub-sections.
The explanation for those results lies in the characteristics and structure of trade between China and ASEAN countries. Looking in detail at trade figures, we can observe that the proportion of low technology products in total bilateral trade was significant. The estimation reveals the advantageous impact of a common language variable on many sub-sectors. On the contrary, physical distance is found to impede all sub-sectors for both export and import sectors. Of note it that getting involved with the BRI led by China predictably enhances export flows of low technology products to its ASEAN partners, but does not influence its imports from those countries. In a broader view, the BRI has seemingly failed to reach its target, but it still gains some relative achievements associated to exports of low technology products.
Table 3: Estimated Results under Random effects and PPML
Variable Random Effects PPML
lntrade lnexport lnimport trade export import
lngdpi 18.77
b15.84
c21.99
a6.70
b5.59
a8.05
clngdpj 0.58 0.17 0.71 0.02 0.06 -0.03
lnincomei -18.88 -15.44 -22.61 -6.09 -4.87 -7.57
lnincomej 0.0 0.05
b0.44 0.26
b0.19
a0.36
clndistance -6.10
c-5.14
b-8.84
c-2.98
b-2.53
c-3.79
alanguage 1.16 1.42 1.15 0.93
c0.72
b1.27
clandlocked -3.63 -4.43 -3.97 -3.96
a-4.11
c-3.86
cborder -0.43 -0.21 -0.74 0.03
b0.11
b-0.13
obor -0.07 0.01 -0.11 -0.11
a-0.03
a-0.22
wto 0.36
c0.39
c0.23 0.19 0.18 0.18
acfta 0.075 -0.05 0.30 -0.09 -0.15 -0.02
_cons 49.5 40.08 70.23
a24.14
b19.85
c29.70
cfixed effect yes yes yes yes yes yes
R-square 0.54 0.55 0.49 0.59 0.59 0.62
N 190 190 190 190 190 190
Ramsey test 0.0000 0.0000 0.0000 0.1126 0.0962 0.1254
legend:
a: p<0.05;
b: p<0.01;
c: p<0.001
4. Trade Potentials
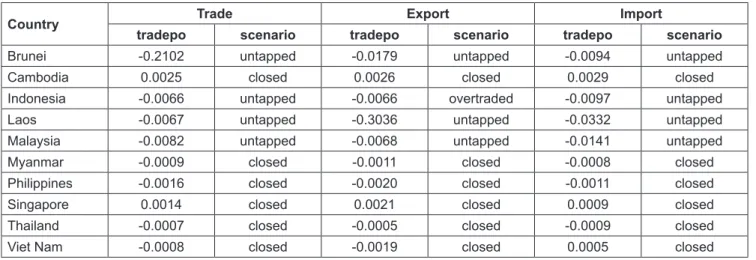
Obviously, there are many approaches, which can be possibly applied to forecast the bilateral trade potential between partners. However, it is accepted that the method of Average Standardized Trade Potential developed by Benedictis and Vicarelli (2005) is widely applied with advantageous strengths. In this paper, we simply follow the style of Benedictis and Vicarelli to predict the trade potentials between China and ASEAN. Then, the index of trade potential is specified as follows:
1
obs / est 1 obs / est 1
N