Fluorescence Characteristic Spectra of Domestic Fuel Products through Laser Induced Fluorescence Detection
Ting-Nien Wu*·Shui-Ping Chang·Wen-Hsien Tsai·Cian-Yi Lin
Department of Environmental Engineering, Kun Shan University, Tainan 71003, Taiwan, R.O.C.
ABSTRACT
Traditional investigation procedures of soil and groundwater contamination are followed by soil gas sampling, soil sampling, groundwater sampling, establishment of monitoring wells, and groundwater monitoring. It often takes several weeks to obtain the analysis reports, and sometimes, it needs supplemental sampling and analysis to delineate the polluted area. Laser induced fluorescence (LIF) system is designed for the detection of free-phase petroleum pollutants, and it is suitable for on- site real-time site investigation when coupling with a direct push testing tool. Petroleum products always contain polycyclic aromatic hydrocarbon (PAH) compounds possessing fluorescence characteristics that make them detectable through LIF detection. In this study, LIF spectroscopy of 5 major fuel products was conducted to establish the databank of LIF fluorescence characteristic spectra, including gasoline, diesel, jet fuel, marine fuel and low-sulfur fuel. Multivariate statistical tools were also applied to distinguish LIF fluorescence characteristic spectra among the mixtures of selected fuel products.
This study successfully demonstrated the feasibility of identifying fuel species based on LIF characteristic fluorescence spectra, also LIF seemed to be uncovered its powerful ability of tracing underground petroleum leakages.
Keywords : LIF, PAH, Fluorescence characteristics, TPH, Site investigation
1. Introduction
Since the promulgation of Soil and Groundwater Pollu- tion Remediation Law in 2000, fuel leakage of underground storage tanks and pipelines has caused 64 gas stations being listed as Soil and Groundwater Pollution Control Site and 15 gas stations being listed as Soil and Groundwater Pollu- tion Remediation Site in Taiwan. The major soil pollutant is total petroleum hydrocarbon (TPH) at contaminated gas sta- tions, and benzene is the most common groundwater pollut- ant exceeding the regulation standard (Taiwan EPA, 2014).
Traditional pollution investigation procedures are followed by vapor monitoring, soil gas sampling, soil sampling, establishing monitoring wells and groundwater monitoring (Taiwan EPA, 2006a). It often takes several weeks to obtain the rough outline of pollution zone at a site, and sometimes supplemental pollution investigation is needed to figure out the detailed contamination. Traditional pollution investiga- tion is often blind sampling, and thus it might obtain non-
representative samples involuntarily. Accordingly, expe- dited site investigation technologies are the better alterna- tive to enhance sample representativeness and data reliability, including geophysical method, direct-push sampling, novel soil gas sampling, on-site organic or metal detection, rapid screening reagents, etc. (Taiwan EPA, 2006b).
Among on-site organic detection tools, fiber-optical sen- sors have been developed to promote fast and reliable screen- ing and monitoring of environmental pollutants for several decades (Baumann et al., 2000). The presence of pollutants might be invisible to optical sensors due to their trace level.
Laser-induced fluorescence (LIF) techniques use laser as excitation source to improve luminescence sensitivity of the analytical tool (Amador-Hernández et al., 2001). In the early age, the use of a LIF instrument alone or combined with other optical measurement tools were applied to direct monitoring of gaseous pollutants, such as CO
2
, NO, NO
2
, N
2
O
5
, SO
2
, aerosol particle and aromatic hydrocarbons (Bessler et al., 2003; Miyazaki et al., 2008; Suzuki et al.
2011; Matsumoto et al., 2005; Matsumi et al., 2005; Taket- ani et al., 2013; Sirignano et al., 2012). The successful application of LIF spectroscopy has expanded to the detec- tion of chemicals in water, soil organic matter, solid organic waste, crude oil and soil contaminants (Uebel et al., 1996;
Martins et al., 2011; Muller et al., 2011; Hegazi et al., 2005;
Lemke et al., 2005). Based on fluorescence properties of aromatic hydrocarbons, LIF is considered as a non-destruc- tive and fast detection tool of PAHs even at very low con- centrations. The advantages of using the LIF technology are simplicity, sensitivity and speediness, and it can preferen- tially act as a subsurface sensor probe for in situ monitor- ing of soil and groundwater quality.
LIF technology is developed for on-site real-time pollu- tion investigation, but it has not been widely applied in Tai- wan so far. Comparatively, membrane interface probe (MIP) system becomes an essential tool of site investigation and also possesses many successful application showcases in Taiwan recently. Detection target for MIP is mainly dis- solved-phase organic pollutants, and the drawback of MIP is less sensitive to semi-volatile organic compounds. Detec- tion target for LIF is free-phase petroleum pollutants that just can compensate for the drawback of MIP. Petroleum products always contain PAH compounds that possess fluo- rescence characteristics, and thus LIF spectroscopy seems to be favorably utilized as the detection tool. In this study, domestic common-use fuel products were examined their suitability of qualitative or quantitative analyses by LIF spectroscopy. An elemental objective of this study is to establish the databank of LIF fluorescence characteristic spectra, and to recognize LIF fluorescence characteristic spectra of each fuel species. Once fingerprints of contami- nants being built up, LIF can be developed as a more reli- able and powerful detection tool.
2. Materials and methods
2.1. Testing materials
In this study, 5 common domestic fuel products were selected as target pollutants for test, including unleaded gas- oline, aviation jet fuel JP-8 diesel, marine fuel and low sul- fur fuel. All testing fuels were obtained from Kaohsiung Refinery Plant of Chinese Petroleum Corporation, Taiwan.
Unleaded gasoline belonging to light-oil type contains C6 to C9 aliphatic, cyclic and minor aromatic hydrocarbons. Avi- ation jet fuel contains C12 to C16 distilled petrol, kerosene and some anti-freezing or anti-explosive additives. Diesel belonging to middle-oil type contains C9 to C18 n-alkanes, cycloalkanes and aromatic hydrocarbons. Marine fuel con- tains diesel and multicomponent distilling residuals. Low sulfur fuel belonging to heavy-oil type basically contains various distilling residuals, which has more multi-ring struc- ture molecules than other testing fuels.
2.2. Sample preparation
In this study, the samples of fuel mixtures were prepared by blending at a desired mixing volume ratio. Five com- mon domestic fuel products were used as base fuel for blending. Each two kinds of base fuels were blending at an equivalent ratio to prepare 10 samples of two-fuel mix- tures. Each three kinds of base fuels were blending at an equivalent ratio to prepare 10 samples of three-fuel mix- tures. Unleaded gasoline and diesel were blending at ratios of 5 : 1, 4 : 1, 3 : 1, 2 : 1, 1 : 2, 1 : 3, 1 : 4 and 1 : 5 for sim- ulating the pollution situation at a filling fuel station. Diesel and low sulfur fuel were blending at ratios of 5 : 1, 4 : 1, 3 : 1, 2 : 1, 1 : 2, 1 : 3, 1 : 4 and 1 : 5 for simulating the pol- lution situation at a manufacturing plant.
2.3. LIF spectroscopy
In this study, a Ultra-Violet Optical Screening Tool
(UVOST) system made by Dakota Technology Co. (U.S.)
was employed for LIF detection. This UVOST system con-
sists of a control computer, an oscilloscope, a laser device,
an emission/detection module, a LIF probe and fiber-opti-
cal accessory. LIF spectroscopy utilized Xenon Chloride to
emit 308 nm short wave pulse laser, excite the specimen for
releasing fluorescence, and identify its fluorescence charac-
teristic spectrum through waveform comparison at 350 nm,
400 nm, 450 nm and 500 nm. Fluorescence release is typi-
cally observed in molecules that have one or more aromatic
ring structures. Before LIF spectroscopy, the UVOST sys-
tem was always calibrated with the use of a NAPL stan-
dard (Dakota). The spectroscopy response might be varied
with laser energy changes, fiber optic cable length and
detector aging that was further normalized as % reference
(3)
emitter (%RE). The prepared fuel samples were filled into a crystal cell as the specimen, and LIF spectroscopy was con- ducted on each side of the crystal cell.
2.4. Statistical analysis
Results of LIF spectroscopy presented as waveforms of fluorescence characteristic spectra, which were quantified by the intensity of total reference emitter (%RE) and fluo- rescence response at 350 nm, 400 nm, 450 nm and 500 nm.
The difference between pure-phase fuels might be distin- guished by waveform comparison of fluorescence charac- teristic spectra. However, the differentiation of fuel mixtures through waveform comparison is unattainable. In this study, multivariate analytical techniques were utilized to aid data processing of LIF spectroscopy. Principal component anal- ysis (PCA) is known as a powerful technique for data reduction based upon eigen-analysis of the correlation or covariance matrix within large sets of data (Farnham et al., 2003). By utilizing PCA, the original p-dimensional stan- dardized data matrix is transformed into m-dimensional principal component (PC) matrix with less degree of free- dom. Considering the correlations present in the original data, PCs can reduce the overall complexity of the data and still reserve inherent inter-dependencies. In such a way of data reduction, data interpretation is based on rotated fac- tors, rotated loadings and rotated eigenvalues. Typically, the first few PCs account for the majority of the variance within the original dataset, then the first one explains the most variance and each subsequent PC explains progressively less. The factor loadings are responsible for the correlations between PCs and selected variables, and those with the greatest positive and negative loadings make the largest contribution. As a result, the loadings can offer more infor- mation to track the sources that are responsible for the sim- ilarities of collected samples in fluorescence characteristics.
3. Results and discussion
3.1. Fluorescence characteristics of pure-phase fuels LIF is considered as a non-destructive and fast quantifi- cation tool of PAHs based on their fluorescence properties.
Each PAH has a unique emission spectrum, which is chang- ing with ring structure and degree of substitution. The test-
ing fuels might contain various aromatic hydrocarbons or any fluorescence reactive components at different abun- dance levels. Table 1 illustrated fluorescence responses at 4 channels of LIF waveform for each pure-phase fuels. Each specimen was measured on 4 sides of a crystal cell, and each side was measured 10 times by LIF spectroscopy. Thus, the fluorescence responses at 4 channels of waveform in Table 1 are the average of 40 measurements as %RE.
Comparing with other pure-phase fuels, diesel along with marine fuel demonstrate their stronger fluorescence inten- sity, while jet fuel JP-8 presents the least fluorescence inten- sity on total %RE. This finding implied that the plenty of PAH components could be rich in diesel and marine fuel but less in jet fuel JP-8. For fluorescence characteristic spectrum, unleaded gasoline has a major response at 350 nm and moderate responses both at 400 nm and 450 nm on LIF spe- cific waveform. Fluorescence characteristics of Jet fuel JP-8 shows a principal fluorescence response at 350 nm only.
LIF specific waveform of diesel possesses a predominant fluorescence response at 350 nm along with other minor fluorescence responses at 400 nm, 450 nm and 500 nm. The key fluorescence responses of marine fuel are observed both at 400 nm and 450 nm on LIF specific waveform. LIF spe- cific waveform of low sulfur fuel is characterized its pre- dominant fluorescence responses at 450 nm and 500 nm. As shown in Table 1, each pure-phase fuel possesses its unique and specific fluorescence characteristic spectrum. In gen- eral, the larger PAH structure is liable to own the longer absorbance and emission wavelengths. The results of LIF spectroscopy also agreed that the wavelengths of key fluo- rescence responses are 350 nm for light-oil type fuels shift- ing to 400 nm or 450 nm for middle-oil type fuels and 450 nm or 500 nm for heavy-oil type fuels.
3.2. Fluorescence characteristics of various fuel mixtures
LIF specific waveforms of individual pure-phase fuels
might be considered as fingerprints for recognition of their
characteristic features. In practical situations, multi-sources
of fuel leakages usually occur depending on the work activ-
ities, and various types of fuel mixtures are likely to coexist
in surroundings at various concentration levels. For exam-
ple, unleaded gasoline and diesel are definitely the target
pollutants of site investigation at a filling fuel station. Die-
(4)
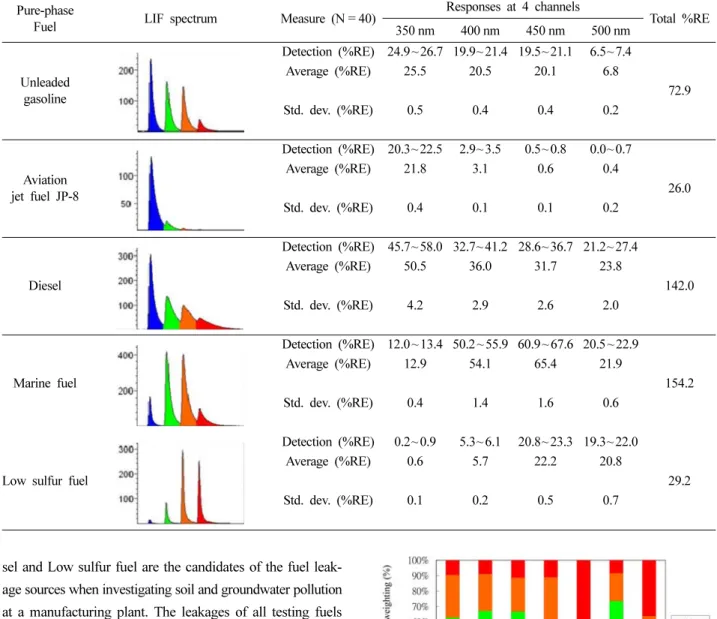
sel and Low sulfur fuel are the candidates of the fuel leak- age sources when investigating soil and groundwater pollution at a manufacturing plant. The leakages of all testing fuels could be concurrently found at a refinery plant or a fuel supply center. Thus, the occurrence of various fuel mix- tures is inevitable in the natural environment.
3.2.1. Unleaded gasoline fuel mixtures
In Fig. 1, unleaded gasoline was compared its 4 channel response weightings with 6 gasoline fuel mixtures. Fluores- cence response weighting of JP-8 blending (G+JP-8) or die- sel blending (G+D) gasoline mixture is similar to the original weighting of unleaded gasoline, and its slight enhancement of weighting at 350 nm is noticed due to inheriting the predominant fluorescence responses at this wavelength from JP-8 or diesel fuels. JP-8 and diesel blend- ing (G+JP-8+D) gasoline mixture has further magnified the
influential fluorescence response weighting at 350 nm. Fluo- rescence response weighting of marine fuel blending (G+M) gasoline mixture shows the significance at 400 nm and 450 nm, which is strongly affected by marine fuel instead of unleaded gasoline. Similarly, low sulfur fuel’s key fluores- Table 1. Waveform of fluorescence characteristic spectra for 5 testing pure-phase fuels
Fig. 1. Comparison of 4 channel response weighting with
gasoline fuel mixtures.
(5)
cence responses at 450 nm and 500 nm succeed their dom- inance to fluorescence response weighting of low sulfur fuel blending (G+LS) as well as marine fuel and low sulfur fuel blending (G+M+LS) gasoline mixtures.
3.2.2. Diesel fuel mixtures
Fig. 2 illustrated the comparisons of diesel’s 4 channel response weightings with 6 diesel fuel mixtures. Diesel has the most even fluorescence response weighting at 4 chan- nels among all testing fuels. Light-oil type fuel blending diesel mixtures showed an enlargement of their fluores- cence response weighting at 350 nm due to inheriting the predominant fluorescence responses at this wavelength from unleaded gasoline or JP-8 fuels. Resulting from JP-8 fuel’s leading impact on fluorescence response weighting, JP-8 blending (D+JP-8) as well as unleaded gasoline and JP-8 blending (D+G+JP-8) diesel mixtures possess the similar fluorescence response weighting at 4 channels. Marine fuel’s major fluorescence responses at 400 nm and 450 nm dominate their influence on fluorescence response weight- ing of marine fuel blending (D+M) diesel mixture. Heavy- oil type fuel blending diesel mixtures including D+LS and D+M+LS diesel mixtures are characterized by main fluores- cence response weightings at 450 nm and 500 nm, which is inherited from the characteristics of low sulfur fuel.
3.2.3. Low sulfur fuel mixtures
Low sulfur fuel’s fluorescence response weightings are negligible at 350 nm, inconsiderable at 400 nm and major both at 450 nm and 500 nm. Based on the comparison in Fig. 3, all low sulfur fuel mixtures presented the similar flu-
orescence response weightings at 4 channels. Low sulfur fuel mixtures inherit the characteristics of low sulfur fuel to demonstrate main fluorescence response weightings both at 450 nm and 500 nm. This finding elucidated that the evi- dence of any fuel leakage could be possibly covered by the release of low sulfur fuel at a fuel-contaminated site.
3.2.4. Various-ratio blending fuel mixtures
In Fig. 4, fuel mixtures of unleaded gasoline and diesel showed their fluorescence intensities increasing with the blending ratios of diesel. For fuel mixtures of gasoline and diesel, their 4 channel response weightings seem to accu- mulate original fluorescence responses of unleaded gaso- line and diesel based on their blending ratios. It means that fuel mixtures exhibit equal importance of inheriting origi- nal fluorescence characteristics from unleaded gasoline and diesel. However, fuel mixtures of diesel and low sulfur fuel Fig. 2. Comparison of 4 channel response weighting with diesel
fuel mixtures. Fig. 3. Comparison of 4 channel response weighting with low
sulfur fuel mixtures.
Fig. 4. Comparison of fluorescence intensities on LIF waveforms
with fuel mixtures of gasoline and diesel.
(6)
displayed their fluorescence intensities gradually decreas- ing with the growing blending ratios of low sulfur fuel in Fig. 5. As mentioned previously, low sulfur fuel mixtures inherit the characteristics of low sulfur fuel to demonstrate main fluorescence response weightings both at 450 nm and 500 nm. Even though fluorescence response intensity of low sulfur fuel is much weaker than diesel, fuel mixtures of diesel and low sulfur fuel only retain fluorescence charac- teristics of low sulfur fuel no matter what its blending ratios. Thus, LIF detection is very sensitive to heavy-oil type fuel such as low sulfur fuel, and the presence of low sulfur fuel mixtures can be easily recognized by their charac- teristic fluorescence response weightings both at 450 nm and 500 nm. Also, the weak fluorescence intensity of low sul- fur fuel makes their mixtures showing a decreasing trend of fluorescence intensity with an increasing mixing ratio of low sulfur fuel, as illustrated in Fig. 5.
3.3. Distinction of LIF spectra
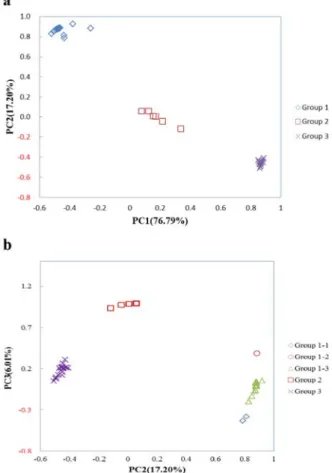
General speaking, fluorescence response of fuel mixtures on LIF specific waveforms basically result from the accu- mulation of fluorescence intensity of each blending fuel at 4 channels. Sometimes, fluorescence response of fuel mix- tures might cause a shift on LIF characteristic spectrum that will certainly increase the difficulty of species identifica- tion or make individual speciation impossible. Thus, princi- pal component analysis was employed to aid distinction of LIF characteristic spectra. The result of principal compo- nent analysis divided 45 testing samples into 3 principal
components according to their similarity of fluorescence responses at 4 channels. In Fig. 6a, 45 testing samples are gathering in 3 groups on the PC 1 vs. PC 2 plot. The test- ing samples in group 1 include gasoline, JP-8 fuel, diesel and their mixtures, which belong to light-oil type or middle- oil type fuels. Group 2 basically consists of 7 marine fuel mixtures, and group 3 contains 20 low sulfur fuel mixtures.
On the PC 2 vs. PC 3 plot, the cluster of each group was isolated well, and 18 testing samples in group 1 was further reorganized into 3 sub-groups. The first sub-group 1-1 is composed of Formosa-made gasoline and JP-8 jet fuel, and the second sub-group 1-2 comprises CPC-made gasoline. The first sub-group 1-1 and the second sub-group 1-2 belong to light-oil type fuels, and the third sub-group 1-3 containing 14 diesel fuel mixtures belongs to middle-oil type fuels.
With the aid of principal component analysis, light-oil type, middle-oil type and heavy-oil type fuels can be easily dis- tinguished from the databank based on their characteristic Fig. 5. Comparison of fluorescence intensities on LIF waveforms
with fuel mixtures of diesel and low sulfur fuel.
Fig. 6. Clustering of 45 testing samples of pure-phase fuels or fuel mixtures on (a) the PC 1 vs. PC 2 plot and (b) the PC 2 vs.
PC 3 plot.
(7)
fluorescence spectra. An exciting finding of differentiating CPC-made gasoline and Formosa-made gasoline through statistics-aid distinction of LIF spectra will expand LIF application as environmental forensic tool.
4. Conclusions
This study provided LIF fluorescence characteristic spec- tra of light-oil type, middle-oil type and heavy-oil type fuels. Based on LIF waveform characteristics, the strong fluorescence response at 350 nm is an indication of light-oil type fuel, such as unleaded gasoline and aviation jet fuel JP- 8. Diesel, middle-oil type fuel, has the most even weighting of fluorescence response at 4 channels on LIF waveform.
Marine fuel possesses the strongest fluorescence intensity especially at 400 nm and 450 nm on LIF waveform. Low sulfur fuel, heavy-oil type fuel, is characterized its weak flu- orescence response at 450 nm and 500 nm. For fuel mix- tures, individual LIF waveforms overlap each other to merge into the new one that might retain their original flu- orescence characteristics more or less. Heavy-oil type fuel mixtures might retain fluorescence characteristics of heavy- oil type fuel and overlay other fuel species on LIF wave- form, especially for low sulfur fuel. LIF characteristic fluo- rescence spectra were effectively utilized to recognize fuel species and their mixtures, and the feasible qualitative anal- ysis of fuel species through LIF spectroscopy was success- fully illustrated in this study. With the aid of statistical analysis, LIF characteristic fluorescence spectra were applied not only to identifying fuel species but also differ- entiating original fuel sources.
Acknowledgements
This work was financially supported by Soil and Ground- water Pollution Remediation Fund Management Board, Envi- ronmental Protection Administration, Taiwan, R.O.C. under the Grant entitled “Soil and Groundwater Pollution Research and Technology Improvement Project in 2011”. The authors would like to thank Mr. Chu-Chieh Chung and Mr. Yi-Shiun Lee for their support on analytical work and Guan Cheng Environ Tech Protection Co., Ltd, for the provision of the Ultra-Violet Optical Screening Tool (UVOST) system.
References
Amador-Hernández, J., Fernández-Romero, J.M. and Luque de Castro, M.D., 2001, Flow injection screening and semiquantita- tive determination of polycyclic aromatic hydrocarbons in water by laser induced spectrofluorimetry - chemometrics, Anal.
Chim. Acta, 448, 61-69.
Baumann, T., Haaszio, S., and Niessner, R., 2000, Applications of a laser-induced fluorescence spectroscopy sensor in aquatic systems, Wat. Res., 34, 1318-1326.
Farnham, I.M., Johannesson, K.H., Singh, A.K., Hodge, V.F., and Stetzenbach, K.J. (2003), Factor Analytical Approaches for Evaluating Groundwater Trace Element Chemistry Data, Ana- lytica Chimica Acta, 490, 123-138.
Hegazi, E., Hamdan, A., and Mastromarino, J., 2005, Remote fingerprinting of crude oil using time-resolved fluorescence spectra, Arab. J. Sci. Eng., 30, 3-12.
Lemke, M., Fernandez-Trujillo, R., and Lohmannsroben, H.G., 2005, In-situ LIF analysis of biological and petroleum-based hydraulic oils on soil, Sensors, 5, 61-69.
Martins, T., Saab, S.C., Milori, D.M.B.P., Brinatti, A.M., Rosa, J.A., Cassaro, F.A.M., and Pires, L.F., 2011, Soil organic matter humification under different tillage managements evaluated by laser induced fluorescence (LIF) and C/N ratio, Soil Tillage Res., 111, 231-235.
Matsumi, Y., Shigemori, H., and Takahashi, K., 2005, Laser- induced fluorescence instrument for measuring atmospheric SO
2
, Atmos. Environ., 39, 3177-3185.
Matsumoto, J., Imai, H., Kosugi, N., and Kajii, Y., 2005, In situ measurement of N
2
O
5
in the urban atmosphere by thermal decomposition/laser-induced fluorescence technique, Atmos.
Environ., 39, 6802-6811.
Miyazaki, K., Matsumoto, J., Kato, S., and Kajii, Y., 2008, Development of atmospheric NO analyzer by using a laser- induced fluorescence NO
2
detector, Atmos. Environ., 42, 7812- 7820.
Muller, M., Milori, D.M.B.P., Deleris, S., Steyer, J.P., and Dudal, Y., 2011, Solid-phase fluorescence spectroscopy to characterize organic wastes, Waste Manage., 31, 1916-1923.
Sirignano, M., Collina, A., Commodo, M., Minutolo, P., and
D’Anna, A., 2012, Detection of aromatic hydrocarbons and
incipient particles in an opposed-flow flame of ethylene by spec-
tral and time-resolved laser induced emission spectroscopy,
Combust. Flame, 159, 1663-1669.
(8)
Suzuki, H., Miyao, Y., Nakayama, T., Pearce, J.K., Matsumi, Y., Takahashi, K., Kita, K., and Tonokura, K., 2011, Comparison of laser-induced fluorescence and chemiluminescence measure- ments of NO
2
at an urban site, Atmos. Environ., 45, 6233-6240.
Taiwan EPA, 2006a, Reference Manual of Pollution Investiga- tion and Inspection for the Fuel Storage Tank System, Taiwan EPA, Taipei, Taiwan, ROC, p. 5-1.
Taiwan EPA, 2006b, Reference Handbook of Expedited Site Investigation and Assessment Technology for the Fuel Storage Tank System, Taiwan EPA, Taipei, Taiwan, ROC, p. 4-67.
Taiwan EPA, 2014, Soil and Groundwater Remediation Annual Report, Taiwan EPA, Taipei, Taiwan, ROC, p. 4-56.
Taketani, F., Kanaya, Y., Nakamura, T., Nakamura, T., Koi- zumi, K., Moteki, N., and Takegawa, N., 2013, Measurement of fluorescence spectra from atmospheric single submicron parti- cle using laser-induced fluorescence technique, J. Aerosol. Sci., 58, 1-8.
Uebel, U., Kubitz, J., and Anders, A., 1996, Laser induced flu-
orescence spectroscopy of phytoplankton and chemicals with
regard to an in situ detection in waters, J. Plant Physiol., 148,