Development of the Design Process for Laser Scanned Model
Chwail Kim † , Semyung Wang * , Euichul Kang ** and Kwanheng Lee ***
레이저 스캔 모델의 설계 프로세스 개발
김좌일
†
・왕세명*
・강의철**
・이관행***
Key Words : Reliability-based Topology Optimization(신뢰성기반위상최적설계), Laser Scan(레이저 스캔), Response Surface Method(반응표면법)
Abstract
Recent engineering process requires fast development and manufacturing of the products. This paper mainly discusses the process of rapid product development (RPD) from the reverse engineering to the optimal design. A laser scanning system scans a product and the efficient data processing method reduces the scanned point data. The reduced (scanned) points model is transformed to a finite element model without the construction of a CAD model. Since CAD modeling is a time-consuming work, skipping this step can save much time. This FE model is updated from the result based on the structural characteristics from modal test of the real model. For FE model updating, Response Surface Method is adopted. Finally, the updated FE model is optimized using the reliability-based topology optimization, which is developed recently. All these processes are applied to the design of an upper part model of a cellular phone.
1. Introduction
Recent engineering process requires fast development and manufacturing of the products, therefore, many researchers focus on the Rapid Product Development (RPD) technology. Reverse Engineering (RE) is one of the RPD technologies, and RE reconstructs CAD models from existing real models. RE consists of measuring process, data pre-processing, and CAD surface generation. However, the manual operation of measuring process and the absence of efficient data pre- processing methods cause bottlenecks of RE process.
In order to solve these problems, this research develops the efficient data processing method that is applied for reducing the unnecessary point data from the original scanned point data.
Conventionally, RE constructs CAD models from the scanned data and then constructs FE models using meshing algorithms. However, the generation of CAD models including many surfaces is a time-consuming work. Therefore, this research directly constructs a FE model from the reduced point data without CAD modeling process.
Any primitive FE model should be updated from the characteristics of the real model because the FE model is an approximated one. This research considers structural responses and natural frequencies of the FE model which is updated based on the results of modal test. Updating FE model is an optimization problem and this research adopts Response Surface Methodology (RSM) for the optimization. The authors researched more advanced RSM to increase the approximation accuracy and reduce the computation time
(1). The updated FE model replaces the real model and is used for analysis and optimization.
The classical optimization methodologies are based on the deterministic method, but probabilistic designs have been required and researched extensively. In probabilistic optimization, minimizing the cost and bringing the probabilistic constraints on target should be done simultaneously. Reliability-based Design Optimization (RBDO) has the probabilistic constraints
†
광주과학기술원, 기전공학과 박사과정 E-mail : [email protected]
TEL : (062)970-2429 FAX : (062)970-2384
*
광주과학기술원, 기전공학과 교수
**
광주과학기술원, 기전공학과 박사과정
*** 광주과학기술원, 기전공학과 교수
considering reliability index that represents the probability of the satisfaction of the constraint. This RBDO concept was applied to Topology Optimization and Reliability-based Topology Optimization (RBTO) has been developed recently
(2).
This paper applies the RBTO technology to the updated FE model for static problems. Young’s modulus, thickness, and loading are considered as uncertain variables.
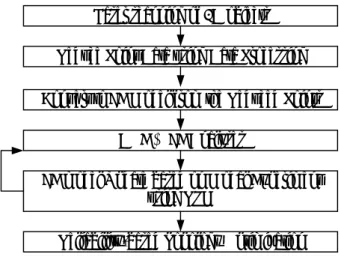
Fig.1 shows the whole design process.
Fig. 1 Flow Chart of the Design Process
2. Laser Scanning & Reduced Model
2.1 3D Laser Scanning
There are several measuring principles to capture the 3D shape of a part using vision sensors such as triangulation with laser, triangulation with pattern projection, photogrammetry and stereo vision, time of flight, and so on. Among these systems, a laser scanning system, which is the most popular scanning device in engineering field, is used for this research.
SENSOR 0
SENSOR 1
part Laser Probe
X Y Z
Laser Beam Laser Stripe
Fig.2 Laser Scanning Mechanism
As shown in Fig.2, in laser scanning system, the laser probe stripe type of laser beams to the part and the CCD cameras capture the 2D image of the projected beam.
Among the coordinates of 3D points, x- and y-values are obtained according to the position of the probe that is directly fed by the transport mechanism. The 3
rdcoordinate, z, is obtained by applying a triangulation method.
For a freeform shape part, it is hard to scan overall part shape with a single scanning orientation due to the lack of the probe’s degree of freedom. Therefore, multiple part setups with different orientation are used
(3).
2.2 A Mesh Model Generation with Data Reduction The point data obtained by laser scanning needs to be transformed to a mesh model for further analysis purposes. In this paper, authors aim at constructing a uniformly dense mesh model in a fast way without non- manifold meshes.
There are two essential stages for mesh generation:
data reduction and triangulation. Scanned data usually tends to be very difficult to handle due to its huge amount. Of many data reduction techniques such as space sampling, chordal deviation and feature based sampling methods; space sampling, which is used most commonly, is best in the sense of generating uniformly dense meshes for FEM.
In this research, an integrated method is developed by combining a space sampling and a region growing approach of triangulation based on a 3D grid structure.
The main procedures of the proposed method are shown below.
◦ 3D grid generation
◦ Data reduction
◦ Seed triangle generation
◦ Region growing
3D grid generation makes use of an octree subdivision technique in which a grid is split into 8 children grids.
The bounding box of point cloud is used as the root grid and subdivision process keeps subdividing until it meets the termination condition, a user defined level of detail
(4). After a refinement process removing unnecessary grids, all grids become the same in size and all the domain of the point cloud is covered with the grids. The data reduction is done with sampling a median point of local points in a grid.
The grid can be regarded to be a spatial divider since a grid has only one exclusive point and the grid connectivity is referred very well with indices [i,j,k].
There are three possible contacts between grids such as vertex, edge and face contact. This connectivity information is selectively used in region growing not to introduce non-manifold meshes.
The proposed method takes an approach that starts with a seed triangle generation by extracting 3 initial neighbor points. A seed point, p1, is extracted in the median grid and another point, p2, is the closest point to p1 to form a seed edge, E1. The other points, p3, is selected in the sense of Delaunay point of E1 which has Laser scanning of 3D objects
Reduce Point Data using Data Processing Convert to FE Model from the Reduced Points
DOE & FE Analyses
FE model Update based on Modal Experiment using RSM
Reliability-based Topology Optimization
smaller circum circle size than any other applicant points generating a seed triangle T [p1, p2, p3].
For region growing, a front which is a buffer that keeps all expandable edges is used. When a new Delaunay point of a front edge is found, a new triangle and basically two new front edges are generated. The growing procedure is done when there is no further expandable edge in the front.
The proposed mesh generation method can handle huge amount of point data and construct a mesh model for FEM simultaneously. Furthermore, it is easy to control the mesh size and number by controlling the sampling density.
3. FE model Construction & FE model Update using Response Surface Method
3.1 Construction of Finite Element Model
The reduced points model includes the node and mesh information. The reduced points model can be directly converted to a FE model since the point reduction algorithm in the previous step already considers the quality of mesh. In this research, the points model is converted to ANSYS format. The main advantage of this method is to save the CAD modeling time because the process does not create a CAD model. This process is summarized by the following figure.
Fig.3 FE Model Construction from the Scanned Data However, for accurate analysis, the FE model update should be performed.
3.2 Modal Test using Laser Vibrometer
System natural frequencies are obtained from the modal test, and the results of experiments are used to validate and update the FE model.
Fig.4 Modal Test using Laser Vibrometer
Since the example model is thin and light, impact hammer system is not good for the modal test.
Therefore, laser vibrometer system, a non-contacting equipment, is adopted and shown in Fig. 4.
3.3 Sensitivity-based Response Surface Method The response surface method (RSM) became one of the famous meta modeling techniques, however its approximation error is the major disadvantage.
Classical RSM uses the Least Squares Method (LSM) to find the best fitting approximation models from all the given data. In the previous research, the authors suggested how to construct RSM efficiently and accurately using the Moving Least Squares Method (MLSM) with sensitivity information.
MLSM can be explained as a weighted LSM that has various weights with respect to the position of approximation. Therefore, coefficients of a RS model are functions of the location and they should be calculated for each location. This procedure is interpreted as a local approximation, and Fig. 5 explains the main concept of LSM and MLSM.
x y
Input
Calculation Point Calculation Point ResponseMLSM
LSM
Fig.5 Concept of LSM and MLSM
If the sensitivity (gradient) of each sampling point can be calculated efficiently
(5), then the sensitivity and function (response) data can be used to construct RSM.
Since the sensitivities have higher order information than function values, accurate sensitivities can increase the accuracy of RSM effectively. The main idea of sensitivity-based RSM is to minimize the errors of function and sensitivity using MLSM and it is explained by the following equation.
( )
x (
g)
y( )x
g g( )x
new
sw L sw L
L Minimize
t s Function a
Find
+
−
= 1 .
. (1)
where
L
yis the sum of the squares error of function, L
gis the sum of the squares error of sensitivity, and x is the approximation position vector.
3.4 FE model Update using RSM
The original FE model from the reduced point data is primitive and should be updated. Natural frequencies from the modal experiments are assumed to be the correct values because these values represent the real model. The material of the applied cellular phone Point Data
Scan CAD FE model
model is plastic and the thickness of the shell is not uniform. The material properties of plastic are various and thickness has some variations. Therefore, elasticity of the material and thickness are set to the design variable for FE model update. The natural frequencies are approximated by RSM and the objective of model update is defined in the following equation.
( )
∑
= n−
i
Experiment i RSM
i
freq
freq Minimize
1
2
(2)
where
RSM
freq
iis i
thnatural frequency by RSM, and
Experiment
freq
iis i
thnatural frequency by experiment.
4. Reliability-based Topology Optimization (RBTO)
4.1 Concept of RBTO
The classical optimization methodologies are based on the deterministic method, but probabilistic designs have been required and researched extensively.
The goal of the probabilistic optimization is to consider uncertainties in variables. Uncertain variables have variances of distribution from the mean values. In deterministic optimization, these uncertainties are not considered. Thus, the deterministic optimal design cannot be reliable for the safety.
In probabilistic optimization, minimizing the cost and bringing the probabilistic constraints on target should be done simultaneously. Many researches on probabilistic optimization have been done to improve the quality of a product by minimizing the effects of variation. One of the probabilistic design methods is the Reliability-based Design Optimization (RBDO). RBDO has the same objective with the deterministic optimization, but it has probabilistic constraints considering the probability of the satisfaction of constraints. This RBDO concept was applied to Topology Optimization and Reliability-based Topology Optimization (RBTO) has been developed recently.
This paper applies the RBTO technology a static problem. Young’s modulus, thickness, and loading are considered as uncertain variables. The manufacturing environment affects Young’s modulus and thickness and the working condition of the system can affect loading.
RBTO can give satisfied solutions up to the requested reliability with respect to these uncertainties.
4.2 Formulations and Sensitivity Analysis
The general form of RBTO problem is described as the following equation.
Find the design variables
η1,
η2, L ,
ηndvsuch that
( ) [ ( ( ) ) ]
3 , 2 , 1 ,
, 1
1 0
0 ,
=
=
≤
≤
≥
≥
=
j and ndv i
P X
G P X P to Subject
V Volume Total
Minimize
i
t j
i s
i
L
ηη η
(3)
where X
jis the j
thuncertain variable, P
sis the system probability of the success, and P
tis the target probability of the success.
Performance Measure Approach (PMA) defines the RBTO problem like the following.
( ) ( )
3 , 2 , 1 ,
, 1
1 0
0
* ,
=
=
≤
≤
=
≥
j and ndv i
evaluation each
for when
X G to Subject
V Volume Total Minimize
i
t s j i
i
L
η
β β η
η
(4)
where
β
sis system reliability index for the success, and β
tis target reliability index for the success
In RBTO problem, the performance (or limit-state) function should be defined and each sensitivity analysis should be performed with respect to each uncertain variable.
For the static problem, the performance function is defined by
max ≥ 0 +
−
=
δ δG (5)
where δ is the displacement at a certain point.
The limit-state Eq. 5 means that if the displacement δ is larger than the limit value δ
max, the system fails.
And, sensitivities are given in the following
( )
( )
( )
δ λ
λ λ λ
λ
−
∂ =
− ∂
∂ =
= ∂
∂
∂
= Ω
=
−
−
∂ =
=∂
∂
∂
= Ω
=
Ω
∂
− ∂
−
∂ =
= ∂
∂
∂
Ω Ω Ω Ω Ω
Ω
∫
∫
∫
∫
force force
G X
G
t a t d
t dA G X
G
E a E d
E d E
G X
G
T T T
T
3 2
0 0
0 0
1
1 , 1
1 , 1
λ z Eε
ε Eε ε
λ z Eε
ε E ε ε
(6)
All the sensitivity equations are validated by Finite
Difference Method (FDM).
5. Numerical Example
5.1 System
An upper part of a cellular phone is an example.
This model is complex to model by the classical manual way because of the many holes and curvatures. The following figure shows the real model.
Fig.6 One Part of A Cellular Phone 5.2 3D Laser Scanning & Reduction of Points
Original scanned model has 826150 points and the developed algorithm reduced the original scanned points to 4258 points with 7903 triangular meshes.
(a) Original Scanned Points (b) Reduced Points Fig.7 Scanned Point Model
5.3 Generation of FE model
In this research, a FE model is constructed directly and automatically from the scanned data without making a CAD model. The reduced point model is transformed to ANSYS model and it is shown in the following figure.
FE model by the introduced method is not quite different from the conventional method. However, the introduced method can save much time.
Fig.8 FE (ANSYS) models from the Scanned Data Without CAD modeling
Table 1. Modal Analysis Results FEM Directly from the points 1
stN. Freq.(Hz) 103.10
2
ndN. Freq.(Hz) 153.12
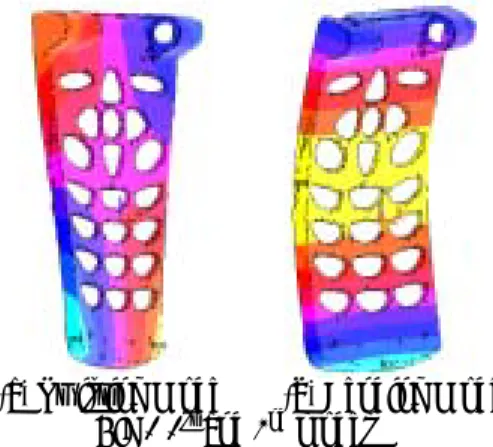
Modal analysis gave the mode shapes and the first two modes are given in the following.
(a) Twisting Mode (b) Bending Mode Fig.9 1
stand 2
ndmodes
5.4 Modal Test (Experiment) and FE model Update The modal test in Fig.4 found the natural frequencies of the real cellular phone model. Mode shapes are the same as FEM results, and the experimental natural frequencies are 107 and 144 Hz.
Based on the modal test results, the FE model is updated using the introduced RSM. Young’s modulus and thickness of the shell are the variables and 8 numerical sampling sets are determined by Latin- Hypercube DOE.
As the Table 2 shows, the updated FEM replaces the real model accurately.
Table 2. Result of FE Model Update
Experiment FEM Error
(%) 1
stN. Freq.(Hz) 107 108.161 1.09 2
ndN. Freq.(Hz) 144 146.255 1.57
5.5 RBTO
In this research, all uncertain variables have the normal distribution with 5% standard deviation and PMA is adopted for RBTO.
The static problem using PMA is defined by
( )
0 . 3 0 0 . 29
=
≥ +
−
t
i