7
<원례보저
>
Quantification and genotyping of PCV2 DNA in the tissues of PCV2-infected conventional pigs with different clinical signs Hye Kwon Kim1,†, Yuzi Luo
1,†, Hyoung Joon Moon
2, Seong Jun Park
1, Se Mi Rho
1, Jae Yeon Han
1,
Van Giap Nguyen
1, Bong Kyun Park
1,*
1
College of Veterinary Medicine and BK21 Program for Veterinary Science, Seoul National University, Seoul 151-742, Korea
2
Research Unit, Green Cross Veterinary Products, Yongin 449-903, Korea (Accepted: December 24, 2010)
Abstract : This study was focused on the genotyping and quantification of Porcine circovirus type 2 (PCV2) in thirty PCV2-positive pigs with different clinical symptoms (PCV2-infected without wasting, PCV2-infected with wasting, PCV2-infected with wasting and lymphoid depletion). The quantity of PCV2 DNA in diverse tissues was significantly differed among these groups. (One-way ANOVA test,
p< 0.001) Interestingly, PCV2-DNA load in tissues of PCV2-infected pigs without wasting and PCV2-infected pigs with wasting and lymphoid depletion were not significantly differed (
p= 0.38), while they were all significantly higher when compared with PCV2-infected pigs with wasting-only. PCV2 DNA quantity in tissues was significantly higher in PCV2a and 2b co-infected pigs compared to the PCV2b only-infected pigs (Wilcoxon test,
p= 0.039). The PCV2a and 2b co-infected pigs had increased wasting and lymphoid depletion rate but it was not statistically significant. Therefore, this cross-sectional study suggested that PCV2 DNA load in tissues was diverse by clinical and histological findings. Furthermore, co-infection of PCV2a and 2b affected to the PCV2 DNA load in tissues with increased rate of wasting and lymphoid depletion.
Keywords : clinical sign, genotype, PCV2a, PCV2b, quantification
Introduction
Porcine circovirus type 2 (PCV2) is a member of the circoviridae family, circovirus genus, a recently established virus family composed of small, non-enveloped viruses, with a circular, single-stranded DNA genome, which is now recognized as the essential infectious agent for the occurrence of postweaning multisystemic wasting syndrome (PMWS) in pigs [1, 3, 10]. PMWS was first identified in western Canada in 1996 [13], which causes significant economic losses to global pig industry and now it is seen as the major clinical manifestation of a range of porcine circovirus associated diseases (PCVADs).
Porcine reproductive and respiratory syndrome virus is also known for a co-factor for PMWS with PCV2 [2, 16, 26]. PCVADs are becoming a major problem of the swine industry worldwide, so it’s very important to diagnose and control PMWS and further control PCVADs
in swine industry.
To diagnosis the PCVAD, clinical sign, histopatho- logical study and PCV2 detection should be considered simultaneously. Since a study has shown that PCV2 burden in tissues is associated with clinical severity of PCVAD [14, 20], real-time polymerase chain reaction (PCR) as a rapid technique with high sensitivity and specificity has been studied for diagnosis of PCVAD, especially PMWS. Several previous real-time PCR for PCV2 quantification using a probe-based [7, 24, 27] or a SyBr green-based method [22] were established and used to investigate the relationship between PCV2 DNA load and the severity of PMWS. However, the diverse PCV2 DNA load in tissues even in the pigs with similar severity has made it hard to confirm the real-time PCR as a diagnostic tool for PMWS.
Recently the PCV2 was known to have two genotypes [8, 11, 23]. Since diverse terms were used to describe
*Corresponding author
Tel: +82-2-880-1255, Fax: +82-2-885-0263 E-mail: [email protected]
†
The first two authors equally contributed to this study.
these genotypes, Grau-Roma and others proposed to define the term used for PCV2 genotype, Genogroup 1 and 2 which corresponded to PCV 2b and 2a, the terms used in this study [11, 12]. Although a retrospective study showed that the PCV2b (PCV2 Genogroup 1) was more correlated with the PMWS than the PCV2a (PCV2 Genogroup 2), an animal experiment revealed that there were no type specific differences in virulence and each type shared cross-protection [25]. Therefore, additional information should follow the previous reports to understand these deputing results.
It was reported that the two genotypes of PCV2 were also circulating in Korea and they were both found in healthy, porcine dermatitis nephropathy syndrome and PMWS-affected pigs [4]. Along with this data, this study was focused on the genotyping and quantification of PCV2 in PCV2-positive pigs with different clinical symptoms from diverse regions of Korea to observe the correlation of clinical symptoms with quantity and genotypes of PCV2.
Materials and Methods
Pigs and sample preparation
Total thirty pigs from 28 to 100 days of age were included for the study. They were all conventional pigs (crossbreeding) from 2005 to 2006 submitted to the laboratory for the diagnosis. The information of the pigs was presented in Table 1. They were all PCV2-positive with a PCR [28]. The histopathology of superficial inguinal lymph nodes was performed to find lymphoid depletion, basophilic inclusion bodies and granulomatous inflammation. The PCV2-infected wasting pigs without lymphoid depletion were also selected for the study. To select the wasting pigs, all pigs were weighed before autopsy and compared with the average weight of the normal pigs at the same age. The reference data about normal weight per age were derived from ‘Disease of swine’ [9]. To avoid the inter-farm differences of growth rate, the normal weights of pigs in slow growth rate were chosen for the comparison. The regression curve was drawn to obtain standard formula of average weight per age. (Average weight = 0.0035 × age
2+ 0.0326 × age + 2.08, R
2= 0.9999) This formula was used to obtain the minimal normal weight in specific age to decide whether the pigs were wasting or not.
When the pigs were in autopsy, lung, heart, liver, spleen, kidney, tonsil, submaxillary lymph node, bronchial
lymph node, mesenteric lymph node, inguinal lymph node and large intestine were collected in separate tube.
Then, DNA were extracted from each organ using a commercial DNA extraction kit (QIAGEN, USA) and quantified by measuring at 260 of absorbance value, using spectrophotometer (Eppendorf, Germany).
Preparation of standard plasmid DNA
A 727 bp DNA fragment from ORF2 region (Forward primer: 5´-TTC GAA TTC AGC TAT GAC GTA TCC- 3´, Reverse primer: 5´-TTT CTC GAG CAT TTA GGG TTT AAG-3´) of the PCV2 genome was amplified and cloned into pMD18-T Vector (Takara, Japan) and transformed in
Escherichia coliJM109 competent cells, creating a recombinant plasmid designated as pT-PCV2- ORF2. The plasmid was purified and quantified to be used as standard for PCV2 DNA quantification.
Real time PCR
Briefly, PCV2-specific forward primer (5´-CCAGGA GGGCGTTGTGACT-3´), PCV2-speicif reverse primer (5´-CGCTACCGTTGGAGAAGGAA-3´) and probe (5´- AATGGCATCTTCAACACCCGCCTCT-3´, labeled at 5´
with FAM and at 3´ with TAMRA) were used for the real-time PCR, following previous paper [24].
The reaction contained 500 nM of each primer, 150 nM of probe, 12.5
µL of TaqMan universal master mix (which includes amplitaq gold DNA polymerase, dNTP’s with UTP, MgCl2, ROX, amperase UNG and buffers) and 200 ng of template. Reactions include organ samples and standard DNA (from 10
9to 10
4PCV2 plasmid copies/
µ
L) and negative control (using autoclaved nanopure water as template), both by triplicates, and performed in ABI PRISM 7000 sequence detection system (Applied Biosystems, USA) under 10 min at 95
oC, 2 min at 50
oC and 40 cycles of 15 sec at 95
oC, 1 min at 60
oC.
Genotyping of PCV2
A previously reported nested PCR for genotyping of
PCV2a and 2b was used in this study [21]. The DNA
of lungs of each pig were used as templates for the
nested PCR. VF-2 (5´-GAA GAA TGG AAG AAG
CGG-3´) and nested-R (5´-ACA GTC AGA ACG CCC
TCC T-3´) primers were for the first round PCR to
differentiate the PCV1 and PCV2. After the first PCR
reaction, the second PCR was performed to differentiate
the PCV2a and PCV2b. The primer sequences for
PCV2a were 2a-F (5´-AAC AAT CCA CGG AGG
AAG G-3´) and 2a-R (5´-GGG ACC AAC AAA ATC TCY-3´), and for PCV2b were 2b-F (5´-CTG TTT TCG AAC GCA GTG-3´) and 2b-R (5´-CTC AAA CCC CCG CTC TG-3´). The entire condition for the nested PCR was the same with the method of Lyoo
et al.[21].
Statistical analysis
All data was sorted in Excel program (Microsoft, USA). To analyze the correlation between proportion of wasting and wasting + lymphoid depletion pigs in PCV2a
and 2b co-infected pigs (6 pigs) and PCV2b only-infected pigs (20 pigs), the Fisher’s exact test was used. The ANOVA test was performed to evaluate the significant differences of the tissue distribution of PCV2 DNA in the pigs of PCV2-infected without wasting, PCV2-infected with wasting, PCV2-infected with wasting and lymphoid depletion. The Wilcoxon test was also used to compare PCV2 DNA load in PCV2a and 2b co-infected pigs and PCV2b-only infected pigs. All statistical analyses were performed using SPSS 12.0 program (USA).
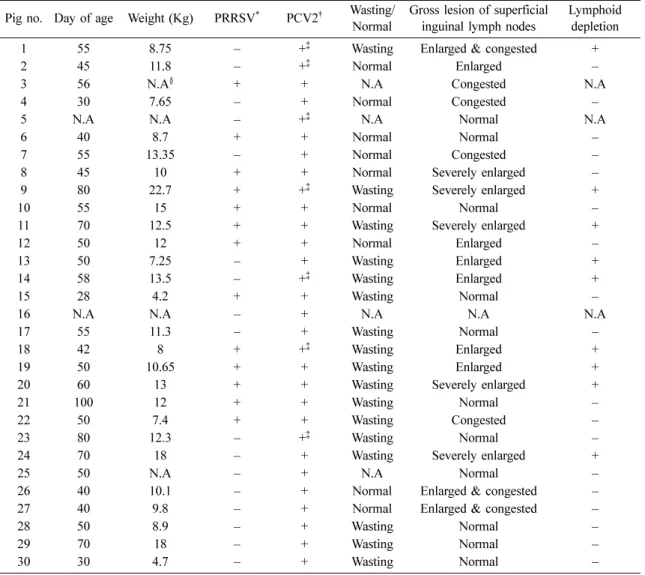
Table 1. The information of pigs used in this study
Pig no. Day of age Weight (Kg) PRRSV
*PCV2
†Wasting/
Normal Gross lesion of superficial
inguinal lymph nodes Lymphoid depletion
1 55 8.75 – +
‡Wasting Enlarged & congested +
2 45 11.8 – +
‡Normal Enlarged –
3 56 N.A
§+ + N.A Congested N.A
4 30 7.65 – + Normal Congested –
5 N.A N.A – +
‡N.A Normal N.A
6 40 8.7 + + Normal Normal –
7 55 13.35 – + Normal Congested –
8 45 10 + + Normal Severely enlarged –
9 80 22.7 + +
‡Wasting Severely enlarged +
10 55 15 + + Normal Normal –
11 70 12.5 + + Wasting Severely enlarged +
12 50 12 + + Normal Enlarged –
13 50 7.25 – + Wasting Enlarged +
14 58 13.5 – +
‡Wasting Enlarged +
15 28 4.2 + + Wasting Normal –
16 N.A N.A – + N.A N.A N.A
17 55 11.3 – + Wasting Normal –
18 42 8 + +
‡Wasting Enlarged +
19 50 10.65 + + Wasting Enlarged +
20 60 13 + + Wasting Severely enlarged +
21 100 12 + + Wasting Normal –
22 50 7.4 + + Wasting Congested –
23 80 12.3 – +
‡Wasting Normal –
24 70 18 – + Wasting Severely enlarged +
25 50 N.A – + N.A Normal –
26 40 10.1 – + Normal Enlarged & congested –
27 40 9.8 – + Normal Enlarged & congested –
28 50 8.9 – + Wasting Normal –
29 70 18 – + Wasting Normal –
30 30 4.7 – + Wasting Normal –
*
Porcine reproductive and respiratory syndrome virus (PRRSV), Detecting by Reverse transcriptase-nested polymerase chain reaction (PCR) [17].
†
Detecting by PCR [28].
‡
Both positive to the porcine circovirus type 2 (PCV2)a and 2b.
§
No data available.
Results
Clinical symptoms and quantity of PCV2 DNA This result was obtained from available pigs which had information about wasting and lymphoid depletion.
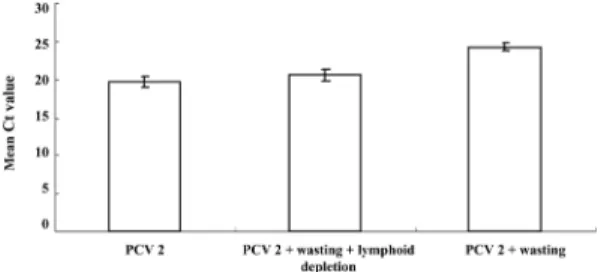
The mean cycle threshold (Ct) values of total organs in non-wasting PCV2-infected pigs (9 pigs) and PCV2- infected pigs with wasting and lymphoid depletion (9 pigs) were significantly lower than PCV2-infected pigs
with wasting-only (8 pigs), (Fig. 1,
p< 0.001). These results were corresponded to 8.2, 7.9 and 6.9 log PCV2 DNA copies/mL in non-wasting PCV2-infected pigs, PCV2-infected pigs with wasting and lymphoid depletion and PCV2-infected pigs with wasting-only, respectively.
The Mean Ct values of PCV2-infected pigs with wasting and lymphoid depletion and non-wasting PCV2-infected pigs were similar and not significantly different. (
p= 0.38)
Tissue distribution of PCV2 DNA in the pigs of PCV2-infected without wasting, PCV2-infected with wasting, PCV2-infected with wasting and lymphoid depletion
The PCV2 DNA was evenly distributed in the lung, heart, liver, spleen, kidney, tonsil, submaxillary lymph node, bronchial lymph node, mesenteric lymph node, inguinal lymph node and large intestine (Fig. 2). The quantity of PCV2 DNA in different tissues was significantly lower in PCV2-infected pigs with wasting only.
Genotypes and quantity of PCV2 DNA
All pigs were shown to be positive to PCV2b in the genotype-specific nested PCR. Only 7 of 30 pigs were positive to PCV2a. To observe if there were any genotype-specific differences in the quantity of PCV2 Fig. 1. PCV2-specific mean cycle threshold (Ct) values of
total organs in non-wasting porcine circovirus type 2 (PCV2)-infected, PCV2 + wasting and PCV2 + wasting + lymphoid depletion pigs. Significant differences of average Ct values among three groups were found by One-way ANOVA test (
p< 0.001). The mean Ct values of non- wasting PCV2-infected and PCV2 + wasting + lymphoid depletion pigs were significantly lower than PCV2 + wasting pigs by student
t-test (
p< 0.001). No differences were found between non-wasting PCV2-infected and PCV2 + wasting + lymphoid depletion pigs (
p= 0.38).
Fig. 2. The quantity of PCV2 DNA in different organs of PCV2 infected pigs with different clinical symptoms. Error
bars indicate the standard error.
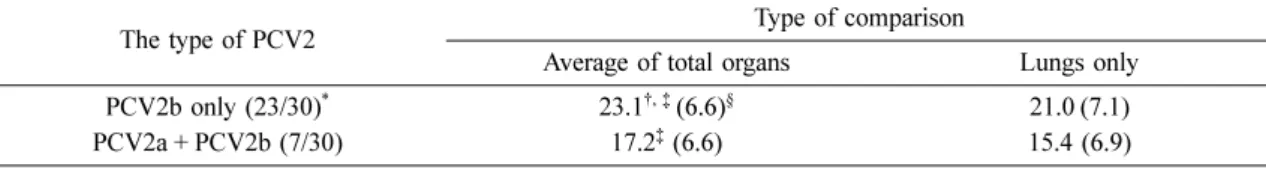
DNA in tissues, average Ct values of total organs in PCV2a and 2b co-infected pigs were compared with those of PCV2b only infected pigs. (Table 2) The average Ct value of PCV2a and 2b co-infected pigs was lower than that of PCV2b-only infected pigs significantly.
(Wilcoxon test,
p= 0.039) This meant that the PCV2 DNA load in the tissues was higher in PCV2a and 2b co-infected pigs (8.9 log PCV2 DNA copies/mL) than PCV2b-only infected pigs (7.2 log PCV2 DNA copies/
mL). The PCV2 DNA load of lungs were also higher in the co-infected pigs (9.4 log PCV2 DNA copies/mL) than PCV2-only infected pigs (7.8 log PCV2 DNA copies/mL) but that’s not significant (
p= 0.09).
Genotypes of PCV2 and clinical symptoms To know whether genotype-specific differences could influence to the clinical symptoms, the proportion of pigs with wasting only or wasting/lymphoid depletion were compared in PCV2a and 2b co-infected pigs (6 pigs) and PCV2b only-infected pigs (20 pigs) (Fig. 3).
The rates of wasting or wasting/lymphoid depletion were relatively higher in the co-infected pigs than PCV2b
only-infected pigs. However, this result was not significant in Fisher’s exact test (
p= 0.38,
p= 0.14, respectively).
Discussion
In this study, we could find significantly high quantity of PCV2 DNA in tissues from PCV2-infected pigs with wasting and lymphoid depletion compared to PCV2- infected pigs with wasting-only. However, even normal pigs infected with PCV2 showed high quantity of PCV2 DNA which was similar to PCV2-infected pigs with wasting and lymphoid depletion. This might be due to the subclinical period between virus replication and clinical manifestation. In addition, the low PCV2 DNA load in PCV2-infected pigs with wasting-only might be recovering pigs which had had PMWS-associated lesions but were in the stage of virus elimination and recovering as mentioned by previous study [24].
Many studies had been performed to figure out the correlation between PCV2 DNA load and the severity of diseases, especially the PMWS. The previous studies suggested that the 10
7PCV2 DNA copies per mL of the sera was the threshold of PMWS diagnosis [5, 24, 27]. However, there was the high variability of PCV2 DNA load in the pigs of same clinical level of PMWS.
Furthermore, recently published data indicated that the inter-laboratory results of quantitative real time PCR were not fully in agreement [17] and the authors proposed the standardization of laboratory threshold for the PMWS diagnosis. These factors had been a main problem in the PMWS diagnosis using real time PCR methods. Therefore, careful approach should be done to evaluate PCV2-associated diseases using real-time PCR method.
In this study, some pigs were also infected by PRRSV.
Since PRRSV is also known for a co-factor for PMWS Table 2. Comparison of average cycle threshold (Ct) values between samples infected with PCV2b only or PCV2a +
PCV2b
The type of PCV2 Type of comparison
Average of total organs Lungs only
PCV2b only (23/30)
*23.1
†, ‡(6.6)
§21.0 (7.1)
PCV2a + PCV2b (7/30) 17.2
‡(6.6) 15.4 (6.9)
*
no. of PCV2b only or PCV2a and 2b co-infected pigs / Total pigs.
†
mean Ct value.
‡
Significantly different with the Wilcoxon two sample test (
p= 0.039).
§