© 2019 The Korean Ophthalmological Society
This is an Open Access article distributed under the terms of the Creative Commons Attribution Non-Commercial License (http://creativecommons.org/licenses /by-nc/3.0/) which permits unrestricted non-commercial use, distribution, and reproduction in any medium, provided the original work is properly cited.
Original Article
Glaucoma is an optic neuropathy characterized by visual field loss and optic nerve damage resulting from retinal ganglion cell death. Because visual field loss and optic nerve damage is often asymptomatic in the early stages of glauco- ma, detecting the damage as early as possible is important to prevent the progression of the disease. For this reason, numerous functional and structural tests have been used to
detect glaucoma.
One of the most sensitive parameters in detecting glauco- matous optic neuropathy is the observation of a defect in the retinal nerve fiber layer (RNFL), which is largely composed of axonal fibers of the retinal ganglion cells [1-5]. In early stage glaucoma, structural changes in the RNFL often pre- cede visual field loss when measured with standard achro- matic perimetry [6,7], and serial RNFL examinations are known to be more sensitive than a visual field test in detect- ing progression of glaucomatous optic neuropathy. Recently, RNFL imaging techniques such as scanning laser polarime- try, confocal scanning laser ophthalmoscopy (CSLO), and optical coherence tomography (OCT) have been increasingly
Received: January 25, 2018 Accepted: December 11, 2018
Corresponding Author: Byung Ro Lee, MD, PhD. Department of Ophthal- mology, Hanyang University Hospital, Hanyang University College of Medicine, 222-1 Wangsimni-ro, Seongdong-gu, Seoul 04763, Korea. Tel:
82-2-2290-8572, Fax: 82-2-2291-8517, E-mail: [email protected]
Comparison of Blue and Green Confocal Scanning Laser
Ophthalmoscope Imaging to Detect Retinal Nerve Fiber Layer Defects
Joo Young Joung, Won June Lee, Byung Ro Lee
Department of Ophthalmology, Hanyang University College of Medicine, Seoul, Korea
Purpose: We detected retinal nerve fiber layer (RNFL) defects using a confocal scanning laser ophthalmoscopy (CSLO) with both blue and green laser sources and evaluated image quality based on laser wavelength.
Methods: This was a retrospective observational case study. Blue and green CSLO images of 181 eyes with suspected glaucoma were evaluated and compared. Three independent observers identified the presence of RNFL defects and determined which CSLO imaging source provided superior visibility of the defect. After assessing the defect imaging by laser source, demographics and image quality indices of optical coherence tomography between blue better and green better groups were analyzed.
Results: Both blue and green CSLO showed high discriminating ability for RNFL defects. The discriminating ability of blue CSLO was significantly greater than that of green CSLO (p = 0.004). Among eyes with a detect- able RNFL defect, 61.8% were better visualized with the blue laser compared to the green laser. Compared with the blue better group, the green better group was significantly older (p = 0.009), had a greater proportion of females (p = 0.005), had poorer best-corrected visual acuity (p = 0.001), more severe cataracts (p = 0.001), lower signal strength (p = 0.003), and poor image quality indices (p = 0.001).
Conclusions: Both blue and green CSLO imaging was useful for detecting RNFL defects, but blue CSLO was superior to green CSLO in quality of RNFL defect imaging in most patients with clear media.
Key Words: Confocal scanning laser ophthalmoscope, Red-free imaging, Retinal nerve fiber layer defect
used in clinical practice and are rapidly evolving [8]; howev- er, red-free photographs using flash fundus cameras with green filters remain a useful tool for detecting glaucoma.
In this study, we obtained high-quality imaging using an F-10 CSLO machine (Nidek, Gamagori, Japan). The F-10 is commercially available and can produce digital, high-reso- lution fundus reflectance images. Because this machine is equipped with four different laser sources, including blue (490 nm) and green (532 nm) lasers, we could perform both blue and green CSLO imaging. The purpose of this study was to detect RNFL defects with CSLO imaging using both blue and green laser sources and to compare the im- age qualities between laser wavelengths.
Materials and Methods
Study design and participants
We retrospectively reviewed 181 eyes of 91 patients re- ferred to Hanyang University Hospital with suspected glau- coma from August 2009 through September 2011 (one eye could not be examined due to severe trauma-induced corne- al opacity). On their first visit, each patient underwent a complete ophthalmic examination for the presence of glau- coma. The exam included obtaining a stereoscopic optic disc photograph, CSLO imaging using both blue and green laser sources, time-domain OCT (TD-OCT), spectral-do- main OCT (SD-OCT), and a Humphrey Visual Field (Carl Zeiss Meditec, Dublin, CA, USA) examination with the Swedish Interactive Threshold Algorithm 30-2 protocol.
TD-OCT was performed using a Stratus OCT (Carl Zeiss Meditec, Dublin, CA, USA), and SD-OCT was performed using a 3D OCT-2000 (Topcon, Tokyo, Japan). During the Stratus OCT image acquisition process, the Fast RNFL thickness acquisition protocol (three consecutive circum- ferential scans with a diameter of 3.4 mm centered on the optic disc) was used. During the 3D OCT-2000 image ac- quisition process, the 3D disc scan protocol was used (6.0 × 6.0 mm scan centered on the optic disc, circumpapillary RNFL thickness measured on a 3.4-mm diameter circle, and averages computed for 4, 12, and 36 sectors).
The diagnosis of glaucoma was based on the presence of glaucomatous visual field loss as measured by the Hum- phrey Visual Field examination and the presence of typical glaucomatous optic disc damage or RNFL defects as judged
by stereoscopic optic disc photographs (i.e., localized or dif- fuse neuroretinal rim thinning, increased cupping or a cup- to-disc ratio difference >0.2 between the eyes) and red-free fundus imaging examined by a glaucoma specialist. The glaucoma specialist also used RNFL thickness maps from TD-OCT and SD-OCT as supportive tools to aid in glauco- ma diagnoses. The RNFL defects on SD-OCT images were defined as ≤1 sector at <5% of the normal circumpapillary RNFL thickness.
A normal visual field was defined as having a mean devia- tion and pattern standard deviation within 95% confidence limits and a glaucoma hemifield test result within normal limits. Glaucomatous visual field defects were defined as those with a cluster of three points with probabilities of <5%
on the pattern deviation map in at least one hemifield, includ- ing at least one point with a probability of <1%; or a cluster of two points with a probability of <1%, and a glaucoma hemi- field test result outside 99% of age-specific normal limits or a pattern standard deviation outside 95% of normal limits.
This study was approved by the institutional review board of Hanyang University Medical Center (2019-03-020). and fol- lowed the tenets of the Declaration of Helsinki. Informed con- sent was waived due to the retrospective nature of the study.
Interpretation of CSLO imaging
CSLO imaging was taken with a commercially available CSLO, the F-10. We used blue (490 nm) and green (532 nm) laser sources to obtain two consecutive CSLO images. The size of the scanning field was wide-angle 60 degrees.
All three authors interpreted the CSLO images and de- cided whether the RNFL defect was better detected with the blue images or green images. Because we focused on image quality, the quantitative features of the RNFL defect were ignored and only the presence or absence of a defect was evaluated. If an RNFL defect was suspected on an im- age but was unclear, it was classified as being present. Af- ter defects were identified, observers decided which imag- ing source provided better visibility of the RNFL defect or if there was no difference in image quality. If the authors’
results differed, the majority of authors’ results were ap- plied. The examiners were masked to the type of laser and to the results of other examiners. We performed image ex- aminations in a fully masked fashion.
After the images were interpreted, we compared patient characteristics between the blue better (B-better) and green
better (G-better) groups. Best-corrected visual acuities were obtained using the Snellen eye chart and then converted to the logarithm of the minimum angle of resolution scale. To determine cataract severity, we classified lens status into four groups based on the Lens Opacity Classification Sys- tem, version III (LOCS III). Cataracts were classified as fol- lows: pseudophakic or clear lens, mild, moderate, and se- vere. All ophthalmic examinations including LOCS III cataract classification were performed during the initial vis- it. The signal strength of the Stratus OCT and the image quality factor of the 3D OCT-2000, which represent image qualities, were compared between the two groups.
Statistical methods
To determine the discrimination power of blue and green CSLO imaging for detecting RNFL defects, areas under the receiver operating characteristic curve (AUCs) were calculated. Significant differences between AUCs were as- sessed using the method described by DeLong et al. [9].
Reproducibility of CSLO imaging interpretation was as- sessed by calculating the kappa value. Kappa values were calculated between each of two graders. Statistical signifi- cance between groups was tested using the Kruskal-Wallis test for continuous variables and chi-square test for cate- gorical variables. Post-hoc analysis was performed using a Mann-Whitney U-test for continuous variables and chi- square test for categorical variables. A p-value of <0.05 was considered statistically significant in all analyses. We used PASW Statistics ver. 18.0 (SPSS Inc., Chicago, IL, USA) and Medcalc ver. 14.8.1 (Medcalc, Mariakerke, Bel- gium) to perform statistical analyses.
Results
Of the 181 eyes that were analyzed, 73 were diagnosed with glaucoma (either primary open angle glaucoma or nor-
mal tension glaucoma), and had RNFL defects that were confirmed with SD-OCT. Of those 73 eyes, RNFL defects were detected in 55 using blue or green CSLO imaging. Pa- tients with unclear RNFL defects were excluded. Definite localized RNFL defects were detected in 55 eyes (75.3%) with blue CSLO imaging and 53 eyes (69.9%) with green CSLO imaging. Between-grader agreement is presented in the Supplemental Table 1 as kappa values.
Values for AUC, sensitivity, and specificity for discrimi- nating between non-glaucoma controls and eyes with RNFL defects using blue or green CSLO imaging are documented in Table 1. Both blue and green CSLO imaging showed high discriminating ability for RNFL defects (blue CSLO: AUC 0.877, sensitivity 75.3%, specificity 100.0%; green CSLO:
AUC 0.849, sensitivity 69.9%, specificity 100.0%). The abili- ty of blue CSLO to discriminate RNFL defects was signifi- cantly superior than that of green CSLO (p = 0.004) (Fig. 1).
Among the 55 eyes with definite localized RNFL defects, Table 1. Comparison between the AUCs and sensitivities and specificities for discriminating between non-glaucoma controls and eyes with retinal nerve fiber layer defects
AUC Lower bound Upper bound p-value Sensitivity Specificity
Blue CSLO 0.877 0.820 0.921 <0.001 75.3 100.0
Green CSLO 0.849 0.789 0.898 <0.001 69.9 100.0
AUC = areas under the receiver operating characteristic curve; CSLO = confocal scanning laser ophthalmoscopy.
Sensitivity
100-Specificity 100
80
60
40
20
0
0 20 40 60 80 100
Blue CSLO Green CSLO
Fig. 1. Comparison of receiver operating characteristic curves created using blue confocal scanning laser ophthalmoscope (CSLO) imaging and green CSLO imaging.
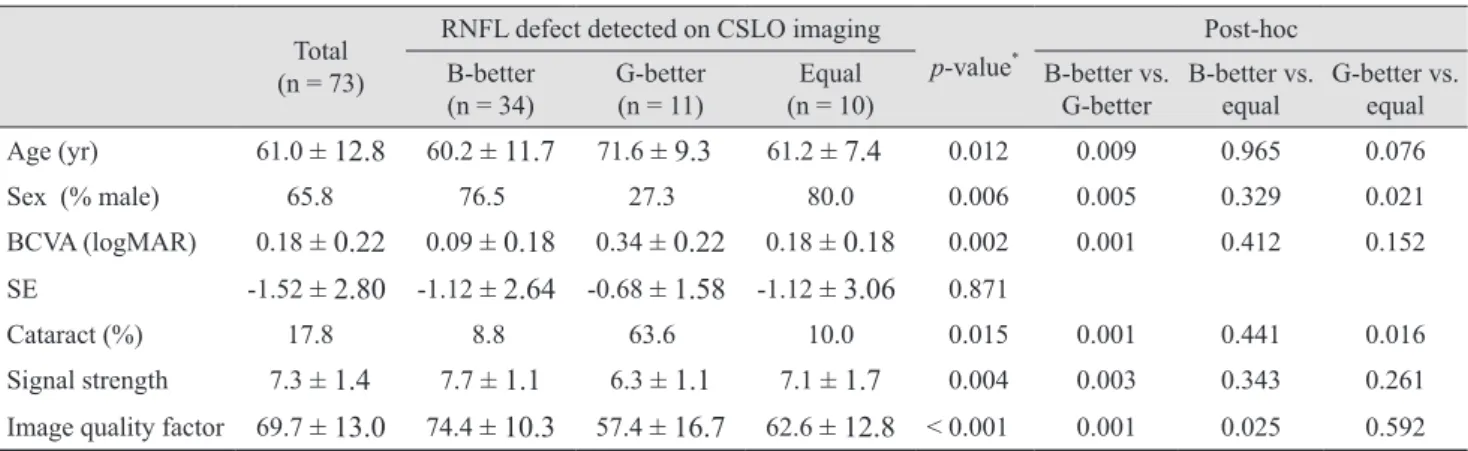
the defect was better visualized with blue imaging (B-better group) in 34 eyes (61.8%), and was better visualized with green imaging (G-better group) in 11 eyes (20%). The RNFL defect was equally visualized with both CSLO imaging sources in 10 eyes (18.2%). Representative cases of the B-bet- ter group and G-better group are shown in Fig. 2A, 2B and 3A, 3B, respectively. Demographic data and image quality indices of OCT for all enrolled eyes, the B-better group, the G-better group, and the equal group are shown in Table 2.
Statistical comparisons and p-values for the B-better and G-better groups are shown in Table 2. Age, gender, best-cor- rected visual acuity, the proportion of severe cataracts, signal strength of TD-OCT, and the image quality factor of SD- OCT were significantly different between groups (p = 0.009, 0.005, 0,001, 0.001, 0.003, and 0.001, respectively).
Discussion
Red-free light ophthalmoscopy of the RNFL was first re- ported by Vogt in 1913, and red-free imaging of the RNFL
was first introduced in 1965 [10-12]. The detailed pattern of the RNFL is difficult to observe by conventional photogra- phy due to its transparency [1,12], and many investigators have attempted to increase its visibility by improving photo- graphic procedures using different films, filters, cameras or processing procedures [1,5,10-18]. The visibility of the RNFL depends on two major factors: the degree of background pig- mentation and the remaining RNFL thickness [18]. Using the conventional red-free imaging technique, the filter highlights the reflectance from the RNFL and minimizes reflectance from the deeper retinal structures [17,18]. Many studies have investigated the best wavelength with which to illuminate the RNFL, and wavelengths ranging from 400 to 580 nm are preferred [11-15]. Historically, red-free imaging using a flash fundus camera with a green filter has been widely used for glaucoma examinations.
More recently, some researchers have attempted to re- place the conventional red-free imaging technique. Han and Park [19] reported digitally converted, non-mydriatic, red-free imaging to be an effective alternative to conven- tional red-free fundus photographs, and Hong et al. [20]
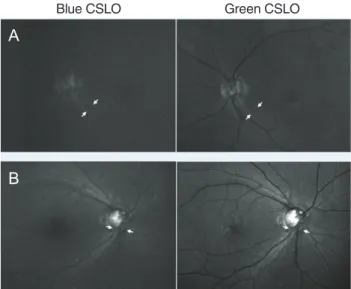
Fig. 2. Representative confocal scanning laser ophthalmoscope (CSLO) imaging of the blue better group. (A) Case 1: 82-year-old male. Multiple retinal nerve fiber layer (RNFL) defects (white arrow) were visible with both blue and green CSLO imaging.
Visualization of RNFL defects was better with blue compared to green CSLO imaging. (B) Case 2: 63-year-old female. A superior temporal RNFL defect (white arrow) was visible with both blue and green CSLO imaging. Visualization of the RNFL defect was better with blue compared to green CSLO imaging.
A
B
A
B
Fig. 3. Representative confocal scanning laser ophthalmoscope (CSLO) imaging of the green better group. (A) Case 3: 73-year- old female. An inferior temporal retinal nerve fiber layer (RNFL) defect (white arrow) was visible with both blue and green CSLO imaging. This patient had corneal opacity. Visualization of the RNFL defect was better with green versus blue CSLO imaging.
(B) Case 4: 76-year-old female. An inferior RNFL defect (white arrow) was visible with both blue and green CSLO imaging. The patient had severe cataracts according to slit lamp examination.
Visualization of the RNFL defect was better with green versus blue CSLO imaging. In particular, the boundary of the RNFL defect and its relationship with adjacent retinal vasculature were more clearly visible with green CSLO imaging.
Blue CSLO Green CSLO Blue CSLO Green CSLO
and Hong et al. [21] evaluated RNFL defects using CSLO photographs (Heidelberg Retina Angiograph [HRA] 1 with a 488-nm light source [Heidelberg Engineering, Heidel- berg, Germany]). The CSLO technique is now widely used in the glaucoma field for topographic mapping of the reti- nal surface, especially to map the optic nerve head (ONH) and to estimate the RNFL thickness around the ONH using the Heidelberg Retina Tomograph (HRT, Heidelberg Engi- neering) [8,22]. However, there have been few studies in- vestigating the use of CSLO with RNFL imaging [22,23].
For this study, we used a commercially available CSLO that could provide both blue (490 nm) and green (532 nm) imaging. Previous studies have compared RNFL image qualities with different filters on a conventional flash fun- dus camera [11,12,24]; however, only one previous report compared blue and green CSLO RNFL imaging, and that article was in German [25]. Both blue and green CSLO im- aging were sufficient in detecting the RNFL defect (Table 1), and the blue CSLO imaging source was significantly bet- ter than the green source at detecting the RNFL defect (p = 0.004) (Fig. 1). The CSLO illuminates only a small area of the retina using a laser beam, and by positioning the confo- cal apertures in front of the detector, scattered light can be reduced [26-28]. It is well known that the CSLO imaging is superior to conventional photographs in detecting glauco-
ma, even in eyes with cataracts, because of the CSLO’s high laser beam collimation and scanning illumination of the retina [26]. Our results are consistent with this evidence and revealed that CSLO imaging with both blue and green la- sers can provide high-quality imaging of RNFL defects.
Among the 55 eyes in which an RNFL defect was detect- ed via CSLO imaging, the defect was found using blue im- aging in all 55 eyes, but not all defects were found using green imaging. Furthermore, among the 55 RNFL de- fect-detected eyes, 34 (61.8%) were included in the B-better group (Fig. 2). These results indicate that blue CSLO imag- ing is superior to green CSLO imaging for the visualization of RNFL defects. The wavelength of the blue laser (490 nm) is shorter than that of the green laser (532 nm), and short wavelengths can reveal more superficial layers of the retina.
The shorter wavelength of the blue laser penetrates only the inner half of the sensory retina, and is suitable for observ- ing RNFLs. The longer wavelength of the green laser also penetrates the sensory retina, but the retinal pigment epithe- lium can be a barrier to light, making the green laser more suitable for the observation of retinal vasculatures found deeper than the RNFL [10]. Notably, these results are con- sistent with those found in a previous report performed with conventional red-free imaging using various filters [12].
In the G-better group, the quality of blue CSLO imaging
Table 2. Demographic data and image quality indices of OCT according to which CSLO imaging technique allowed better visual- ization of the RNFL defect
Total (n = 73)
RNFL defect detected on CSLO imaging
p-value*
Post-hoc B-better
(n = 34) G-better
(n = 11) Equal
(n = 10) B-better vs.
G-better B-better vs.
equal G-better vs.
equal Age (yr) 61.0 ± 12.8 60.2 ± 11.7 71.6 ± 9.3 61.2 ± 7.4 0.012 0.009 0.965 0.076
Sex (% male) 65.8 76.5 27.3 80.0 0.006 0.005 0.329 0.021
BCVA (logMAR) 0.18 ± 0.22 0.09 ± 0.18 0.34 ± 0.22 0.18 ± 0.18 0.002 0.001 0.412 0.152 SE -1.52 ± 2.80 -1.12 ± 2.64 -0.68 ± 1.58 -1.12 ± 3.06 0.871
Cataract (%) 17.8 8.8 63.6 10.0 0.015 0.001 0.441 0.016
Signal strength 7.3 ± 1.4 7.7 ± 1.1 6.3 ± 1.1 7.1 ± 1.7 0.004 0.003 0.343 0.261 Image quality factor 69.7 ± 13.0 74.4 ± 10.3 57.4 ± 16.7 62.6 ± 12.8 < 0.001 0.001 0.025 0.592 Post-hoc analysis was performed using Mann-Whitney U-test for continuous variables/chi-square test for categorical variables; Per- centage of moderate to severe cataracts was used for statistical evaluation; Signal strength is the image quality index on the time do- main-OCT (Stratus OCT); Image quality factor is the image quality index on the spectral domain OCT (3D OCT-2000).
OCT = optical coherence tomography; CSLO = confocal scanning laser ophthalmoscopy; RNFL = retinal nerve fiber layer; B-better = blue better; G-better = green better; BCVA = best-corrected visual acuity; logMAR = logarithm of the minimum angle of resolution; SE
= spherical equivalent.
*Statistical significance among groups was tested using the Kruskal-Wallis test for continuous variables/ chi-square test for categorical variables.
was low due to noise, which made green imaging relatively better (Fig. 3). We compared demographics and image quali- ty indices of OCT between the two groups. Best-corrected visual acuity was significantly worse, and the proportion of severe cataracts was significantly higher in the G-better group compared with the B-better group. Also, image quality indices were significantly lower for both TD-OCT and SD- OCT in the G-better group which could be explained by the higher media opacity in the G-better group compared with the B-better group. However, low image quality indices on OCT cannot be directly associated with the degree of media opacity. Some eyes with severe cataracts or corneal opacity were included in the G-better group (Fig. 3). Hazy media from corneal opacity, cataracts, or the vitreous humor could cause more scatter of the blue laser compared with the green laser because shorter wavelengths naturally tend to scatter more [12]. In addition, the mean patient age was significantly higher in the G-better group, and our results could therefore be explained by the fact that media opacities, including cata- racts, progress as a normal part of the aging process. Another possible explanation is that blue laser reflection from the RNFL can be attenuated due to generalized age-related RNFL thinning [29]. The proportion of males was signifi- cantly lower in the G-better group, but because no gender differences in RNFL thickness have been previously report- ed, other factors to explain the differences between the B-better and G-better groups must be considered in future studies [30]. Also, differences between the B-better and G-better groups could not be generalized due to small sample sizes, especially for the G-better group.
In addition to using the F-10, we also attempted to detect RNFL defects with CSLO imaging using the HRA2 Spec- tralis with a 488-nm wavelength source (Heidelberg Engi- neering). The HRA2 showed RNFL defects as well as the F-10, but the light reflex shown in the red-free mode was en- larged in wide-angle mode and made interpretation difficult.
The red-free mode of the HRA2 was also influenced by tear- ing status, which produced lace-like lines on the image. In addition to considering the HRA2, we also considered the HRT as an RNFL imaging source. Of the CSLOs widely used in the glaucoma field, the HRT is primarily focused on topographic mapping of the retinal surface and is generally used to map the ONH with a 670-nm wavelength. The key limitation of the HRT as a RNFL imaging source is that the scanning field is relatively small (15 degrees), and the clarity of the reflectance image also depends on the scan centration.
Recently, Ye et al. [22] reported poor agreement of the RNFL defect measurements from CSLO RNFL imaging between the HRT3 and OCT. Importantly, the F-10 used in our study did not have a light reflex in the red-free mode in the large, 60-degree scanning field, and the F-10 was not affected by tearing status. Future studies comparing the red-free modes of different CSLO devices are necessary.
There are several limitations of the current study. First, our study only focused on image quality, and we did not evaluate quantitative aspects of the RNFL defects. Detec- tion capacity as a diagnostic tool must be evaluated and compared with other established diagnostics by statistical analyses, but we only evaluated RNFL defects among eyes with glaucoma and compared detection rates between blue and green CSLO imaging. Second, we did not compare CSLO imaging with conventional red-free imaging using a flash fundus camera and green filter. This comparison could determine which imaging technique is superior for detecting RNFL defects. Third, all enrolled patients were Asian, so applying these results to other ethnicities may not be appropriate. Because Asians have thick RNFLs and hy- perpigmented retinas, red-free imaging shows RNFL de- fects well. Reflection from the thicker RNFL is prominent, and reflection from the deeper hyperpigmented retina is less visible [18]. Further studies to supplement the results of the current study are needed.
In conclusion, both blue and green CSLO imaging was useful in the detection of RNFL defects. Blue CSLO imag- ing was superior to green in visualizing RNFL defects in most of the patients with clear media, but green was valu- able in some patients whose media was more opaque. Com- bined use of both imaging techniques could be valuable in a clinical setting.
Conflict of Interest
Byung Ro Lee is a consultant for Nidek, Gamagori, Japan.
No other potential conflicts of interest relevant to this article is reported.
Supplemental Material
Supplemental Table 1 is available from: https://doi.
org/10.3341/kjo.2018.0075.
References
1. Hoyt WF, Frisen L, Newman NM. Fundoscopy of nerve fiber layer defects in glaucoma. Invest Ophthalmol 1973;12:814-29.
2. Quigley HA, Katz J, Derick RJ, et al. An evaluation of op- tic disc and nerve fiber layer examinations in monitoring progression of early glaucoma damage. Ophthalmology 1992;99:19-28.
3. Sommer A. Retinal nerve fiber layer. Am J Ophthalmol 1995;120:665-7.
4. Sommer A, Katz J, Quigley HA, et al. Clinically detectable nerve fiber atrophy precedes the onset of glaucomatous field loss. Arch Ophthalmol 1991;109:77-83.
5. Sommer A, Miller NR, Pollack I, et al. The nerve fiber layer in the diagnosis of glaucoma. Arch Ophthalmol 1977;95:2149-56.
6. Jonas JB, Schiro D. Localised wedge shaped defects of the retinal nerve fibre layer in glaucoma. Br J Ophthalmol 1994;78:285-90.
7. Tuulonen A, Airaksinen PJ, Montagna A, Nieminen H.
Screening for glaucoma with a non-mydriatic fundus cam- era. Acta Ophthalmol (Copenh) 1990;68:445-9.
8. Townsend KA, Wollstein G, Schuman JS. Imaging of the retinal nerve fibre layer for glaucoma. Br J Ophthalmol 2009;93:139-43.
9. DeLong ER, DeLong DM, Clarke-Pearson DL. Comparing the areas under two or more correlated receiver operating characteristic curves: a nonparametric approach. Biometrics 1988;44:837-45.
10. Behrendt T, Wilson LA. Spectral reflectance photography of the retina. Am J Ophthalmol 1965;59:1079-88.
11. Miller NR, George TW. Monochromatic (red-free) photog- raphy and ophthalmoscopy of the peripapillary retinal nerve fiber layer. Invest Ophthalmol Vis Sci 1978;17:1121-4.
12. Peli E, Hedges TR 3rd, McInnes T, et al. Nerve fiber layer photography: a comparative study. Acta Ophthalmol (Co- penh) 1987;65:71-80.
13. Frisen L. Photography of the retinal nerve fibre layer: an optimized procedure. Br J Ophthalmol 1980;64:641-50.
14. Airaksinen PJ, Nieminen H, Mustonen E. Retinal nerve fibre layer photography with a wide angle fundus camera.
Acta Ophthalmol (Copenh) 1982;60:362-8.
15. Sommer A, D’Anna SA, Kues HA, George T. High-resolu- tion photography of the retinal nerve fiber layer. Am J Oph- thalmol 1983;96:535-9.
16. Airaksinen PJ, Drance SM, Douglas GR, et al. Diffuse and localized nerve fiber loss in glaucoma. Am J Ophthalmol
1984;98:566-71.
17. Airaksinen PJ, Nieminen H. Retinal nerve fiber layer pho- tography in glaucoma. Ophthalmology 1985;92:877-9.
18. Hitchings RA, Poinoosawmy D, Poplar N, Sheth GP. Reti- nal nerve fibre layer photography in glaucomatous patients.
Eye (Lond) 1987;1:621-5.
19. Han ES, Park KH. Using red-free monochromatic conver- sions of nonmydriatic digital fundus images. Am J Ophthal- mol 2007;143:371-2.
20. Hong S, Ahn H, Ha SJ, et al. Early glaucoma detection using the Humphrey Matrix Perimeter, GDx VCC, Stratus OCT, and retinal nerve fiber layer photography. Ophthal- mology 2007;114:210-5.
21. Hong S, Moon JW, Ha SJ, et al. Evaluation of a new scor- ing system for retinal nerve fiber layer photography using HRA1 in 964 eyes. Korean J Ophthalmol 2007;21:216-21.
22. Ye C, To E, Weinreb RN, et al. Comparison of retinal nerve fiber layer imaging by spectral domain optical coherence tomography and scanning laser ophthalmoscopy. Ophthal- mology 2011;118:2196-202.
23. Kawaguchi I, Higashide T, Ohkubo S, et al. In vivo imaging and quantitative evaluation of the rat retinal nerve fiber lay- er using scanning laser ophthalmoscopy. Invest Ophthalmol Vis Sci 2006;47:2911-6.
24. Sommer A, Kues HA, D’Anna SA, et al. Cross-polariza- tion photography of the nerve fiber layer. Arch Ophthalmol 1984;102:864-9.
25. Rohrschneider K, Kruse FE, Burk RO, Volcker HE. Pos- sibilities for imaging the retinal nerve fiber layer with the scanning laser ophthalmoscope. Ophthalmologe 1995;92:515-20.
26. Beckman C, Bond-Taylor L, Lindblom B, Sjostrand J. Con- focal fundus imaging with a scanning laser ophthalmoscope in eyes with cataract. Br J Ophthalmol 1995;79:900-4.
27. Webb RH, Hughes GW. Scanning laser ophthalmoscope.
IEEE Trans Biomed Eng 1981;28:488-92.
28. Webb RH, Hughes GW, Delori FC. Confocal scanning laser ophthalmoscope. Appl Opt 1987;26:1492-9.
29. Da Pozzo S, Iacono P, Marchesan R, et al. The effect of age- ing on retinal nerve fibre layer thickness: an evaluation by scanning laser polarimetry with variable corneal compensa- tion. Acta Ophthalmol Scand 2006;84:375-9.
30. Samarawickrama C, Wang JJ, Huynh SC, et al. Ethnic differences in optic nerve head and retinal nerve fibre layer thickness parameters in children. Br J Ophthalmol 2010;94:871-6.