538
ORIGINAL ARTICLEDOI 10.4070 / kcj.2009.39.12.538
Print ISSN 1738-5520 / On-line ISSN 1738-5555 Copyright ⓒ 2009 The Korean Society of Cardiology
Open Access
N-Terminal Pro-B-Type Natriuretic Peptide in Overweight and Obese Patients With and Without Diabetes: An Analysis Based on Body Mass Index and Left Ventricular Geometry
Seung Jei Park, MD, Kyoung Im Cho, MD, Sun Jae Jung, Sung Won Choi, MD, Jae Won Choi, MD, Dong Won Lee, MD, Hyeon Gook Lee, MD and Tae Ik Kim, MD
Division of Cardiology, Maryknoll Medical Center, Busan, KoreaABSTRACT
Background and Objectives:
Several recent studies have shown that there is an inverse relationship between plasma B-type natriuretic peptide (BNP) and body mass index (BMI) in subjects with and without heart failure.
Obesity frequently coexists with diabetes, so it is important to consider the relationship between diabetes and natriuretic peptide levels. We evaluated the influence of diabetes on the correlation of BNP and BMI.
Subjects and Methods:We examined 933 patients with chest pain and/or dyspnea undergoing cardiac catheterization between Feb. 2006 and Nov. 2007 in the Maryknoll cardiac center who had creatinine levels <2.0 mg/dL and normal systolic heart function. BMI was checked, transthoracic echocardiography was performed, and amino- terminal pro-brain natriuretic peptide (NT-proBNP) was sampled at the start of each case.
Results:In 733 non- diabetic patients, mean plasma NT-proBNP levels of non obese individuals (BMI <23 kg/m
2), overweight indi- viduals (23≤ BMI <25 kg/m
2), and obese individuals (BMI ≥25 kg/m
2) showed a significant negative correlation with increasing BMI (856.39±237.3 pg/mL, 601.69±159.6 pg/mL, 289.62±164.9 pg/mL, respectively, p<0.0001).
However, in 200 diabetic patients, the correlation between BMI and NT-proBNP was not significant (r=-0.21, p=0.19), and NT-proBNP did not correlate with mitral E/Ea in obese diabetic patients (r=0.14, p=0.56). NT- proBNP was significantly correlated with mitral E/Ea in the non-obese (r=0.24, p=0.008) and non diabetic (r=0.32, p=0.003) groups. Left ventricular (LV) mass index was significantly correlated with NT-proBNP in all BMI groups (r=0.61, p<0.001), and patients with concentric cardiac hypertrophy showed the highest NT-proBNP levels.
Conclusion:The present study demonstrates that obese patients have reduced concentrations of NT- proBNP compared to non obese patients despite having higher LV filling pressures. However, NT-proBNP is not suppressed in obese patients with diabetes. This suggests that factors other than cardiac status affect NT-proBNP concentrations.
(Korean Circ J 2009;39:538-544)KEY WORDS:
B-type natriuretic peptide; Body mass index; Obesity.
Introduction
Natriuretic peptides are frequently used in diagnosing
and monitoring patients with congestive heart failure (CHF). B-Type natriuretic peptide (BNP) and aminoter- minal pro-brain natriuretic peptide (NT-proBNP) are believed to correlate with the severity of heart failure symptoms and objective measures of heart function.
1-3)The NT-proBNP levels are affected by demographic va- riables such as age, gender, and ethnicity, and clinical characteristics such as hypertension, atrial fibrillation, and renal function.
4-6)Elevated body mass index (BMI) and obesity have been associated with hypertension, in- sulin resistance and dyslipidemia, and contribute to de- leterious hemodynamic and morphologic cardiovascular changes.
7-9)Recent studies demonstrated that obesity is associated with decreased levels of NT-proBNP and rais- ed concerns about the diagnostic and prognostic validity
Received: May 2, 2009
Revision Received: June 26, 2009 Accepted: July 9, 2009
Correspondence: Kyoung Im Cho, MD,Division of Cardiology, Maryknoll Medical Center, 12 Daecheong-dong 4-ga, Jung-gu, Busan 600-730, Korea
Tel: 82-51-461-2349, Fax: 82-51-465-7470 E-mail: [email protected]
○cc This is an Open Access article distributed under the terms of the Creative Commons Attribution Non-Commercial License (http://creativecommons.
org/licenses/by-nc/3.0) which permits unrestricted non-commercial use, distribution, and reproduction in any medium, provided the original work is properly cited.
Seung Jei Park, et al.·
539
of natriuretic peptides in obese patients.
10)11)NT-proBNP has been shown to be increased in patients with dia- betes mellitus (DM), even in the absence of structural heart disease, and obesity frequently coexists with dia- betes. Hence, variety factors should be considered to be associated with the interindividual variability of plasma NT-proBNP levels in the diagnosis and management of heart failure patients. So, our study aimed to further explore the association between elevated BMI and NT- proBNP in diabetes and the relationship of echocardio- graphic indexes of increased left ventricular (LV) filling pressure, LV geometry and atherosclerosis as measured by common carotid intima-media thickness (CCIMT).
Subjects and Methods
Patients with chest pain and/or dyspnea who under- went cardiac catheterization from Feb. 2006 to Nov. 2007 in Maryknoll cardiac center were enrolled. Subjects with atrial fibrillation or other significant cardiac arrhythmia and acute myocardial infarction at the time of clinical assessment were excluded. Other exclusion criteria in- cluded patients who did not provide written consent and patients with regional wall motion abnormalities; symp- tomatic or asymptomatic LV systolic dysfunction (ejec- tion fraction <50%); significant valvular disease (mo- derate or severe valvular dysfunction); and neoplastic, hepatic, and renal dysfunction. At the time of enroll- ment, data were collected on each subject, including de- mographics, physical examination, results of unblinded laboratory testing, and self-reported medical history and active symptoms. Severity of dyspnea was based on New York Heart Association criteria. Diabetes mellitus (DM) was diagnosed if fasting plasma glucose was ≥126 mg/
dL or if participants were taking insulin or oral hypogly- cemic medications. Patients without DM were defined as non DM. Patients were divided into body mass index (BMI) >25 g/m
2(obese), 23 to 25 (overweight), and <23 kg/m
2(non obese) according to the guideline of the Korean society for the study of obesity. Significant co- ronary artery disease was considered if the stenosis was above 50% from the quantitative angiography.
Echocardiographic evaluation
Measurements of left atrial (LA) dimension, left ven- tricular (LV) dimension, LV end diastolic and systolic volume, interventricular septal thickness (IVSd), LV pos- terior wall thickness (LVPWTd) and ejection fraction were performed from 2-dimensionally targeted M-mode tracings according to the recommendations of the Ame- rican Society of Echocardiography (ASE). LV mass was calculated by the corrected ASE cube formula and in- dexed for body surface area to obtain the LV mass index.
The relative posterior wall thickness (RWT) was mea- sured at end diastole as the ratio between the double of
posterior wall thickness to the LV diastolic cavity dia- meter. LV hypertrophy (LVH) was defined as increased LV mass index >104 g/m
2in women and >116 g/m
2in men.
12)Concentric hypertrophy was defined as LVH with increased RWT (>0.43). Concentric LV remodeling was defined as increased RWT with normal LV mass index.
Eccentric hypertrophy was defined as LVH without in- creased RWT. Transmitral peak early (E), atrial (A) dia- stolic velocities were measured in the apical 4-chamber view with the sampling volume positioned at the tips of the mitral valve. The isovolumic relaxation time (IRT), isovolumic contraction time (ICT) and total ejection time was measured at the apical 5-chamber view with the sampling volume positioned between the mitral valve and the LV outflow tract as the time taken from the closure of the aortic valve to the opening of the mitral valve. The index of combined LV systolic and diastolic function (the sum of ICT and IRT divided by ejection time) was calculated which described by Tei et al.
13)Tissue Doppler measurements were obtained from the apical 4-chamber view, and the sampling volume was placed at the medial (septal) and lateral corners of the mitral annulus. Early (Ea) diastolic mitral annular velo- cities were taken as the average of 3 measurements at each side of the mitral annulus. All echocardiograms were performed and analyzed by one observer.
Measurement of common carotid IMT
Ultrasonography of the carotid arteries was performed with a 10-MHz transducer (System Five, General Elec- tronics Corp., Horten, Norway). When an optimal lon- gitudinal image of the common carotid artery was ob- tained, it was frozen on the R wave of the electrocardio- gram, and 5 measurements were taken from the far wall of the distal 1 cm of the common carotid artery. This was repeated on the other side, and the average mea- surement from the 2 sides was taken as the CCIMT (a surrogate index for atherosclerosis). Plaques or focal protrusions were avoided. Measurements were taken at the time of examination before laboratory analysis.
Measurement of plasma NT-proBNP levels The NT-proBNP level was analyzed at the time of cli- nical assessment. For each NT-proBNP measurement, 5 mL of whole blood was collected into tubes containing ethylene diamine tetraacetic acid (EDTA) and measured using the Elecycs 2010 platform (Roche Diagnostics, USA).
Statistical analysis
All data were presented as means±standard devia-
tion and analyzed using standard statistical software
{Statistical Package for Social Science (SPSS) version 13.0,
Chicago, IL, USA}. Because of the large range in NT-
proBNP, analysis and results using a semilogarithmic
540
·NT-ProBNP in Overweight and Obese Patientsscale is also reported. Continuous variables among the DM and the non DM group were analyzed by one-way ANOVA and variables between the two groups were compared by t-test. Discontinuous variables were com- pared by Chi-square test. Correlations were obtained us- ing Pearson’s method. Multivariate stepwise logistic re- gression analysis was performed to assess the relation- ship between the predictor variables such as age, gender, BMI, NYHA class, hypertension, diabetes mellitus, me- dications, hemodynamic and echocardiographic indexes, and creatinine. A p<0.05 was considered statistically significant.
Results
The clinical characteristics of the study population Baseline characteristics of the overall patient popula- tion are listed in Table 1. Among 933 patients, 733 were patients without DM {obese (n=287, 39.2%), over- weight patients (n=216, 29.5%), and non obese (n=230, 31.4%)} and 200 were DM patients {obese (n=91, 45.5%), overweight patients (n=55, 27.5%), and non obese (n=54, 27%)}. The mean age was 60.8±10.39 years in DM patients and 64.6±8.75 years in non-DM patients. Subjects with DM tended to be older and had a higher body mass index than non-diabetes groups but had a similar distribution of gender. There was no sig- nificant difference between the DM and non-DM groups in cholesterol, systolic blood pressure, diastolic blood pressure, BUN, creatinine, and C-reactive protein. Ho- wever, mean plasma NT-proBNP levels were significantly higher in DM patients than non-DM patients (913.28
±2720.58 and 559.42±1652 pg/mL, p=0.006) (Table 1). Coronary artery stenosis lesion length (p=0.039),
stent length (p=0.024), coronary artery adventitial dia- meter (p=0.034), and mean CCIMT (p=0.016) were sig- nificant higher in DM patients than non-DM patients (Table 2). In non DM patients, CCIMT was significantly higher in patients with significant coronary artery di- sease than patients with minimal coronary artery di- sease (1.23±0.568 mm vs. 1.00±0.304 mm, p=0.005).
However, CCIMT showed no significant correlation with mean plasma NT-proBNP level (Table 3).
Table 1. Comparisons of clinical variables between DM and non- DM groups
Non-DM (n=733)
DM (n=200) p Age (years) 060.3±11.12 64.8±9.25 0.054
Male (%) 62.3 46.7 0.065
Body weight (kg) 58.3±9.80 62.5±7.90 0.012 Body mass index (g/m2) 23.78±4.560 25.43±3.380 0.005 Total cholesterol (mg/dL) 179.6±50.22 173.0±40.92 0.687 Systolic BP (mmHg) 127.2±20.96 129.4±20.23 0.544 Diastolic BP (mmHg) 079.2±13.42 077.7±11.56 0.436 NT-pro BNP (pg/mL) 559.42±16520 913.28±2720.58 0.006 BUN (mg/dL) 018.9±21.64 022.5±17.84 0.069 Creatine (mg/dL) 01.0±0.84 01.2±0.96 0.062 Fasting glucose (mg/dL) 101±11.9 0127±14.2 0.001 cTnT (ng/mL) 0.02±0.03 0.04±0.05 0.085 hsCRP (mg/L) 008.3±25.11 007.2±16.21 0.233 All values are described in mean±SD. DM: diabetes mellitus, BP:
blood pressure, NT-pro BNP: amino-terminal pro-brain natriuretic peptide, BUN: blood urea nitrogen, cTnT: cardiac specific troponin, hsCRP: high sensitivity C-reactive protein
Table 2. Comparisons of coronary angiographic and carotid ul- trasonographic variables between DM and non-DM groups
Non-DM (n=733)
DM (n=200) p Lesion length (mm) 4.96±9.80 08.02±11.67 0.039 Stent length (mm) 05.64±11.22 09.48±13.48 0.024 Adventitial diameter (mm) 7.95±1.05 8.35±0.64 0.034 CCIMT (mm) 01.15±0.540 01.36±0.700 0.016 All values are described in mean±SD. DM: diabetes mellitus, CC- IMT: common carotid intima-media thickness
Table 4. Comparisons of echocardiographic variables between the DM and the non-DM group
Non-DM (n=733)
DM
(n=200) p LV EF (%) 063.3±6.71 061.9±8.69 0.087
RWT 04.37±0.55 04.49±0.67 0.065
LV mass index (g/cm2) 121.18±37.99 129.82±27.83 0.012 LA diameter (cm) 04.07±0.45 4.27±0.45 0.005 E (cm/sec) 063.72±15.47 065.36±17.48 0.687 A (cm/sec) 079.63±16.14 086.41±17.86 0.544 E/Ea 07.35±2.65 08.61±2.78 0.005 Tei index 00.30±0.20 0.34±0.19 0.006 All values are described in mean±SD. LV: left atrium, DM: dia- betes mellitus, EF: ejection fraction, RWT: relative wall thickness, LAD: left atrial dimension, E: peak early velocity, A: peak atrial ve- locity, Ea: Early diastolic mitral annular velocity
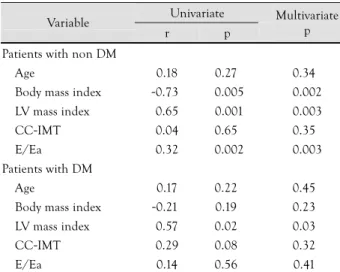
Table 3. Correlation analysis of variables with plasma NT-proBNP between the DM and the non-DM group
Univariate Variable
r p
Multivariate p Patients with non DM
Age 0.18 0.270 0.340
Body mass index -0.73- 0.005 0.002 LV mass index 0.65 0.001 0.003
CC-IMT 0.04 0.650 0.350
E/Ea 0.32 0.002 0.003
Patients with DM
Age 0.17 0.220 0.450
Body mass index -0.21- 0.190 0.230 LV mass index 0.57 0.020 0.030
CC-IMT 0.29 0.080 0.320
E/Ea 0.14 0.560 0.410
DM: diabetes mellitus, NT-proBNP: aminoterminal pro-brain na- triuretic peptide, E: peak early velocity, CC-IMT: common ca- rotid intima-media thickness, Ea: early diastolic mitral annular ve- locity
Seung Jei Park, et al.·
541
The correlation between plasma BNP level and echocardiographic findings
There was no significant difference between the DM and non-DM groups in LV ejection fraction, relative wall thickness, mitral E and A velocity. However, LV mass index, LA diameter, E/Ea and Tei index were significantly higher in DM patients than non-DM pa-
tients (Table 4). Plasma NT-proBNP values did not cor- relate with LV filling pressure represented by mitral E/Ea in obese diabetic patients (r=0.14, p=0.56). How- ever, NT-proBNP was significantly correlated with this variable in the non obese (r=0.24, p=0.008) and non- DM patients (r=0.32, p=0.005). The significant cor- relation of NT-proBNP and LV mass index was observ- ed in univariate linear regression analysis (r=0.65, p=
0.001) and patients with concentric hypertrophy showed the highest NT-proBNP levels (Fig. 1). Even after ad- justing for age, gender, diabetes, creatinine, ejection frac- tion and E/Ea in multivariate linear regression analysis, LV mass index was significantly associated with NT- proBNP (r=0.57, p=0.03) (Table 3).
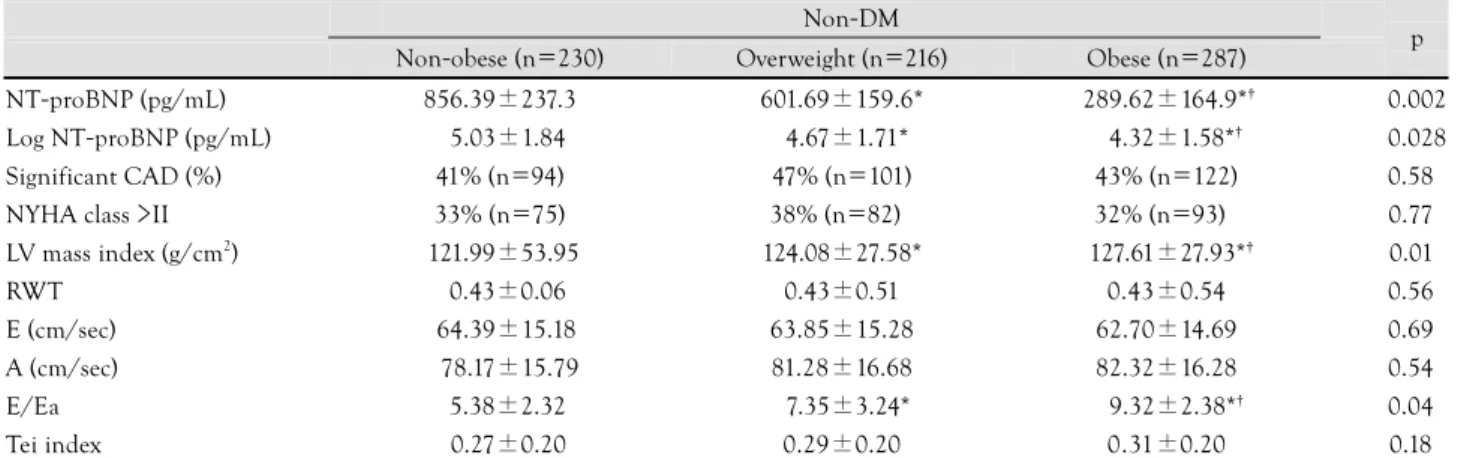
The correlation between plasma BNP level and BMI
In 733 non-DM patients, plasma NT-proBNP levels were significantly lower in obese (289.62±164.9 pg/mL) and overweight patients (601.69±159.6 pg/mL) com- pared with non obese patients (856.39±237.3 pg/mL)
Table 6. Comparisons of variables in the DM group according to the body mass index DM
Non obese (n=54) Overweight (n=55) Obese (n=91) p
NT-proBNP (pg/mL) 963.19±223.7 1450.15±457.3 658.05±147.1 0.320
Log NT-proBNP (pg/mL) 05.52±1.97 005.36±2.41 5.13±1.74 0.650
Significant CAD (%) 63% (n=34) 53% (n=29) 54% (n=49) 0.120
NYHA class >II 54% (n=29) 47% (n=26) 44% (n=40) 0.230
LV mass index (g/cm3) 127.22±24.66 0129.93±26.36 133.11±34.85 0.120
RWT 00.43±0.06 00.43±0.51 0.43±0.54 0.320
E velocity 068.26±15.93 066.92±17.89 65.36±17.47 0.150
A velocity 089.63±19.34 0 86.79±15.89 85.02±14.38 0.500
E/Ea 07.48±2.32 0 8.45±2.56 9.92±2.45 0.260
Tei index 00.28±0.22 0 0.31±0.15* 0.38±0.22*† 0.049
All values are described in mean±SD. DM: diabetes mellitus, NT-proBNP: amino-terminal pro-brain natriuretic peptide, CAD: coronary artery disease, NYHA: New York Heart Association, LV: left ventricle, RWT: relative wall thickness, E: peak early velocity, A: peak atrial velocity, Ea: early diastolic mitral annular velocity. *p<0.05 vs. non obese, †p<0.05 vs. overweight
Table 5. Comparisons of variables in the non-DM group according to the body mass index Non-DM
Non-obese (n=230) Overweight (n=216) Obese (n=287) p NT-proBNP (pg/mL) 856.39±237.3 601.69±159.6* 0289.62±164.9*† 0.002 Log NT-proBNP (pg/mL) 05.03±1.84 04.67±1.71* 04.32±1.58*† 0.028
Significant CAD (%) 41% (n=94) 47% (n=101) 43% (n=122) 0.580
NYHA class >II 33% (n=75) 38% (n=82)1 32% (n=93)1 0.770
LV mass index (g/cm2) 0121.99±53.95 124.08±27.58* 0127.61±27.93*† 0.010
RWT 00.43±0.06 0.43±0.51 0.43±0.54 0.560
E (cm/sec) 064.39±15.18 63.85±15.28 62.70±14.69 0.690
A (cm/sec) 078.17±15.79 81.28±16.68 82.32±16.28 0.540
E/Ea 05.38±2.32 07.35±3.24* 09.32±2.38*† 0.040
Tei index 00.27±0.20 0.29±0.20 0.31±0.20 0.180
All values are described in mean±SD. DM: diabetes mellitus, NT-proBNP: amino-terminal pro-brain natriuretic peptide, CAD: coronary artery disease, NYHA: New York Heart Association, LV: left ventricle, RWT: relative wall thickness, E: peak early velocity, A: peak atrial velocity, Ea: early diastolic mitral annular velocity. *p<0.05 vs. non obese, †p<0.05 vs. overweight
Fig. 1. Comparisons of NT-proBNP level according to the left ven- tricular geometry in the DM and non-DM group. DM: diabetes mellitus, NT-pro BNP: aminoterminal pro-brain natriuretic peptide, CR: concentric remodeling, EH: eccentric hypertrophy, CH: con- centric hypertrophy.
0 200 400 600 800 1,000 1,200 1,400
non DM DM
Normal CR EH CH (pg/mL)
542
·NT-ProBNP in Overweight and Obese Patients(p<0001) despite similar significant coronary artery di- sease and severity of dyspnea (Table 5). However, in 200 DM patients, plasma NT-proBNP levels was 963.19±
223.7 pg/mL, 1450.15±457.3 pg/mL, 658.05±147.1 pg/mL, respectively, which showed no significant ne- gative correlation between BMI and NT-proBNP (r=
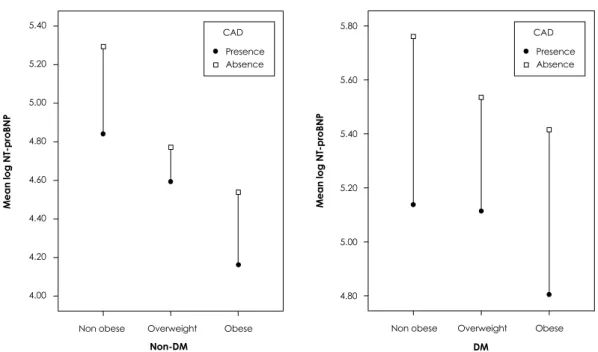
- 0.21, p=0.19) (Table 3 and 6) Drop-line charts of log- transformed mean plasma NT-proBNP levels (dependent variable) against BMI (independent) according to pre- sence of significant coronary disease are shown in Fig. 2.
Mean log NT-proBNP levels among patients with signi- ficant coronary artery disease decrease with increasing obesity, which is statistically significant in non-DM pa- tients (5.29±1.62, 4.77±1.65, 4.53±1.43, p=0.002).
Discussion
In recent years, natriuretic peptides have been gaining widespread popularity as sensitive and specific markers for the LV failure. BNP is principally produced in the ventricles as prohormone pre-proBNP, which is then enzymatically cleaved into the biologically active BNP (32 amino acids in length) and the biologically inactive NT-proBNP (76 amino acids in length).
14)It is found mainly in the cardiac ventricles, and its release appears to be directly proportional to ventricular volume expan- sion and pressure overload.
15)BNP is an independent predictor of high LV end-diastolic pressure and the NT- proBNP levels were positively correlated with the NYHA functional class of dyspnea and the systolic dysfunc- tion.
16)17)The measurement of NT-proBNP has been reported to be a non-invasive, simple, and accurate test for older patients, obese patients, patients with chronic
pulmonary diseases, and even for those patients having difficulty being tested by echocardiogram. Thus, its cli- nical usefulness for the differential diagnosis of heart failure is important.
18)19)Elevated body mass index (BMI) and obesity have been associated with hypertension, in- sulin resistance and recent studies demonstrated that obesity is associated with decreased levels of NT-proBNP and raised concerns about the diagnostic and prognos- tic validity of natriuretic peptides in obese patients.
11)20)Several potential mechanistic explanations deserve con- sideration. First, it is possible that the low natriuretic peptide levels in overweight and obese patients reflect less advanced stages of HF compared with lean patients.
21)Cardiac cachexia, a state characterized by weight loss and neurohumoral/cytokine activation, is another potential explanation for a low BMI-high BNP association.
22)Re- cent evidence suggests that there may be increased clea- rance of circulating BNP in obesity because natriuretic peptide clearance receptors are abundant on human adi- pocytes.
23)High levels of BNP could, through their lipo- lytic effect, be expected to exaggerate the wasting process, which implies that a reduced BNP level in obese HF patients may be related to a decreased level of wasting.
Conversely, it is also possible that overweight and obe- sity are associated with less robust synthesis and/or re- lease of BNP from the myocardium.
5)In the present study, NT-proBNP concentrations were lower in obese non DM patients despite higher E/Ea which has been shown to correlate with invasive measures of LV filling pres- sure
24)and this occurs with presence of myocardial is- chemia confirmed by coronary angiography. These find- ings have several implications. Not only do they bring into question the proper use of NT-proBNP as diagno-
Fig. 2. Drop-line charts of mean log NT-proBNP showing differences in the presence of significant coronary artery disease (CAD). Con- centrations decrease with increasing obesity, which is statistically significant in non-DM patients (p=0.002). NT-pro BNP: amino-terminal pro-brain natriuretic peptide, DM: diabetes mellitus.
Mean log NT-proBNP
Non obese Overweight Obese Non-DM
4.00 4.20 4.40 4.60 4.80 5.00 5.20
5.40 CAD
Presence Absence
4.80 5.00 5.20 5.40 5.60 5.80
Mean log NT-proBNP
Non obese Overweight Obese DM
CAD Presence Absence
Seung Jei Park, et al.·
543
stic tests for obese patients with volume overload, but they also raise the possibility that the decreased con- centrations of natriuretic peptides may play a role in the development of heart failure in obese patients. However, the present study demonstrates that NT-proBNP is not suppressed in obese patients with DM and also shows a poor correlation with E/Ea. The mechanisms of NT- pro BNP is not suppressed in obese patients with diabetes can be explained by several possibilities. The natriuretic system and adiposity are closely linked bidirectionally.
25)Lipolysis is mediated by catecholamines (stimulation of lipolysis) and insulin (inhibition of lipolysis), and na- triuretic peptides have recently been shown to be im- portant stimuli for lipolysis in humans and are similar in potency to catecholamines, and their effect is in- dependent of both catecholamines and an insulin pa- thway.
26)So, obese diabetic patients may have higher con- centrations of natriuretic peptides compared with those without diabetes. Moreover, DM patients may be more likely to excrete NT-proBNP (and BNP) in response to a similar degree of ischemic insult,
27)and then the higher NT-proBNP concentrations that we observed in patients with DM in the absence of overt HF, a finding consi- dered to represent a “summation effect” of risk factors for structural heart disease, may still indicate an increas- ed risk for cardiovascular morbidity and mortality.
Our present study is meaningful as we obtained the basic clinical data on the NT-proBNP test from a large study population. However, as our study was a cross-sec- tion study and the study population was not homoge- nous, further prospective study will be required. In ad- dition, although the accuracy of the test was high, in some patients, their clinical results did not correlate to the NT-proBNP value. In the interpretation of the NT- proBNP test, therefore, clinical results and echocardio- graphy must also be taken into consideration. Third, the patients with renal insufficiency were also excluded in the present study. Because, in the setting of HF, impair- ed renal function is common and strongly related with adverse outcomes, further study is warranted that will investigate the relationship between obesity and plasma BNP under the condition of renal insufficiency. Further studies will be required on patients showing a discrepancy between clinical features and symptoms and the NT- proBNP values.
REFERENCES
1) Maisel AS, Krishnaswami P, Nowak RM, et al. Rapid measure- ment of B-type natriuretic peptide in the emergency diagnosis of heart failure. N Engl J Med 2002;347:161-7.
2) Maeda K, Tsutamoto T, Wada A, et al. Plasma brain natriuretic peptide as a biochemical marker of high left ventricular end dia- stolic pressure in patients with symptomatic left ventricular dys- function. Am Heart J 1998;135:825-32.
3) Friedl W, Mair J, Thomas S, Pichler M, Puschendorf B. Natriure- tic peptides and cyclic guanosine 3’, 5’-monophosphate in asymp-
tomatic and symptomatic left ventricular dysfunction. Heart 1996;
76:129-36.
4) Maisel AS, Clopton P, Krishnaswamy P, et al. Impact of age, race, and sex on the ability of B-type natriuretic peptide to aid in the emergency diagnosis of heart failure: results from the Brea- thing Not Properly (BNP) multinational study. Am Heart J 2004;
147:1078-84.
5) Wang TJ, Larson MG, Levy D, et al. Impact of obesity on plasma natriuretic peptide levels. Circulation 2004;109:594-600.
6) Tang WH, Girod JP, Lee MJ, et al. Plasma B-type natriuretic peptide levels in ambulatory patients with established chronic symptomatic systolic heart failure. Circulation 2003;108:2964-6.
7) Krauss RM, Winston M, Fletcher BJ, Grundy SM. Obesity: im- pact on cardiovascular disease. Circulation 1998;98:1472-6.
8) de Divitiis O, Fazio S, Petitto M, Maddalena G, Contaldo F, Mancini M. Obesity and cardiac function. Circulation 1981;64:
477-82.
9) Alpert MA, Lambert CR, Terry BE, et al. Influence of left ven- tricular mass on left ventricular diastolic filling in normotensive morbid obesity. Am Heart J 1995;130:1068-73.
10) Rivera, Cortés, Salvador, et al. Obese subjects with heart failure have lower N-terminal pro-brain natriuretic peptide plasma levels irrespective of etiology. Eur J Heart Fail 2005;7:1168-70.
11) Taylor JA, Christenson RH, Rao K, Jorge M, Gottlieb SS. B-type natriuretic peptide and N-terminal pro B-type natriuretic peptide are depressed in obesity despite higher left ventricular end dia- stolic pressures. Am Heart J 2006;152:1071-6.
12) Ganau A, Devereux RB, Roman MJ, et al. Patterns of left ventri- cular hypertrophy and geometric remodeling in essential hyper- tension. J Am Coll Cardiol 1992;19:1550-8.
13) Tei C, Nishimura RA, Seward JB, Tajik AJ. Noninvasive Doppler- derived myocardial performance index: correlation with simulta- neous measurements of cardiac catheterization measurements. J Am Soc Echocardiogr 1997;10:169-78.
14) Hall C. Essential biochemistry and physiology of (NT-pro) BNP.
Eur J Heart Fail 2004;6:257-60.
15) Maeda K, Tsutamoto T, Wada A, Hisanaga T, Kinoshita M.
Plasma brain natriuretic peptide as a biochemical marker of high left ventricular end-diastolic pressure in patients with sympto- matic left ventricular dysfunction. Am Heart J 1998;135:825-32.
16) Kang DH, Kim MJ, Kang SJ, et al. Role of B-type natriuretic peptide in diagnosis and follow-up of diastolic heart failure.
Korean Circ J 2006;36:359-65.
17) Kim SH, Kim JS, Baek KK, et al. Role of NT-proPNP in evalua- tion of functional status in congestive heart failure. Korean Circ J 2004;34:894-9.
18) Dao Q, Krishnaswamy P, Kazanegra R, et al. Utility of B-type natriuretic peptide in the diagnosis of congestive heart failure in an urgentcare setting. J Am Coll Cardiol 2001;37:379-85.
19) Choi JY. The role of Brain natriuretic peptide in the patients with acute dyspnea in the emergency department. Korean Circ J 2007;
37:464-9.
20) McCord J, Mundy BJ, Hudson MP, et al. Relationship between obesity and B-type natriuretic peptide levels. Arch Intern Med 2004;164:2247-52.
21) Horwich TB, Fonarow GC, Hamilton MA, MacLellan WR, Woo MA, Tillisch JH. The relationship between obesity and mortality in patients with heart failure. J Am Coll Cardiol 2001;38:789-95.
22) Levine B, Kalman J, Mayer L, Fillit HM, Packer M. Elevated circulating levels of tumor necrosis factor in severe chronic heart failure. N Engl J Med 1990;323:236-41.
23) Sarzani R, Dessi-Fulgheri P, Paci VM, Espinosa E, Rappelli A.
Expression of natriuretic peptide receptors in human adipose and other tissues. J Endocrinol Invest 1996;19:581-5.
544
·NT-ProBNP in Overweight and Obese Patients24) Ommen SR, Nishimura RA, Appleton CP, et al. Clinical utility of Doppler echocardiography and tissue Doppler imaging in the estimation of left ventricular filling pressures: a comparative simultaneous Doppler-catheterisation study. Circulation 2000;
102:1788-94.
25) Sengenes C. Increased lipolysis in adipose tissue and lipid mo- bilization to natriuretic peptides during low-calorie diet in obes
women. Int J Obes Relat Metab Disord 2002;26:24-32.
26) Kalra PR, Tigas S. Regulation of lipolysis: natriuretic peptides and the development of cachexia. Int J Cardiol 2002;85:125-32.
27) Bhalla MA, Chiang A, Epshteyn VA, et al. Prognostic role of B- type natriuretic peptide levels in patients with type 2 diabetes mel- litus. J Am Coll Cardiol 2004;44:1047-52.