Environmental Assessment of Smart Grid Station Project Centered on Pilot Project of Korea Electric Power Corporation Building
Park, Sun-Kyoung
*†, Son, Sung-Yong
**, Kim, Dongwook
**and Kim, Buhm-Kyu
****
Hanyang Cyber University, Korea
**
Department of Electrical Engineering, Gachon University, Korea
***
KEPCO Economy & Management Research Institute, KEPCO, Korea
ABSTRACT
Increased evidences reveal that the global climate change adversely affect on the environment. Smart grid system is one of the ways to reduce greenhouse gas emissions in the electricity generation sector. Since 2013, Korea Electric Power Corporation (KEPCO) has installed smart grid station in KEPCO office buildings. The goal of this paper is two folds. One is to quantify the reduction in greenhouse gas emissions through smart grid stations installed in KEPCO office buildings as a part of pilot project. Among components of smart grid stations, this research focused on the photovoltaic power system (PV) and energy storage system (ESS). The other is to estimate the reduction in greenhouse gas emissions when PV is applied on individual houses. Results show that greenhouse gas emissions reduce 5.8∼11.3% of the emissions generated through the electricity usage after PV is applied in KEPCO office buildings. The greenhouse gas emissions reduction from ESS is not apparent. When PV of 200∼500 W is installed in individual houses, annual greenhouse gas emission reduction in 2016 is expected to be approximately 2.2∼5.4 million tCO
2-eq, equivalent to 6∼15% of greenhouse gas emissions through the electricity usage in the house hold sector. The saving of annual electricity cost in the individual house through PV of 200 W and 500 W is expected to be 47∼179 thous and KRW and 123∼451 thousand KRW, respectively. Results analyzed in this study show the environmental effect of the smart grid station. In addition, the results can be further used as guidance in implementing similar projects.
Key words: Climate Change, Greenhouse Gas Emissions, Korea Electric Power Corporation (KEPCO), Photovoltaic Power System (PV), Energy Storage System (ESS)
†
Corresponding author: [email protected]
Received August 12, 2016 / Revised August 29, 2016 / Accepted September 9, 2016
1. BACKGROUND
With higher awareness of the impacts of climate changes on sustainable growth of humanity, climate change has become one of the biggest global interests (Baek and Park, 2015). The increase of greenhouse gas concentration in the atmosphere due to reckless consumption of fossil fuels since industrializa- tion is one of the most important factors in climate changes caused by the human being. The carbon dioxide concentration was remained below 280 ppm prior to industrialization, but it exceeded 400 ppm in Mauna Loa, Hawaii, in May 2014 (Yue et al., 2015). The dramatic increase of carbon dioxide concentra- tion is one of the major sources of a threat to the sustainable growth of humanity caused by unusual weather conditions such
as rise in average global temperature, which in turn is leading to rise in sea levels, regional drought, heavy rains and snowfalls, etc (Baek and Park, 2015; Park and Russell, 2013). To mini- mize such problems, the international community is making great efforts to control the increment of average temperature at 2 ℃ to a level prior to industrialization (EG_Science, 2008;
Pachauri and Reisinger, 2007). In order to suppress the ave- rage temperature rise within 2 ℃, the level of carbon dioxide concentration in the atmosphere must be maintained within 450 ppm. However, as the ambient carbon dioxide concentration already exceeded 400 ppm, finding ways to control greenhouse gas emissions are very urgent (IEA, 2015).
In order to actively respond to climate changes, the inter-
national community has agreed to launching “Durban Platform”
at the COP17 (Durban, South Africa) in 2011. “Durban Plat- form” can be said to be a preparation stage for establishing a new climate system that all the countries should be directly involved in after 2020. At the COP19 (Warsaw, Poland) in 2013, the “Nationally Determined Contributions (NDCs)” to control the global average temperature within 2 ℃ compared to the level prior to industrialization was autonomously decided and was determined to be submitted at the COP21 (Paris, France) in 2015. Korea has submitted the NDC for 37% re- duction compared to 2030 Business As Usual (BAU) green- house gas emissionin June 2015.
The amount of carbon dioxide emissions accounts for 91.5
% of all greenhouse gas emissions in Korea based on 2013.
In addition, 93.8% of carbon dioxide emissions are produced by the energy sector (GIR, 2015). Such high levels of carbon dioxide emissions in the energy sector imply that Korea is still heavily dependent on fossil energy. In addition, Korea imports most of such fossil energy sources. For instance, 95.7% of the primary energy sources were imported in 2013. Since majority of fossil energy sources imported are limited to few countries, energy security is currently vulnerable in Korea. For example, 86% of total oil imports, which accounts for approximately 38
% of total energy consumption based on 2013, was imported from countries in the Middle East (KEMCO, 2014). The cost of energy imports accounts for 34.7% of all import costs of the country based on 2013, which is equivalent to $178.7 billion.
This figure is higher than the total export amount in 2013 from Korea’s main exports (ships, semiconductors, and automobiles) that amount to $142.9 billion. Therefore, reinforcement of energy security and searching for ways to reduce greenhouse gases for sustainable growth are needed in Korea.
As a part of the efforts toward sustainable growth through energy saving and reduction of greenhouse gas emissions, the Korea Electric Power Corporation is promoting the Smart Grid Station Construction Project (Kim, et al., 2015). A smart grid station refers to a control center that efficiently operates building’s use of electricity by integrating information and communications technology. The smart grid station includes components such as PhotoVoltaic power system (PV), (Power Conversion System (PCS), Energy Storage System (ESS), smart devices (outlet, lighting, panel board), Building Automation System (BAS), and Automatic Metering Infrastructure (AMI)
(Lee, et al., 2014; Rue, 2014).
The Korea Electric Power Corporation began a pilot smart grid station construction project in 2013 starting with the Namyangju Branch Office building in Guri-si, Gyeonggi-do. In 2014, a total of 29 office building smart grid stations were built at above 300 kW contract power. Based on the economic and environmental evaluation result of smart grid stations built in office buildings, the Korea Electric Power Corporation plans to fully promote the expansion of smart grid station project in the future. The purpose of this study is to provide a base data for determining the direction of future smart grid station projects through environmental assessment of smart grid stations.
2. EMISSION FACTOR ESTIMATION
The environmental aspect of photovoltaic power system and energy storage system were especially assessed among the components of smart grid stations. The environmental aspect was calculated based on the level of greenhouse gas emission reduction following construction of smart grid stations.
2.1 Annual Average Emission Factor
The emission factor from power production per fuel was calculated through the weighted-average based on the power generation quantity. Carbon dioxide had the highest proportion in volume among the greenhouse gases emitted from power production. In addition, small amounts of methane and nitrous oxide were emitted. Here, each of the methane and nitrous oxide’s global warming potential of 21 and 310 were applied to convert the unit of greenhouse gas emission factor to CO
2-eq.
The greenhouse gas emission factor used in this study is IPCC Tier 1 emission factor (IPCC, 2006). As a result of using the electric power production ratio per annual generating unit in 2014 in this study, the emission factor was found to be 0.000465 tCO
2-eq/kWh (Table 1) (KPX, 2015).
2.2 Hourly Emission Factor
Because the contribution of energy sources to electricity
generation changes with time, there are differences in emission
factors according to time as well (Fig. 1). When the variation
of generation quantity is observed hourly, the generation quan-
Table 1. Annual electricity generation of each source of energy in 2014 (KPX, 2015)
Nuclear Coal LNG Oil New & renewable Total
Electricity production (GWh) 149,199 197,223 116,285 7,596 21,533 491,836
Ratio (%) 30 40 24 2 4 100
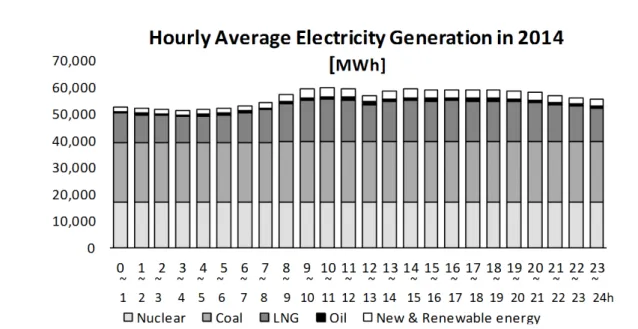
Fig. 1. Hourly average electricity generation of each source of energy in 2014 (KPX, 2015).
tity was found to be relatively high from 8 am to 9 pm. In addition, the reduction of generation quantity during the lunch hour from 12 pm to 1pm was clearly shown. In terms of hourly generation quantity per fuel, there weren’t any significant va- riations in the case of nuclear power generation and coal-fired power generation. The fuel with the highest hourly variation was LNG. Although the hourly variation of renewable energies are clearly visible, it was not significant in terms of entire generation quantity because the generation quantity of renewable energies were small compared to other energy sources.
The hourly power generation ratio per fuel source clearly showed the hourly variation of LNG (Fig. 2). Due to such variations, the emission factor according to power generation also showed differences per hour (Fig. 3). It showed the emi- ssion factor was the highest during 12 pm and 1pm when the LNG generation ratio, which has low greenhouse gas emission quantity compared to coal-fired power generation, was relati- vely low. In addition, emission factor was found to be the lowest during 11 am to 12 pm when the LNG generation ratio
is the highest.
3. ENVIRONMENTAL ASSESSMENT OF KOREA ELECTRIC POWER CORPORATION OFFICE BUILDING SMART GRID STATION
PILOT PROJECT
3.1 Smart Grid Construction Status
Smart grid stations were constructed through four different types (over 1,000 kW, 700∼1,000 kW, 500∼700 kW, and 300
∼500 kW) according to the contract power of Korea Electric
Power Corporation office buildings (Table 2). The number of
office buildings implemented with smart grid station per con-
tract power in 2014 corresponds to nine for above 1,000 kW,
four for 700∼1,000 kW, five for 500∼700 kW, and 11 for
300∼500 kW. Photovoltaic power system (PV) and energy
storage system (ESS) capacities were separately set according
to contract power. Greenhouse gas emission quantity caused
Fig. 2. Hourly average electricity generation ratio of each source of energy in 2014 (KPX, 2015).
Fig. 3. Hourly emission factors of each kWh of electricity generation in 2014 (KPX, 2015).
by power generation per office building was calculated based on the annual average power consumption standard (Table 2).
3.2 Greenhouse Gas Reduction by Photovoltaic Power System
Reduction of greenhouse gas emission through implemen- tation of PV was calculated based on generation quantity of PV. Here, the greenhouse gas emission during power generation by PV was assumed to be zero. The generation quantity of PV was calculated by multiplying the PV capacity and annual
hours of sunshine. Therefore, the most important factor in de- termining the power production quantity of PV is the hours of sunshine.
The annual average hours of sunshine during the 20 years
from 1988 to 2007 was 1,885∼2,123 hours depending on the
region (KMA, 2008). When this is converted to daily average
value, it is approximately 5.2∼6.3 hours. In addition to hours
of sunshine, PV efficiency is also another important factor that
determines power production quantity (Lee, 2011). The effici-
ency of PV is known to be approximately 0.64∼0.72 due to
Table 2. Annual greenhouse gas emissions due to electricity generation
Contract demand Over 1,000 kW 700 ∼1,000 kW 500 ∼700 kW 300 ∼500 kW (A) Number of office buildings in which smart grid
stationis installed in 2014 9 4 5 11
(B) Annual average electric usage of each building
[Unit: kWh] 1,704,204 1,206,441 489,307 261,459
(C) Greenhouse gas emission reduction due to electricity
generation (B× 0.000465) [Unit: tCO
2-eq] 792.5 561.0 227.5 121.6
PV
Capacity [kW] 100 40 30 20
Cost [million KRW] 207.0 89.8 67.0 51.0
ESS
Capacity [kWh] 200 100 80 50
Cost [million KRW] 120.0 60.0 48.0 30.0
Fig. 4. Annual average greenhouse gas emissions of each building [tCO
2-eq] and greenhouse gas emission reduc- tion ratio [%] due to PV installation (illustrated inside the parenthesis on the figure).
changes in the direction and altitude of incident light, concen- tration of fine dusts in the atmosphere and clouds, and changes in weather conditions such as temperature. Therefore, with the application of such efficiency factors to hours of sunshine, the possible hours of sunshine is 3.3∼4.5 hours. In this study, the power generation time of PV was assumed to be on average 3.5 hours per day.
From the result of applying the emission factor of 0.000465 tCO
2-eq/kWh calculated by using electric power production ratio per generating unit in 2014, the annual greenhouse gas reduction rate per size of Korea Electric Power Corporation offi ce buildings in 2014 were 59 tCO
2-eq (over 1,000 kW), 24
tCO
2-eq (700∼1,000 kW), 18 tCO
2-eq (500∼700 kW), and 12 tCO
2-eq (300∼500 kW), respectively (Table 3). This corre- sponds to 7.5% (over 1,000 kW), 4.2% (700∼1,000 kW), 7.8%
(500∼700 kW), and 9.8% (300∼500 kW) of greenhouse gas emission quantity from power generation per office building (Fig. 4).
Economic aspect of PV implementation can be evaluated
from multiple perspectives. For example, the reduction in
electricity bill for consumers from installation of PV can be
converted to economy. Also, reduction of purchasing electricity
from reduction in electricity usage can be converted to eco-
nomy. As such, economic aspect can be assessed in various
Table 3. Greenhouse gas emission reduction through PV
Contract demand Over 1,000 kW 700 ∼1,000 kW 500∼700 kW 300∼500 kW (A) Annual average greenhouse gas emissions of each building
due to electricity generation [Unit:tCO
2-eq] 792.5 561.0 227.5 121.6
(B) PV capacity [Unit: kW]
*100.0 40.0 30.0 20.0
(C) Greenhouse gas emission reduction through PV
(B×3.5 h/d×365 d/y×0.000465) [Unit: tCO
2-eq] 59.4 23.8 17.8 11.9
(D) Reduction ratio (C/A) [Unit: %] 7.5 4.2 7.8 9.8
(E) PV installation cost [Unit: million KRW]
1)*207.0 89.8 67.0 51.0
(F) Economic effect of PV (C× 12,000 KRW)
[Unit: thousand KRW]
1)713 285 214 143
1)
1,000 KRW = 0.89 USD (February 1, 2016).
*
Values in Table 2 are represented again to assist readers to understand related calculations in Table 3.
ways. In order to convert greenhouse gas reduction amount into economy in this study, the greenhouse gas emission tra- ding price of Korea Exchange that has been implemented since 2015 was used. The emission trading price based on Oct. 8, 2015 was 12,050 KRW (Chae and Park, 2016; Lee, 2011). In this study, one ton of greenhouse gas was converted to 12,000 KRW. The estimated greenhouse gas reduction and PV ins- tallation cost were compared (Table 3).
As a result, greenhouse gas reduction effect per 1 million KRW PV installation cost was found to be approximately 3.36 thousand KRW (Fig. 5). This result shows the economy in comparison to the cost in the year of PV installation. Of course, the economy compared to cost increases depending on the duration when considering the fact that PV can be maintained for decades without significant costs after the installation (Lee, 2011). To accurately understand the effects of PV in the future, it is necessary to perform comprehensive evaluations that con- sider the impacts in various areas such as response to climate changes through national greenhouse gas reduction.
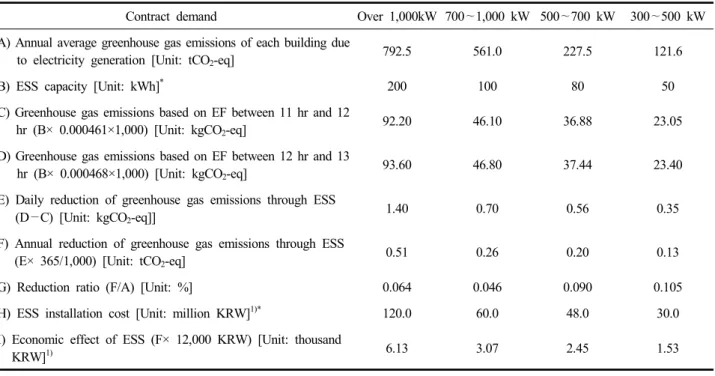
3.3 Greenhouse Gas Reduction by Energy Storage System
The energy storage system (ESS) can store electricity and supply it when needed, that is, it is one of the useful media that can respond to fluctuations in power demand. In this study, the greenhouse gas emission reduction was analyzed for the case where the power stored in ESS, which was generated
Fig. 5. Greenhouse gas emissions reduction translated in cost [Thousand KRW] vs. PV installation cost [Million KRW].
during hours with relatively low emission factor, was used as power supply during hours when emission factor was relati- vely high. The lowest hour of emission factor in a day was from 11 am to 12 pm with the emission factor of 0.000461 tCO
2-eq/kWh (Fig. 3). The highest hour of emission factor in a day was from 12 am to 1 am with the emission factor of 0.000468 tCO
2-eq/kWh (Fig. 3). The difference of greenhouse gas emissions is calculated assuming that the amount of elec- tricity stored in ESS is the same with the capacity of ESS (Table 4).
As such, the annual greenhouse gas reduction quantity per
size of Korea Electric Power Corporation office building in
Table 4. Greenhouse gas emission reduction through ESS
Contract demand Over 1,000kW 700 ∼1,000 kW 500∼700 kW 300∼500 kW
(A) Annual average greenhouse gas emissions of each building due
to electricity generation [Unit: tCO
2-eq] 792.5 561.0 227.5 121.6
(B) ESS capacity [Unit: kWh]
*200 100 80 50
(C) Greenhouse gas emissions based on EF between 11 hr and 12
hr (B× 0.000461×1,000) [Unit: kgCO
2-eq] 92.20 46.10 36.88 23.05
(D) Greenhouse gas emissions based on EF between 12 hr and 13
hr (B× 0.000468×1,000) [Unit: kgCO
2-eq] 93.60 46.80 37.44 23.40
(E) Daily reduction of greenhouse gas emissions through ESS
(D —C) [Unit: kgCO
2-eq]] 1.40 0.70 0.56 0.35
(F) Annual reduction of greenhouse gas emissions through ESS
(E× 365/1,000) [Unit: tCO
2-eq] 0.51 0.26 0.20 0.13
(G) Reduction ratio (F/A) [Unit: %] 0.064 0.046 0.090 0.105
(H) ESS installation cost [Unit: million KRW]
1)*120.0 60.0 48.0 30.0
(I) Economic effect of ESS (F× 12,000 KRW) [Unit: thousand
KRW]
1)6.13 3.07 2.45 1.53
1)
1,000 KRW = 0.89 USD (February 1, 2016).
*
Values in Table 2 are represented again to assist readers to understand related calculations in Table 4.
Fig. 6. Annual average greenhouse gas emissions of each building [tCO
2-eq] and greenhouse gas emission reduc- tion ratio [%] due to ESS installation (illustrated inside the parenthesis on the figure).
2014 was 0.51 tCO
2-eq (over 1,000 kW), 0.26 tCO
2-eq (700 ∼ 1,000 kW), 0.2 tCO
2-eq (500 ∼700 kW), and 0.13 tCO
2-eq (300
∼500 kW), respectively. This corresponds to 0.064% (over 1,000 kW), 0.046% (700 ∼1,000 kW), 0.090% (500∼700 kW), and 0.105% (300 ∼500 kW) of greenhouse gas emission quan-
tity from power generation per off ice building (Fig. 6).
The environmental aspect of ESS analyzed through such
method was converted to economy. For the conversion method,
the same method used in economic analysis of PV was used,
which was the application of 12,000 KRW per 1 tCO
2-eq. The
converted economic figure was compared with ESS installation cost. As a result, greenhouse gas reduction effect per 1 million KRW ESS installation cost was found to be approximately 0.052 thousand KRW (Fig. 7). In this study, ESS efficiency was assumed to be 100%, and if the case where ESS efficiency is not 100% is considered, environmental benefit from ESS using the difference in hourly emission factor was found to be al- most non-existent.
4. GREENHOUSE GAS REDUCTION BY PHOTOVOLTAIC POWER SYSTEM IN
RESIDENTIAL AREAS
Up until this point, environmental aspects of photovoltaic power system (PV) installed in Korea Electric Power Corpora- tion office buildings as a pilot project was analyzed. In this section, the environmental aspect on the extended application of PV in residential areas was estimated.
4.1 Greenhouse Gas Emission Status from Power Use in Residential Areas
The total amount of greenhouse gas emissions in Korea by 2016 was estimated at 722.0 million tCO
2-eq. From this figure, the greenhouse gas emissions from power use in residential areas is estimated at 35.5 million tCO
2-eq, which is about 5%
of total greenhouse gas emissions (Fig. 8). Therefore, reduc-
Fig. 7. Greenhouse gas emissions reduction translated in cost [KRW] vs. ESS installation cost [Million KRW].
Fig. 8. Greenhouse gas emissions expected in 2016.
tion of power usage in residential areas has a significant impact in achieving the goal of national greenhouse gas emission reduction.
The total greenhouse gas emissions in 2016 was estimated by applying the average annual increase rate of 2.03% to the 2013 emission quantity of 679.8 million tCO
2-eq (ME, 2015).
The greenhouse gas emission quantity from power usage in residential areas in 2016 was estimated based on the total number of housing in 2016. The total number of housing in 2016 was estimated to be 18,150,095 by using the number of housing in 2010 and the predicted number of housing in 2035 (KOSIS, 2016). Here, when the power consumption per hou- sing area and distribution of number of housing are applied, the power consumption in residential areas in 2016 was found to be 76,344 GWh (Fig. 9 and Table 5) (KOSIS, 2016; Statis- tics-Korea, 2012). When this figure applied with the emission
>132 m
2:3.6%
99 ∼132 m
2:23.6%
<33 m
2:4.7%
Fig. 9. Distribution of house lot area in Korea (KOSIS,
2016).
Table 5. Annual electricity usage of households in 2016
Lot area (m
2) Less than 33 33 ∼66 66 ∼99 99 ∼132 Over 132 Total
Number of houses
1)853,054 4,483,073 7,877,141 4,283,422 653,403 18,150,095
Annual average electricity usage
of each house (kWh)
2)2,947 3,247 4,031 5,213 7,945 NA
Annual electric usage (GWh)
3)2,514 14,557 31,753 22,329 5,191 76,344
1)
[Total Number of houses (18,150,095)] × [Distribution of lot area in Fig. 9].
2)
Statistics-Korea, 2012.
3)
[Number of houses]
2)× [Annual average electricity usage]
3).
factor of 0.000465 tCO
2-eq/kWh that was calculated based on electric power production ratio per annual average generating unit in 2014, the greenhouse gas emission quantity from power usage in residential areas in 2016 was 35.5 million tCO
2-eq.
Due to differences in electric power production ratio per yearly generating unit, the emission factor also shows diffe- rence depending on the year. Therefore, in order to accurately estimate greenhouse gas emissions, it is advisable to apply each yearly emission factor. However, because the yearly emission factors of 2014 and 2016 do not show a large difference in Korea and because they don’t have a significant influence in this study, the emission factor of 2014 was used to estimate the greenhouse gas emission quantity in 2016.
4.2 Greenhouse Gas Reduction by Supply of Photovoltaic Power System
In this study, the environmental aspect of PV being supplied to all housing in 2016 was analyzed. By referencing the PV capacity supported by mini photovoltaic power generator pro- ject in Seoul City, the PV capacity in the residential areas were assumed to be 200W and 500W in this study (City-of-Seoul, 2016). The mini photovoltaic power generator project in Seoul City is a project that provides aid on partial expense of PV installation by Seoul City, and the PV capacity targeted for aid is diverse from 200 W to 500 W. Although there are housings that have already installed PV in the past, the environment aspect in this study was analyzed on the assumption that 200 W or 500 W PVs were equally supplied to all housings, regard- less of existing installation.
Under the assumption that PV’s average generating time is 3.5 hours per day, the annual power production quantity of PV
per housing is 255.5 kWh/year and 638.8 kWh/year for PV capacities of 200 W and 500 W, respectively. Here, with the application of estimated number of housing in 2016, which is 18,150,095, the power production quantity from PV per PV capacity is 4,637 GWh/year (PV capacity: 200W) and 1,1593 GWh/year (PV capacity: 500W). Therefore, through the ins- tallation of 200W and 500W PVs, the greenhouse gas emission quantity can be reduced by 2.2 million tCO
2-eq and 5.4 million tCO
2-eq, respectively. These figures correspond to approxima- tely 6% and 15% of 35.5 million tCO
2-eq of greenhouse gas emission quantity from residential areas in 2016, respectively.
4.3 Reduction of Consumer Electricity Cost by Supply of Photovoltaic Power System
Electricity cost reduction effect from PV was also analyzed in this study. Electricity cost was calculated by using monthly average power usage per housing area and electricity bill provided by the Korea Electric Power Corporation (Table 6) (KEPCO, 2016). Depending on the housing area, the monthly electricity cost reduction by installation of 200 W PV was found to be approximately 3,900 KRW (under 66 m
2), 5,000 KRW (66∼99 m
2), 8,900 (99∼132 m
2), and 14,000 (over 132 m
2) (Table 7). And the monthly electricity cost reduction by installation of 200 WPV per housing area was found to be app- roximately 10,000 KRW (under 66 m
2), 15,500 KRW (66∼99 m
2), 23,000 (99∼132 m
2), and 37,800 (over 132 m
2) (Table 7).
The reason behind the difference in electricity cost reduction
according to housing areas despite the installation of the same
capacity PV is because progressive stage system that provides
savings depending on the electricity usage is applied. Therefore,
homes that use large amount of electricity can have higher
Table 7. Electricity cost before and after installing PV in households in 2016
Lot area (m
2) Less than 33 33 ∼66 66 ∼99 99 ∼132 Over 132
Monthly electricity usage [kWh]
PV: Not installed
1)246 271 335 434 662
PV capacity: 200 W
1)225 250 315 413 641
PV capacity: 500 W
1)193 218 283 381 609
Monthly electricity cost [KRW]
3)PV: Not installed 28,903 33,601 51,402 87,012 235,159
PV capacity: 200 W 24,958 29,655 45,509 78,204 220,260
PV capacity: 500 W 18,689 23,642 35,856 64,029 197,556
Reduction in monthly electric cost [KRW]
PV capacity: 200 W 3,945 3,946 5,893 8,808 14,899
PV capacity: 500 W 10,214 9,959 15,546 22,983 37,603
Reduction in annual electric cost [KRW]
PV capacity: 200 W 47,340 47,352 70,716 105,696 178,788
PV capacity: 500 W 122,568 119,508 186,552 275,796 451,236
1)
Statistics-Korea, 2012.
2)
[Electricity usage]
1)minus [Electricity production by PV].
3)


![Fig. 5. Greenhouse gas emissions reduction translated in cost [Thousand KRW] vs](https://thumb-ap.123doks.com/thumbv2/123dokinfo/5283617.640510/6.892.89.814.778.1015/fig-greenhouse-emissions-reduction-translated-cost-thousand-krw.webp)
![Fig. 7. Greenhouse gas emissions reduction translated in cost [KRW] vs. ESS installation cost [Million KRW].](https://thumb-ap.123doks.com/thumbv2/123dokinfo/5283617.640510/8.892.458.810.135.337/fig-greenhouse-emissions-reduction-translated-cost-installation-million.webp)

