* Corresponding author : BaeHun Lee, College of Animal Life Sciences, Kangwon National University, Chuncheon, 24341, Korea, Tel: +82-33-250-8635, Fax: +82-33-242-4540 , E-mail: [email protected]
Research Article
The carryover effects of high forage diet in bred heifers on feed intake, feed efficiency and milk production of primiparous lactating Holstein cows
Befekadu Chemere, Bae Hun Lee*, Jalil Ghassemi Nejad, Byong Wan Kim, Kyung Il Sung College of Animal Life Sciences, Kangwon National University, Chuncheon, 24341, Korea
ABSTRACT
This study was designed to investigate the carryover effects of high-forage to concentrate (F: C) diet in bred heifers on feed intake, feed efficiency (FE) and milk production of primiparous lactating Holstein cows. The experiment was conducted for 589 days (d) from onset of pregnancy through to the end of first lactation. Twenty-four bred heifers (Body weight: BW= 345.8 ± 45.4 kg and 15
± 1.2 mon of age) randomly assigned to two groups of 3 pens containing 4 heifers each and fed high forage (HF) diet with F: C ratio of 91.7: 8.3% and low forage (LF) diet with F: C ratio of 77.8: 22.2% throughout the pregnancy period. After calving, lactating cows were fed total mixed ration (TMR) based diet. No differences (p > 0.05) were observed in dry matter intake (DMI) of bred heifers and primiparous lactating cows in both HF and LF groups. The FE of mid-to-late lactation period was higher (p< 0.05) in HF than LF group. However, the HF group showed higher (p < 0.05) milk yield, 4 % fat corrected milk (FCM) and energy corrected milk (ECM) than LF group during the 305 d lactation. The LF group showed higher (p < 0.05) milk fat, crude protein (CP), milk urea nitrogen (MUN), solid not fat (SNF) and somatic cell count (SCC) than HF group. It is concluded that restriction of F: C ratio to 91.7: 8.3% to bred heifers has the potential carryover effects to maintain higher milk yield and FE with no adverse effect on feed intake and milk composition of primiparous lactating Holstein cows.
(Key words : Primiparous cows, Milk production, First lactation, High forage diet, Low forage diet)
Ⅰ. INTRODUCTION
Raising dairy heifers is pivotal for farm management and can be characterized as a long-duration, high-cost period that creates a lag in capturing a return on investment (Heinrichs, 1993). The management decisions that are made during the rearing period affect both future productivity (Sejrsen et al., 2000; Zanton and Heinrichs, 2005) and the time until lactation commences (Hoffman et al., 1996; Ettema and Santos, 2004).
A good heifer rearing program is critical to produce animals at first calving that have well-developed mammary glands, good body size, and body condition that is capable of high feed intake and delivery of nutrients to the mammary gland (VandeHaar, 2001). Several experiments that offered dairy heifers high-concentrate (HC) diets for ad libitum consumption have led to reduced milk production at their first-lactation period (Swanson, 1960; Radcliff et al., 2000). Other researchers (Hof and Lenaers, 1984; Carson et al., 2000) have demonstrated that if HC diets are restricted so that average daily gain (ADG) is comparable to a high forage (HF) diet,
whereas mammary development and first-lactation milk productions do not differ between groups. A report by Lee et al. (2013) indicated no significant differences in milk yield and feed intake of Holstein cows fed high or low forage diets across a wide range of management. Furthermore, research conducted in our laboratory showed that feeding HF diet to Holstein lactating cows is beneficial to reduce stress levels by reduction of cortisol hormone in blood and hair (Ghassemi Nejad et al., 2014).
Feed efficiency (FE) can be defined as kilograms of fat corrected or energy corrected milk (ECM) produced per kg of dry matter intake (DMI) consumed (Hutjens, 2005). The
“traditional focus” was that as cows consumed more feed to support higher milk production, the proportion of digested nutrients captured as milk is proportionally higher (Hutjens, 2010). Furthermore, monitoring FE in the dairy industry has not been used as a common benchmark for monitoring profitability and evaluating dry matter intake relative to milk yield. Thus, the carryover effect of HF diet on FE of primiparous cows needs an accurate measurement of dry
Table 1. Ingredients and chemical composition of HF and LF diets fed to Holstein bred heifers
Items (% DM) HF LF
Forage BIRG silage 56.8 47.6
Timothy hay - 6.4
Rice straw 34.9 23.8
Concentrate Formula feed 8.3 22.2
Chemical composition (% DM)
DM 37.5 58.81
Ash 20 14.5
OM 80 85.5
CP 7.7 11.1
EE 1.9 2.6
CF 32.5 24.6
NDF 68.6 56.1
ADF 45.7 36
NFE 39.8 49.8
TDN 52.8 60.5
NEL, Mcal/kg 1.2 1.4
F:C(%) 91.7 : 8.3 77.8 : 22.2
HF: High forage, LF: Low forage, F: C: Forage to concentrate ratio, BIRG: Whole crop barely with Italian ryegrass, DM: Dry matter, OM:
Organic matter, CP: Crude protein, CF: Crude fiber, NDF: Neutral detergent fiber, ADF: Acid detergent fiber, NFE: Nitrogen free extract, TDN: Total digestible nutrient, NEL: Net energy for lactation.
matter intake (DMI). In this regard, given the example of fat corrected milk (FCM) for standardization of milk fat, ECM can be used as a factor to discuss FE.
To date, due to the length of period required, few studies have monitored heifers through the rearing period or have investigated the carry over effect of high forage diet on performance of primiparous lactating cows from onset of pregnancy until the end of first lactation. Therefore, the current study was initiated to elucidate the carryover effects of feeding HF diet in bred heifers on feed intake, FE and milk production of primiparous lactating Holstein cows.
Ⅱ. MATERIAL AND METHODS 1. Experimental design, diets, and management
The procedure used in this experiment was in accordance with the animal care and use policy of Kangwon National University, Republic of Korea. The experiment was conducted in privately owned dairy farm located at Naju city, Jeollanam province for the total of 589 days (d) from January 2012 to
December 2013. Twenty-four bred heifers (ave. BW = 345.8
± 45.4 kg and 15 ± 1.2 mon of age) were randomly assigned equally to one of the two dietary treatments managed in three pens containing 4 heifers each. The dietary treatments (Table 1) were high forage (HF) diet formulated to contain 91.7%
forage and 8.3% concentrate and low forage (LF) diet was formulated to contain 77.8% forage and 22.2% concentrate, were provided throughout pregnancy period. The treatment diets were formulated on a quantity basis to meet NRC (2001) nutrient recommendations for Holstein bred heifers. At calving, heifers were 24 ± 0.6 mon of age. After calving, lactating primiparous cows were fed two different total mixed ration (TMR, Table 2) with relatively proportional F: C ratio (55.7:
44.3 to HF group and 48.1: 51.9 to LF group) until the end of first lactation period (Age: 34 ± 1.6 mon). Mineral bricks and water offered ad libitum throughout the experiment duration.
2. Measurements and analysis
Feed offered and the refusals were recorded daily to calculate the dry matter intake (DMI) of the dietary treatments.
Feed samples were dried for 72 hours at 65oc drying oven and
Table 2. Ingredients and chemical composition of TMR diet fed to primiparous Holstein cows
Items (% DM) HF LF
Forage
BIRG silage 26.4 24.2
Mixed hay 19.9 23.9
Straw (Tall fescue and ryegrass) 9.4 -
Concentrate
Beet pulp 3.4 -
Whole cottonseed 4.5 9.7
Corn flour 3.1 -
Energy feed 21.2 6.0
Formula feed 12.1 36.2
Chemical compositions (% of DM)
DM 65.9 66.0
Ash 10.5 8.5
OM 89.5 91.5
CP 16.0 15.7
EE 3.9 3.7
CF 17.4 16.2
NDF 51.0 46.4
ADF 27.1 25.4
NFE 55.6 52.5
TDN 66.9 65.5
NEL Mcal/kg 1.48 1.52
F: C (%) 55.7: 44.3 48.1:51.9
HF: High forage, LF: Low forage, F: C: Forage to concentrate ratio, BIRG: Whole crop barely with Italian ryegrass, DM: Dry matter, OM:
Organic matter, CP: Crude protein, CF: Crude fiber, NDF: Neutral detergent fiber, ADF: Acid detergent fiber, NFE: Nitrogen free extract, TDN: Total digestible nutrient, NEL: Net energy for lactation.
grounded to pass in 0.75 mm sieve prior to analysis. Ash, crude fiber (CF), crude protein (CP) and crude fat (CF) were analyzed according to the method of AOAC (1990). Neutral detergent fiber (NDF) and acid detergent fiber (ADF) were analyzed according to the method described by Goering and Van Soest (1970). Calculations of energy intakes and total digestible nutrient (TDN) were performed according to NRC (2001). Daily milk yield was recorded during the whole period of the first lactation and characteristic of milk composition was analyzed by automatic milk analyzer (Automatic IR 4000/5000 Milk Analyzer, Foss Electric) for fat, protein, solid not fat (SNF), milk urea nitrogen (MUN), and somatic cell count (SCC). The feed efficiency (FE) of primiparous cows in each phase of first lactation period was calculated from DMI and energy corrected milk (ECM) according to Hutjens (2005):
ECM = (12.82 × fat lbs) + (7.13 × protein lbs) + (0.323 ×
milk lbs). The data were subjected to analysis of variance using SPSS statistical software version 22.0 for Windows. The means which showed significant differences at the probability level of p < 0.05 were compared with each other by using LSD. P values between 0.05 < p < 0.10 were considered as tendencies to be significant.
Ⅲ. RESULTS AND DISCUSSION 1. Feed intake
The effect of high forage (HF) and low forage (LF) diet on the feed intake of bred heifers and primiparous lactating cows presented (Table 3). No significant difference (p > 0.05) was observed in total dry matter intake (DMI) between HF and LF
Table 3. Dry matter and nutrient intake (Mean ± SD) of cows during pregnancy and lactation period
Group PP LP
HF LF HF LF
DM (kg d-1) 9.9 ± 2.3a 10.8 ± 3.8a 20.1 ± 2.3a 20.1 ± 0.2a
CP (kg d-1) 1.3 ± 0.45b 1.5 ± 2.3a 3.2 ± 0.1a 3.2 ± 0.1a
ME (Mcal kg-1) 2.2 ± 0.03a 2.4 ± 0.01a 2.5 ± 0.02a 2.4 ± 0.01a
NEm (Mcal kg-1) 1.4 ± 0.001a 1.5 ± 0.01a 1.5 ± 0.002a 1.5 ± 0.001a NEg (Mcal kg-1) 0.9 ± 0.0003b 1.1 ± 0.0001a 1.0 ± 0.001a 1.0 ± 0.00a
TDN (kg d-1) 6.3 ± 2.4b 6.7 ± 0.45a 13.2 ± 0.4a 13.1 ± 0.1a
NEL (Mcal kg-1) 1.4 ± 0.01a 1.5 ± 0.01a 1.5 ± 0.005a 1.5 ± 0.008a
PP: Pregnancy period, LP: lactation period, ME: Metabolizable energy; NEm: Net energy for maintenance; NEg: Net energy for gain; TDN:
Total digestible nutrient, NEL: Net energy for lactation. Means in the same period in row without common superscript are significantly different at p < 0.05.
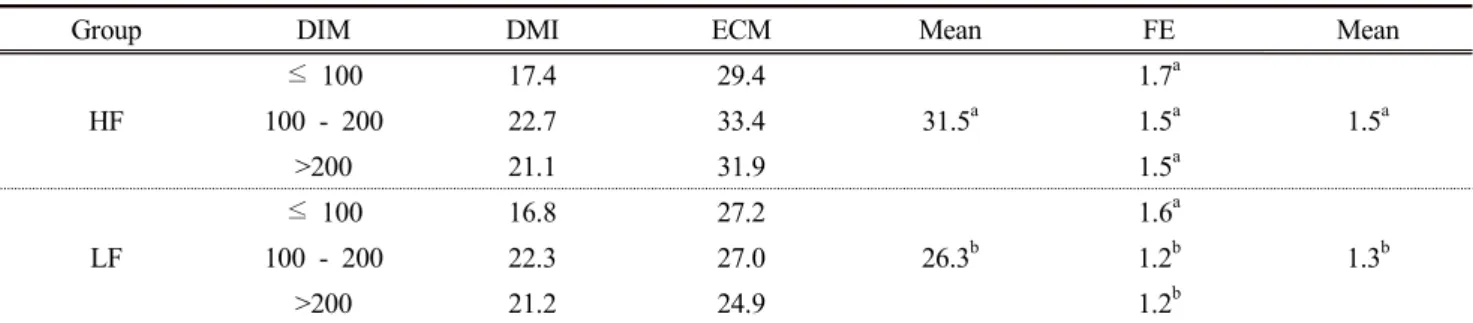
Table 4. Feed efficiency of HF and LF groups based on stage of lactation
Group DIM DMI ECM Mean FE Mean
HF
≤ 100 17.4 29.4
31.5a
1.7a
1.5a
100 - 200 22.7 33.4 1.5a
>200 21.1 31.9 1.5a
LF
≤ 100 16.8 27.2
26.3b
1.6a
1.3b
100 - 200 22.3 27.0 1.2b
>200 21.2 24.9 1.2b
HF: High forage, LF: low forage, DMI: dry matter intake, DIM: days in milk, ECM: energy corrected milk, FE: feed efficiency, means of HF vs LF means without common superscript letter in the same column indicates significant differences at p < 0.05.
groups during pregnancy as well as first lactation period. This could indicate that Holstein bred heifers fed diet forage to concentrate (F: C) ratio of 91.7: 8.3 and 77.8: 22.2 has no impact on DMI of bred heifers and primiparous lactating cows.
Several researches reported that DMI potential of first lactation cows that had received HF or LF diet for rearing period was not different in dairy cows (Hof and Lenaers, 1984) and Korean native steers (Lee et al., 2016; Sung et al ., 2015).
Similarly, Aguerre et al. (2011) also reported that increasing F:
C ratios (47:53, 54:46, 61:39, and 68:32) in the diet had no effect on DMI potential of Holstein cows. In contrast, Zanton and Heinrichs (2007b) reported less DMI by the heifers fed LF than HF diets. In bred heifers, higher total digestible nutrient (TDN) was observed in LF than HF category. The crude protein (CP) intake of LF groups was slightly higher than HF groups during pregnancy. This could be due to the relatively higher plane of nutrition in the LF than HF group.
A significant (p < 0.05) increase in DMI of both groups of primiparous lactating cows observed at the end of first lactation.
This could be considered due to the physically effective fiber fed during pregnancy period. Tozer and Heinrichs (2001) reported that cows in their first lactation must have a large digestive capacity to achieve high DMI to be considered heifer management successful. The higher DMI is an indication of minimized negative energy balance of cows at first lactation and increased immune response (Moyes et al., 2009).
2. Feed efficiency
Higher feed efficiency (FE) was observed in early lactation in both HF and LF groups(Table 4). However, improved FE was observed in the HF than LF group during mid-to late-lactation period. This could be due to the carryover effect of HF diet received by bred heifers by which the incidence of negative energy balance avoided through proper amount of physically effective forage diet provided. The FE of HF group tended to be higher (p = 0.07) than LF group at the end of first lactation. FE reported to vary from 1.0 to nearly 2.0 during
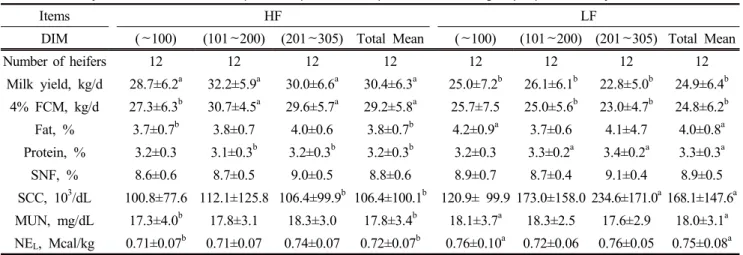
Table 5. Milk yield and chemical composition (Mean ± SD) of HF and LF groups per 305-days lactation
Items HF LF
DIM (∼100) (101∼200) (201∼305) Total Mean (∼100) (101∼200) (201∼305) Total Mean
Number of heifers 12 12 12 12 12 12 12 12
Milk yield, kg/d 28.7±6.2a 32.2±5.9a 30.0±6.6a 30.4±6.3a 25.0±7.2b 26.1±6.1b 22.8±5.0b 24.9±6.4b 4% FCM, kg/d 27.3±6.3b 30.7±4.5a 29.6±5.7a 29.2±5.8a 25.7±7.5 25.0±5.6b 23.0±4.7b 24.8±6.2b
Fat, % 3.7±0.7b 3.8±0.7 4.0±0.6 3.8±0.7b 4.2±0.9a 3.7±0.6 4.1±4.7 4.0±0.8a
Protein, % 3.2±0.3 3.1±0.3b 3.2±0.3b 3.2±0.3b 3.2±0.3 3.3±0.2a 3.4±0.2a 3.3±0.3a
SNF, % 8.6±0.6 8.7±0.5 9.0±0.5 8.8±0.6 8.9±0.7 8.7±0.4 9.1±0.4 8.9±0.5
SCC, 103/dL 100.8±77.6 112.1±125.8 106.4±99.9b 106.4±100.1b 120.9± 99.9 173.0±158.0 234.6±171.0a168.1±147.6a MUN, mg/dL 17.3±4.0b 17.8±3.1 18.3±3.0 17.8±3.4b 18.1±3.7a 18.3±2.5 17.6±2.9 18.0±3.1a NEL, Mcal/kg 0.71±0.07b 0.71±0.07 0.74±0.07 0.72±0.07b 0.76±0.10a 0.72±0.06 0.76±0.05 0.75±0.08a 4% FCM: Fat corrected milk, SNF: Solid not fat, SCC: Somatic cell count, MUN: Milk Urea Nitrogen, NEL: Net Energy lactation, DIM:
Days in milk, within a row means without a common superscript letter are significantly different at P < 0.05.
the lactation of a cow or across farms (Linn et al., 2007).
Martinez et al. (2009) reported higher FE in early lactation cows fed HF diet as compared to LF diet. In contrast, Gadeken and Casper (2017) reported no significant difference in FE of mid-to late-lactation cows fed 80% and 60% forage in the diet.
It is true that late lactation cows will have much lower FE in comparison to early lactation cows because of converting DMI to body weight and body condition gain. The lower FE in LF group could be due to increased proportion of energy being allocated to maintenance. Energy corrected milk (ECM) was higher (p < 0.05) in the HF than LF group, indicating that lactating cows in the HF group consumed the same energy as the LF group to produce higher milk energy. Higher quality forage fed to bred heifers may explain why the HF group showed higher ECM than the LF group during lactation.
3. Milk production
HF fed group appeared to show higher milk yield (Table 5) in the first lactation (ave. 30.4 ± 6.3 kg) as compared to LF fed group (ave. 24.9 ± 6.4 kg). Higher (p < 0.05) 4% fat corrected milk (FCM) was observed in the HF (29.2 ± 5.8 kg) than the LF (24.8 ± 6.2 kg) group during 305 d of lactation.
Despite the fact that similar feed intake in both groups at lactation, the difference in milk yield and 4 % FCM could be due to higher feed conversion efficiency detected in HF than in LF group. This result is in agreement with the report of Swanson (1960) and Radcliff et al. (2000) who have offered
dairy heifers HC diets for ad libitum consumption and restricted forage diet. They reported reduced milk yield at first lactation. Lacasse et al. (1993) and Grummer et al. (1995) also reported that high plane of nutrition during pregnancy period had shown not to increase milk yield in the first lactation. The higher milk production at early stage of lactation by HF group (3.7±1.0 kg) may explain the higher milk production at the end of lactation by the HF group as compared with the LF group.
Physically effective fibers relatively higher in quantity that maintain body condition of bred heifers that enable them for easier parturition could have also contributed for the higher milk yield at early lactation period in HF than LF group. This is supported by Hoffman et al. (1996) who reported that gravid heifers fed low energy; high fiber forages that effectually control energy intake and help to minimize over-conditioning at calving is detrimental to lactation performance. Also it can be suggested that the carryover effect of higher quality forage in the HF group could be another reason for the conversion of feed to milk that resulted in higher milk production. In contrast to this, Zanton and Heinrichs (2009b) reported that first lactation performance has not been altered by the variations of dietary concentrates during the rearing.
4. Milk compositions
Significant differences (p < 0.05) in milk fat and crude protein (CP) content were observed between the HF and LF groups (Table 5). The LF group showed higher (p < 0.05) fat
and protien content of milk than HF group. As milk compositions are strongly influenced by nutritional management (Fuquay, 1981), no carry over effect of F: C diet that the two groups received during pregnancy. The fat and protein values from this experiment were similar to the report of Nam et al.
(2009), who reported the regional effect on milk fat and protein content of lactating cows. Bred heifers had no record of milk and its composition. Thus, grouping lactating primiparous lactating cows based on their previous milk record is impractical. Thus, the LF group might have higher average milk fat and protein when milking started. This also could be another reason for higher fat and protein content of milk in LF than HF group. The somatic cell count (SCC) in LF (168.1±
147.6) group appeared to show higher (p < 0.05) in number than HF (106.4 ± 100.1) group. There is no concrete evidence to support for the difference in the SCC between the two groups. However, the unintended slight difference in the milking management aspect, as well as exposure to stress could led to the increase in the SCC in LF group. As stage of lactation advanced, there was an increase in SCC of the milk in the LF group without any detectable sign of mastitis in the udder. This result is in line with the report of Bielefeldt et al. (2004) and Klaas et al. (2004) who reported the increase in the tendency of SCC with advancing lactation stage.
Oltenacu and Ekesbo (1994) reported that deformations in the udder gland and increase in milk production capacity are the main reasons for elevated SCC. However, as SCC is a reflector for assessing milk quality (Moon et al., 2007), there was no sign of milk quality abnormalities observed. As the MUN is an indication of the protein intake of lactating dairy cows (Roenfeldt, 1996), significant differences (p < 0.05) were observed between HF and LF groups. Experimental studies have demonstrated that MUN concentrations are highest within a 2 to 6 h period after eating (Gustaffson and Palmquist, 1993) and also may be influenced by differences in the feeding-to-milking intervals between these two milking periods (Godden, 1998). However, this experiment showed higher MUN in LF group than HF. This could be due to the TMR based feed LF group received after calving. No difference (p
> 0.05) in SNF content between HF and LF groups. As the SNF content of milk markedly affected by the plane of energy nutrition (Rook and Line, 1961), during lactation period both
groups of heifers fed relatively proportional ratio of forage feed in their TMR diet, which may not contribute for the difference in SNF content. Zanton and Heinrichs (2010) reported that limit feeding of heifers across a wide range of management types during rearing period has no effect on milk component of heifers at the first lactation. Therefore, there is no chance of carry over effect on the SNF content of milk in both HF and LF groups. Furthermore, Kim and Kim (2017) reported similar milk composition of first parity dairy cows with our findings and they noted seasonal factors affecting the yield and composition of milk.
Ⅳ. CONCLUSION
Feeding high-forage to concentrate diet at 91.7: 8.3 to Holstein bred heifers during pregnancy has the potential to maintain higher milk production and FE; with no adverse effect on feed intake and milk composition of primiparous lactating cows.
Ⅴ. ACKNOWLEDGMENTS
This work was carried out with the support of "Cooperative Research Program for Agriculture Science & Technology Development (Project No. PJ01020901)" Rural Development Administration, Republic of Korea.
Ⅵ. REFERENCES
Aguerre, M. J., Wattiaux, M. A., Powell, J. M., Broderick, G. A., and Arndt, C. 2011. Effect of forage to-concentrate ratio in dairy cow diets on emission of methane, carbon dioxide and ammonia, lactation performance and manure excretion. Journal of Dairy Science. 94:3081-3093.
AOAC. 1990. Official methods of analysis. (15th Ed.). Association of Official Analytical Chemist International, Arlington, VA.
Bielfeldt, J. C., Badertscher, R., Tolle, K. H., and Krieter, J. 2004.
Factors influencing somatic cell score in Swiss dairy production systems. Schweizer Archiv Tierheilk de. 146:555-560.
Carson, A. F., Wylie, A. R. G., McEvoy, J. D., McCoy, M., and
Dawson, L. E. R. 2000. The effects of plane of nutrition and diet type on metabolic hormone concentrations, growth and milk production in high genetic merit dairy herd replacements. Animal Science. 70:349-362.
Ettema, J. F., and Santos, J. E. P. 2004. Impact of age at calving on lactation, reproduction, health, and income in first –parity Holsteins on commercial farms. Dairy Science. 87:2730-2742.
Fuquay, J. W. 1981. Heat stress as it affects animal production. Journal of Animal Science. 32:164-174.
Gadeken, D. L. and Casper, D. P. 2017. Evaluation of high forage total mixed ration on the locational performance of late lactation dairy cows. Translation Animal Science. 1:108-115.
Ghassemi Nejad, J., Kim, B. W., Lohakare, J., West, J., Lee, B. H., Ji, D. H., and Sung, K. I. 2014. Temperature responses in Holstein lactating cows fed with different forage: concentrate ratio under heat stress condition. 48th congress of the International Society for Applied Ethology (ISAE). Spain. P 172.
Godden, S. M. 1998. Evaluation of a milk urea assay, and the relationship between milk urea concentrations and nutritional management and performance in Ontario dairy herds. Doctoral (D.V.Sc.) thesis. University of Guelph. Guelph, ON.
Goering, H. K., and Van Soest P. J. 1970. Forage Fiber Analysis (Apparatus, Reagents, Procedures, and Some Applications). Agricultural Handbook no. 379. Agricultural Research Service-USDA, Washington, DC.
Grummer, R. R., Hoffman, P. C., Luck, M. L., and Bertics, S. J. 1995.
Effect of prepartum and postpartum dietary energy on growth and lactation of primiparous cows. Journal of Dairy Science.
78:172-180.
Gustafsson, A. H., and Palmquist, D. L. 1993. Diurnal variation of rumen ammonia, serum urea, and milk urea in dairy cows at high and low yields. Journal of Dairy Science. 76:475-484.
Heinrichs, A. J. 1993. Raising dairy replacements to meet the needs of the 21st century. Journal of Dairy Science. 76:3179-3187.
Hutjens, M. F. 2005. Dairy Efficiency and Dry Matter Intake.
Proceedings of the 7th Western Dairy Management Conference.
March 9-11. Reno, NV. 71-76.
Hof, G., and Lenaers, P. J. 1984. The importance of roughage in the rearing period on the feed-intake and performance of adult dairy-cows. Livest. Plant Production Science. 11:287-302.
Hoffman, P. C., Brehm, N. M., Price, S. G., and Prill-Adams, A. 1996.
Effect of accelerated postpubertal growth and early calving on lactation performance of primiparous Holstein heifers. Journal of Dairy Science. 79:2024-2031.
Hutjens, M. F. 2010. Benchmarking Your Feed Efficiency, Feed Costs, and Income over Feed Cost. WCDS Advances in Dairy Technology.
22:3-10.
Kim, G. W. and Kim, J. G. 2017. Changes of Milk Yield and
Compositions According to Parity, Milk Yield and Seasons in Dairy Cattle. Annals of Animal Resource Science. 28:1-8. (In Korean with English abstract).
Klaas, I. C., Enevoldsen, C., Vaarst, M. and Houe, H. 2004. Systematic clinical examinations for identification of latent udder health types in Danish dairy herds. Journal of Dairy Science. 87:1217-1228.
Lacasse, P., Block, E., Guilbault, A. L., and Petitclerc, D. 1993. Effect of plane of nutrition of dairy heifers before and during gestation on milk production, reproduction and health. Journal of Dairy Science.
76:3420-3427.
Lee, B.H., Ghassemi Nejad, J., Kim, H.S., and Sung, K.I. 2013. Effect of Forage Feeding Level on the Milk Production Characteristics of Holstein Lactating Cows. Journal of the Korean Society of Grassland and Forage Science. 33:45-51. (In Korean with English abstract).
Lee, B. H., Ghassemi Nejad, J., Kim, B.W., Ohh, S.J., and Sung, K. I.
2016. Fatty acid profile of meat, diurnal changes in volatile fatty acids, rumen fluid parameters, and growth performance in Korean native (Hanwoo) steers fed high- and low-forage diets supplemented with chromium-methionine. Revista Brasileira de Zootecnia.
45:483-488.
Linn, J., Raeth-Knight, M., Fredin, S. and Bach, A. 2007. Feed efficiency in lactating dairy cows. p.10. In: Proceedings of the Colorado Dairy Nutrition Conference, Colorado.
Martinez, C. M., Chung, Y. H., Ishler, V. A., Bailey, K. W., and Varga, G. A. 2009. Effects of dietary forage level and monensin on lactation performance, digestibility, and fecal excretion of nutrients, and efficiency of feed nitrogen utilization of Holstein dairy cows.
Journal of Dairy Science. 92:3211-3221.
Moon, J. S., Koo, H. C., Joo, Y. S., Jeon, S. H. and Hur, D. S. 2007.
Application of a new portable microscopic somatic cell counter with disposable plastic chip for milk analysis. Journal of Dairy Science.
90:2253-2259.
Moyes K. M., Drackley J. K., Salak-Johnson J. L., Morin D. E., Hope J. C., and Loor J. J. 2009. Dietary-induced negative energy balance has minimal effects on innate immunity during a streptococcus uberis mastitis challenge in dairy cows during mid-lactation. Journal of Dairy Science. 92:4301-4316.
Nam, K. T., Kim K. H., Nam S. I., Abanto. O. D., and Hwang S. G.
2009. Seasonal and Regional Effects on Milk Composition of Dairy Cows in South Korea. Journal of Animal Science and Technology.
51:537-542.
National Research Council (NRC). 2001. Subcommittee on Dairy Cattle Nutrition. Nutrient requirements of dairy cattle, (National Academy Press, Washington).
Oltenacu, P. A. and Ekesbo, I. 1994. Epidemiological study of clinical mastitis in dairy cattle. Veterinary Research. 25:208-212.
Radcliff, R. P., Vandehaar, M. J., Chapin, L. T., Pilbeam, T. E., Beede,
D. K., Stanisiewski, E. P., and Tucker, H. 2000. Effect of diet and injection of bovine somatropin on pre-pubertal growth and first-lactation milk yield of Holstein cows. Journal of Dairy Science.
83:23-29.
Roenfeldt, S. 1996. Use MUNS to monitor nutrition. Dairy herd management. Feb.26-28.
Rook, J. A. F., and Line, C. 1961.The Effect of the Plane of Energy Nutrition of the Cow on the Secretion in Milk of the Constituents of the Solid-Not-Fat Fraction and on the Concentrations of Certain Blood-Plasma Constituents. British Journal of Nutrition.
15:109-119.
Sejrsen, K., Purup, S., Vestergaard, M., and Foldager, J. 2000. High body weight gain and reduced bovine mammary growth: physiological basis and implications for milk yield potential. Domestic Animal Endocrinology. 19:93-104.
SPSS. 2013. IBM SPSS Statistics 22.0. IBM Corp., Somers, New York.
U.S.A.
Sung, K. I., Ghassemi Nejad, J., Hong, S. M., Ohh, S. J., Peng, J. L., Ji, D. H., and Kim, B. W. 2015. Effects of forage level and chromium-methionine chelate supplementation on performance, carcass characteristics and blood metabolites in Korean native (Hanwoo) steers. Journal of Animal Science and Technology.
57:14-20.
Swanson, E. W. 1960. Effect of rapid growth with fattening of dairy heifers on their lactational ability. Journal of Dairy Science.
43:377-387.
Tozer, P. R., and Heinrichs, A. J. 2001. What affects the costs of raising replacement dairy heifers: a multiple-component analysis. Journal of Dairy Science. 84:1836-1844.
VandeHaar, M. J. 2001. Accelerated Growth for Dairy Heifers: I would Rather Bet on Blackjack. Proceeding of The 5th Western Dairy Management Conference. Las Vegas, Nevada. 123-132.
Zanton, G. I., and Heinrichs, A. J. 2005a. Meta-analysis to assess effect of prepubertal average daily gain of Holstein heifers on first lactation production. Journal of Dairy Science. 88:3860-3867.
Zanton, G. I., and Heinrichs, A. J. 2007b. The effects of controlled feeding of a high-forage or high-concentrate ration on heifer growth and first-lactation milk production. Journal of Dairy Science.
90:3388-3396.
Zanton, G. I., and Heinrichs, A. J. 2009b. Review: Limit-feeding with altered forage-to-concentrate levels in dairy heifer diets. The Professional Animal Science. 25:393-403.
Zanton, G. I., and Heinrichs, A. J. 2010. Short communication: analysis of milk yield and composition for dairy heifer’s limit-fed lower forage diets during the rearing period1. Journal of Dairy Science.
93:4730-4734.
(Received : July 25, 2017 | Revised : September 2, 2017 | Accepted : September 4, 2017)