Alveolar restoration following rapid maxillary expansion with and without corticotomy: A microcomputed tomography study in sheep
11
0
0
전체 글
(2) Le et al • Alveolar restoration following RME with/without corticotomy. INTRODUCTION Maintenance of teeth in the corrected position after orthodontic treatment remains a challenge for orthodontists.1-3 Little2,3 reported a remarkably high percentage of relapse in all types of treated malocclusions over 10 to 20 years post-retention. Among cases in which either fixed or removable appliances were used to increase the arch length in mixed dentition, only 11% showed a satisfactorily enlarged arch over the follow-up period.2,3 In children younger than 13 years, the interpremolar and intermolar width could be expanded up to 7 mm or more, but this dimension reduced by 2 to 3 mm after 2 to 7 years post-retention.4 Other authors reported relapse rates of up to 63% for conventional maxillary expansion.5 In older patients, surgically assisted rapid maxillary expansion (RME) is more preferable, but the relapse rates were also higher, ranging from 5% to 25%.5 Thus, the optimal duration for which patients should wear a retainer to prevent relapse still remains to be identified.6 The instability of orthodontic outcomes is believed to originate from physiological processes and orthodontic factors.6 As teeth are orthodontically moved into a new position, the balance between teeth and surrounding tissues changes. Instability from orthodontic factors may occur due to occlusal contacts, soft tissue pressure, limits of dentition, and periodontal and gingival fibers.6 In addition, bone remodeling might play a crucial role in relative tooth stability in its new position.7 After active orthodontic treatment, retainers are used to hold the teeth in position for a certain period to facilitate bone remodeling and establish a new equilibrium between the tooth and its surrounding environment. However, the duration of the remodeling process and its adequacy in retaining teeth in their new position remain to be clarified. Although most protocols have recommended retainer usage for 6 weeks to 8 months,8-11 there is insufficient information on the time required for complete bone remodeling. Some authors have hinted that corticotomy might enhance the stability of orthodontic outcomes post-treatment.12-14 In 1959, Kole12 reported that cortical bone interfered with the movement of teeth. By performing corticotomy, the resistance of the cortical bone could be released, the tooth could be moved faster into its new position, and relapse could be prevented.12 Later, Wilcko et al.13 also showed that “periodontal accelerated osteogenic orthodontics” increased tooth stability. Chung et al.14 stated that when the corticotomized area was ossified, this corticotomized segment was impossible to return to its original position. Corticotomy has been shown to be useful in assisting maxillary expansion, especially for non-growing patients.15-17 Lines15 reported successful outcomes with. 236. a combination of buccal incisions and midpalatal suture splitting. Echchadi et al.16 showed that piezo-bone perforations on the buccal alveolar bone can correct severe maxillary transverse deficiency. Meanwhile, Le et al.17 illustrated that an adjunctive buccal and palatal corticotomy is also a potential modality. Recent advancements in microcomputed tomography (microCT) allow three-dimensional examination of the bone microstructure in detail. Nevertheless, no study has used in vivo microCT to investigate bone quality after maxillary expansion. Therefore, this study assessed the bone microstructure changes after RME with and without corticotomy over multiple retention periods.. MATERIALS AND METHODS Sample selection Eighteen male Dorper sheep aged 20 to 48 months and weighing 50 to 60 kg were used in this study. The study protocol was approved by Institutional Animal Care and Use Committee (IACUC) at Universiti Putra Malaysia (UPM), Malaysia (No. UPM/IACUC/AUP-R031). The sheep were randomly divided into three groups (n = 6 in each group): group 1, RME treatment with corticotomy; group 2, RME treatment; and group 3, no treatment/the control group. According to resource equation method, if the difference between the total number of animals and the total number of groups is between 10 and 20, the sample size is considered adequate, thus indicating that the sample size in this study is indeed adequate.18 The sheep selected for this study had good general health with no periodontal disease and showed full eruption of all maxillary premolars. Hyrax expander fixation and corticotomy were performed under general anesthesia. Sheep were anesthetized with intravenous ketamine 7 mg/kg (Narketan® 10; Vetoquinol, Magny-Vernois, France) and diazepam 0.6 mg/kg (Diapine; Atlantic Laboratories Corporation Ltd., Bangkok, Thailand). Endotracheal intubation was performed and anesthesia was maintained with isoflurane at a concentration of 2% to 3% in 100% oxygen. Corticotomy protocol In group 1, corticotomy surgery was performed with a 2-mm-diameter round bur—perisegmental from the first to the third premolars on the buccal and palatal aspects in accordance with a previous protocol.17 The depth and width of the incisions were 2 mm (approximating the thickness of sheep cortical bone). The buccal and palatal mucosa were anesthetized via local infiltration of 2% lidocaine HCl with epinephrine 1:100,000 (Lignospan; Septodont, Saint-Maur-des-Fossés, France). A full-thickness flap was elevated. The cutting lines on the buccal aspect included vertical incisions parallel to the tooth. https://doi.org/10.4041/kjod.2019.49.4.235. www.e-kjo.org.
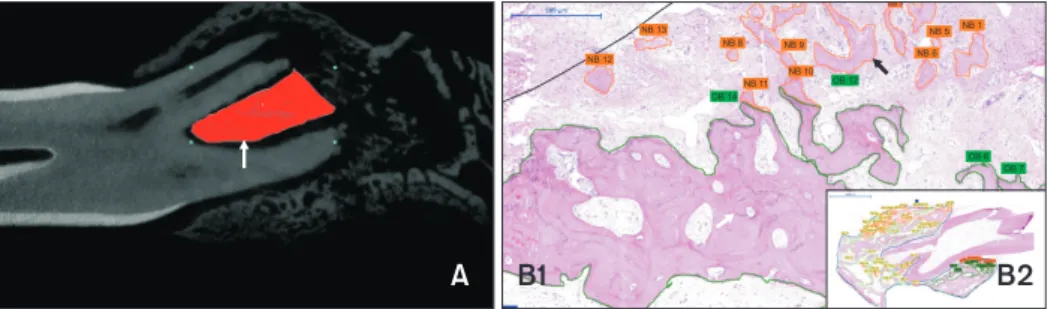
(3) Le et al • Alveolar restoration following RME with/without corticotomy. axis made at the alveoli mesial to the first premolars and distal to the third premolars, which communicated with a horizontal line made above the root apex at approximately 5 mm. On the palatal side, the vertical incisions were similar to those on the buccal side, but the horizontal cut was performed approximately 5 mm from the cementoenamel junction. Subsequently, the buccal and palatal flaps were closed with absorbable suture material (PDSTM Plus; Ethicon Inc., Somerville, NJ, USA). Hyrax appliances were cemented, and the expander screw was turned by 1 mm immediately after the surgery. After a 5-day lag, the expansion screw was turned at the rate of 0.5 mm/day. When an incision is placed on the bone, the regional acceleratory phenomenon (RAP) occurs within a few days and accelerates the bone turnover. The RAP is a series of local healing events in response to a noxious stimulus. In this event, normal cellular activities are accelerated to facilitate the healing process. The dominant features of RAP are the burst of anabolic and catabolic events at the injured sites. These activities also lead to demineralization of the local bone.19 In this study, the expansion screw was only turned 1 mm right after surgery and not turned for 5 days to take the advantage of the demineralization produced by RAP. The bone-healing process after injury has been reported to include two phases, i.e., woven bone formation and transformation of woven bone into lamellar bone. Woven bone started to form within a few days after injury and reached its peak thickness at day 7. After seven days, the woven bone at the cortical area was remodeled to lamellar bone, which increased the bone strength.19 Thus, ceasing expansion screw turning for 5 days was ideal because it could take the advantage of demineralization produced by RAP, while avoiding the disadvantage of increasing bone strength.. Hyrax appliance design and activation protocol The Hyrax expander consisted of a 16-mm Super Screw® (Great Lakes Orthodontics, Tonawanda, NY, USA) placed parallel to the midpalatal suture in the region of the second premolars. The extending arms of Super Screw® were soldered to four bands cemented to the first and third premolars with glass ionomer luting cement (KetacTM Cem Easymix; 3M, St. Paul, MN, USA). In both groups, the expansion screws were turned by 0.5 mm/day to attain a total of 8 mm of activation in groups 1 and 2. After the active phase, all expanders were kept in position for 4 or 12 weeks. Subsequently, in every group, 3 sheep were sacrificed at 4 or 12 weeks of retention. The upper jaws were separated by a sharp saw and preserved in 4% paraformaldehyde solution for 1 month. Microcomputed tomography protocol All maxillary samples of the sheep were covered with Parafilm and scanned using Skyscan 1176 microtomography scanner (Bruker, Kontich, Belgium). MicroCT scanning was performed at a resolution of 18 µm with the following parameters: 90 kV, 278 µA, 0.5-mm aluminum filter, and 360-degree rotation range. All acquired images were reconstructed by using NRecon software (version 1.6.10.4; Bruker) with a Gaussian smoothing of 3, beam hardening correction of 40%, and ring artefact reduction of 12. DataViewer (version 1.5.2.4 64-bit; Bruker) was used to reorient the direction of the reconstructed images to the sagittal plane. Subsequently, all images were imported into CTAn software (version 1.15.4.0+; Bruker) for bone microstructural analysis. The furcation areas enclosed by the buccal and lingual roots of premolars were defined as the region of interest (ROI) (Figure 1A). After selection of the ROIs, the automatic (Otsu method) threshold was applied for all images during the analysis. The bone microstructure. Figure 1. Region of interest (ROI) in quantification of bone microstructure (A) and new bone (NB) and old bone (OB) formation (B1 and B2). A, The furcation enclosed by the buccal and lingual roots of premolars was defined as the ROI (arrow) for measurements of bone microstructure. B, Magnification at hematoxylin and eosin (H&E) stain (×200) showing NB and OB. NB is defined as the amorphous eosinophilic material with porous bone and pale cement lines (black arrow). OB is the bone with a compact feature and prominent cement lines (white arrow) (B1); the total tissue area (outlined by the blue line) at H&E stain (×20) (B2). www.e-kjo.org. https://doi.org/10.4041/kjod.2019.49.4.235. 237.
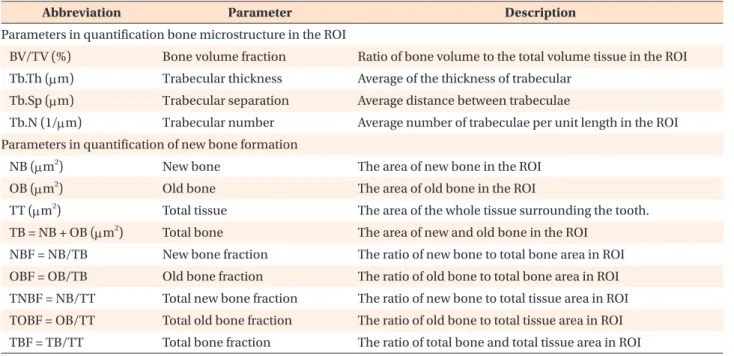
(4) Le et al • Alveolar restoration following RME with/without corticotomy. parameters are presented in Table 1. Since the left and right sides were pooled together, the total number of samples was 36 and every group contained 6 samples taken after 4 and 12 weeks of retention. Histomorphometric analysis of new bone formation The obtained maxillary samples (including the second and third premolars) were separated into left and right sides with a sharp saw. A coin was flipped for every sample to choose the left or right side for histological analysis. The total number of samples was 36, in which each group contained 12 samples—6 samples each taken after the 4- and 12-week retention periods. Among these six samples, 3 were the second premolar blocks, while the rest were the third premolar blocks. The maxillary samples were rinsed with a phosphatebuffered saline solution and decalcified with 10% ethylene diamine tetra-acetic acid (pH 7.4) at 4 oC for a month. Following decalcification, the tissue was dehydrated in ethyl alcohol of gradually increasing concentrations from 70% to 100% and embedded in paraffin. All samples were sagittally sectioned at 5-µm thickness through the second and third premolar roots using a microtome. Two slides were made for each area. Subsequently, all slides were stained with hematoxylin and eosin for histological examination. The whole-slide imaging data were digitized at 40× magnification by using a Pannoramic Desk slide scanner (3DHISTECH Ltd., Budapest, Hungary). Quantification of the new bone and old bone areas (as defined in Table. 1) was performed by using Pannoramic Viewer software (version 1.14.4; 3DHISTECH Ltd.). The ROI referred to the whole area of the tissue surrounding the premolar tooth, as shown on the slide (Figure 1B2). New bone was defined as the amorphous eosinophilic material with porous bone and pale cement lines, while old bone was the bone with a compact feature and prominent cement lines (Figure 1B1). Statistical analysis All data were analyzed by using SPSS Statistics version 20.0 (IBM Corp., Armonk, NY, USA). The Shapiro–Wilk test demonstrated that the data were normally distributed (p > 0.05). Two-way analysis of variance (ANOVA) with Bonferroni post -hoc assessment were employed to compare the intergroup differences. A p -value of 0.05 was considered statistically significant.. RESULTS Bone microstructure changes after 4- and 12-week retention periods After the 4-week retention period, bone volume fraction (BV/TV) and Tb.Th values in both intervention groups decreased significantly in comparison with those in the control group (p < 0.05; Table 2). The relative values of BV/TV to the control in groups 1 and 2 were 54.40% to 69.88% (Figure 2). After 12 weeks of retention, BV/TV, Tb.Th, and Tb.N values in both intervention groups increased in comparison with those after the. Table 1. Definition of parameters used in the quantification of bone microstructure and new bone formation in the region of interest (ROI) Abbreviation. Parameter. Description. Parameters in quantification bone microstructure in the ROI BV/TV (%). Bone volume fraction. Ratio of bone volume to the total volume tissue in the ROI. Tb.Th (µm). Trabecular thickness. Average of the thickness of trabecular. Tb.Sp (µm). Trabecular separation. Average distance between trabeculae. Tb.N (1/µm). Trabecular number. Average number of trabeculae per unit length in the ROI. Parameters in quantification of new bone formation NB (µm2). New bone. The area of new bone in the ROI. OB (µm2). Old bone. The area of old bone in the ROI. Total tissue. The area of the whole tissue surrounding the tooth.. 2. TT (µm ) 2. TB = NB + OB (µm ). Total bone. The area of new and old bone in the ROI. NBF = NB/TB. New bone fraction. The ratio of new bone to total bone area in ROI. OBF = OB/TB. Old bone fraction. The ratio of old bone to total bone area in ROI. TNBF = NB/TT. Total new bone fraction. The ratio of new bone to total tissue area in ROI. TOBF = OB/TT. Total old bone fraction. The ratio of old bone to total tissue area in ROI. TBF = TB/TT. Total bone fraction. The ratio of total bone and total tissue area in ROI. 238. https://doi.org/10.4041/kjod.2019.49.4.235. www.e-kjo.org.
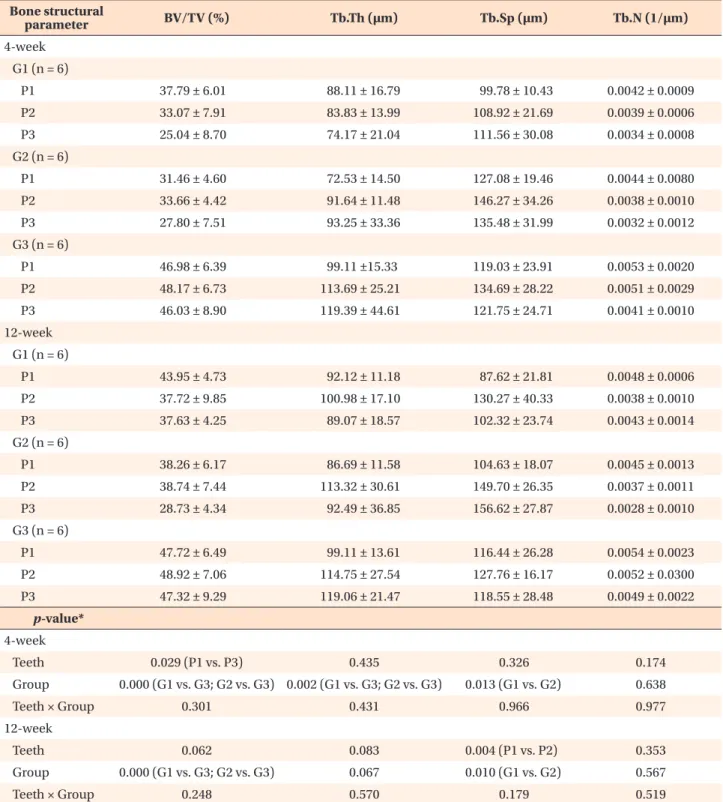
(5) Le et al • Alveolar restoration following RME with/without corticotomy. Table 2. Bony microstructural changes in groups 1–3 after the 4- and 12-week retention periods Bone structural parameter. BV/TV (%). Tb.Th (µm). Tb.Sp (µm). Tb.N (1/µm). P1. 37.79 ± 6.01. 88.11 ± 16.79. 99.78 ± 10.43. 0.0042 ± 0.0009. P2. 33.07 ± 7.91. 83.83 ± 13.99. 108.92 ± 21.69. 0.0039 ± 0.0006. P3. 25.04 ± 8.70. 74.17 ± 21.04. 111.56 ± 30.08. 0.0034 ± 0.0008. P1. 31.46 ± 4.60. 72.53 ± 14.50. 127.08 ± 19.46. 0.0044 ± 0.0080. P2. 33.66 ± 4.42. 91.64 ± 11.48. 146.27 ± 34.26. 0.0038 ± 0.0010. P3. 27.80 ± 7.51. 93.25 ± 33.36. 135.48 ± 31.99. 0.0032 ± 0.0012. 4-week G1 (n = 6). G2 (n = 6). G3 (n = 6) P1. 46.98 ± 6.39. 99.11 ±15.33. 119.03 ± 23.91. 0.0053 ± 0.0020. P2. 48.17 ± 6.73. 113.69 ± 25.21. 134.69 ± 28.22. 0.0051 ± 0.0029. P3. 46.03 ± 8.90. 119.39 ± 44.61. 121.75 ± 24.71. 0.0041 ± 0.0010. P1. 43.95 ± 4.73. 92.12 ± 11.18. 87.62 ± 21.81. 0.0048 ± 0.0006. P2. 37.72 ± 9.85. 100.98 ± 17.10. 130.27 ± 40.33. 0.0038 ± 0.0010. P3. 37.63 ± 4.25. 89.07 ± 18.57. 102.32 ± 23.74. 0.0043 ± 0.0014. 12-week G1 (n = 6). G2 (n = 6) P1. 38.26 ± 6.17. 86.69 ± 11.58. 104.63 ± 18.07. 0.0045 ± 0.0013. P2. 38.74 ± 7.44. 113.32 ± 30.61. 149.70 ± 26.35. 0.0037 ± 0.0011. P3. 28.73 ± 4.34. 92.49 ± 36.85. 156.62 ± 27.87. 0.0028 ± 0.0010. P1. 47.72 ± 6.49. 99.11 ± 13.61. 116.44 ± 26.28. 0.0054 ± 0.0023. P2. 48.92 ± 7.06. 114.75 ± 27.54. 127.76 ± 16.17. 0.0052 ± 0.0300. P3. 47.32 ± 9.29. 119.06 ± 21.47. 118.55 ± 28.48. 0.0049 ± 0.0022. 0.029 (P1 vs. P3). 0.435. G3 (n = 6). p-value* 4-week Teeth Group Teeth × Group. 0.000 (G1 vs. G3; G2 vs. G3) 0.002 (G1 vs. G3; G2 vs. G3). 0.326. 0.174. 0.013 (G1 vs. G2). 0.638. 0.301. 0.431. 0.966. 0.977. Teeth. 0.062. 0.083. 0.004 (P1 vs. P2). 0.353. Group. 0.000 (G1 vs. G3; G2 vs. G3). 0.067. 0.010 (G1 vs. G2). 0.567. 0.248. 0.570. 0.179. 0.519. 12-week. Teeth × Group. Values are presented as mean ± standard deviation. G, Group; G1, corticotomy + rapid maxillary expansion (RME); G2, conventional RME; G3, control; P1, first premolar; P2, second premolar; P3, third premolar. *Two-way analysis of variance with Bonferroni post -hoc assessment for comparisons among groups. See Table 1 for the definitions of each measurement.. www.e-kjo.org. https://doi.org/10.4041/kjod.2019.49.4.235. 239.
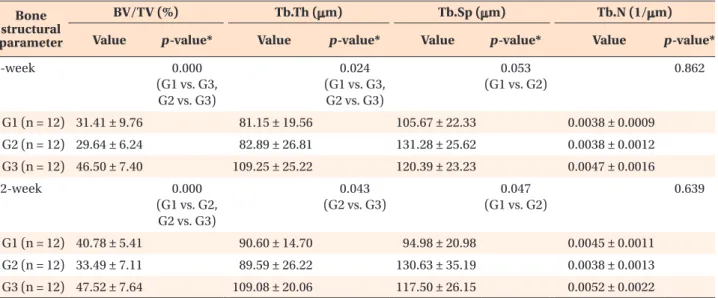
(6) Le et al • Alveolar restoration following RME with/without corticotomy. 4-week retention period, with a higher increment noted in group 1 (p > 0.05; Table 2). At this point of time, the BV/TV values in all groups (except for the third premolar region in group 2) returned to approximately 80% relative to those of the control (Figure 2).. Figure 2. Relative values of bone volume fraction (BV/TV) at the premolar regions compared to the control values in groups 1 (corticotomy + rapid maxillary expansion [RME]) and 2 (conventional RME) after 4 and 12 weeks of retention. P1, First premolar; P2, second premolar; P3, third premolar; 4w, 4-week retention; 12w, 12-week retention.. The bone microstructure data of the banded teeth (first premolar and third premolar) in the three groups were pooled and analyzed as shown in Table 3. After the 4-week retention period, the pooled BV/TV and Tb.Th values in both intervention groups were significantly lower than those in the control group (p < 0.05; Table 3). Nevertheless, after the 12-week retention period, the pooled BV/TV value of group 2 was significantly lower than those of groups 1 and 3 (p < 0.05; Table 3 and Figure 3). At this point of time, the BV/TV value in group 1 returned to 85.80% relative to that of the control, while it was lower in group 2 (70.47%; Figure 3). The intraclass correlation coefficients (ICCs) were 0.95, 0.96, 0.97, and 0.94 for BV/TV, Tb.Th, Tb.Sp, and Tb.N, respectively. Histomorphometric analysis of new bone formation after 4- and 12-week retention periods After the 4-week retention period, the ratio values related to the new bone changes (new bone fraction [NBF] and total new bone fraction [TNBF]) in group 1 were approximately two to four times higher than those obtained for groups 2 and 3 (p < 0.05; Table 4). The new bone formation in group 2 was just slightly higher than that in the control group (p > 0.05; Table 4). However, the total bone fraction (TBF) values in the two intervention groups were significantly lower than that in the control (p < 0.05; Table 4) at this point of time, indicating an overall decrease in the quantity of alveolar bone during the experimental period.. Table 3. Differences in bony microstructural changes of pool banded teeth (P1 + P3) in groups 1–3 after the 4- and 12week retention periods Bone structural parameter. BV/TV (%) Value. 4-week. p -value*. Tb.Th (µm) Value. 0.000 (G1 vs. G3, G2 vs. G3). Tb.Sp (µm). p -value*. Value. 0.024 (G1 vs. G3, G2 vs. G3). p -value*. Tb.N (1/µm). p -value*. Value. 0.053 (G1 vs. G2). 0.862. G1 (n = 12) 31.41 ± 9.76. 81.15 ± 19.56. 105.67 ± 22.33. 0.0038 ± 0.0009. G2 (n = 12) 29.64 ± 6.24. 82.89 ± 26.81. 131.28 ± 25.62. 0.0038 ± 0.0012. G3 (n = 12) 46.50 ± 7.40. 109.25 ± 25.22. 120.39 ± 23.23. 0.0047 ± 0.0016. 12-week. 0.000 (G1 vs. G2, G2 vs. G3). 0.043 (G2 vs. G3). 0.047 (G1 vs. G2). 0.639. G1 (n = 12) 40.78 ± 5.41. 90.60 ± 14.70. 94.98 ± 20.98. 0.0045 ± 0.0011. G2 (n = 12) 33.49 ± 7.11. 89.59 ± 26.22. 130.63 ± 35.19. 0.0038 ± 0.0013. G3 (n = 12) 47.52 ± 7.64. 109.08 ± 20.06. 117.50 ± 26.15. 0.0052 ± 0.0022. Values are presented as mean ± standard deviation. G, Group; G1, corticotomy + rapid maxillary expansion (RME); G2, conventional RME; G3, control. *One-way analysis of variance with Bonferroni post-hoc assessment for comparison among groups. See Table 1 for the definitions of each measurement.. 240. https://doi.org/10.4041/kjod.2019.49.4.235. www.e-kjo.org.
(7) Le et al • Alveolar restoration following RME with/without corticotomy. Figure 3. A, Relative values of bone volume fraction (BV/TV) values compared to the control values for the banded teeth (the first and third premolars) in groups 1 (corticotomy + rapid maxillary expansion [RME]) and 2 (conventional RME) after 4 and 12 weeks of retention. B, Alveolar trabecular bone microstructural images of group 1 after 4 (B1) and 12 weeks of retention (B3) and of group 2 after 4 (B2) and 12 weeks of retention (B4). C, Histological images at H&E stain (×100) showed that the bone volume in group 1 after 4 and 12 weeks of retention (C1 and C3) were higher than those in group 2 after 4 and 12 weeks of retention (C2 and C4) (H&E stain, ×100). P1, First premolar; P3, third premolar; 4w, 4-week retention; 12w, 12-week retention. *p < 0.05. After the 12-week retention period, NBF value in group 1 slightly decreased, but they were still significantly higher (two to three times) than those in groups 2 and 3 (p < 0.05; Table 4). Interestingly, the high levels of new bone formation activity may be responsible for the fact that the TBF in group 1 was not significantly lower than that in the control group (p > 0.05), while this value in group 2 was still rather low (p < 0.05). The ICC results were 0.93, 0.96, and 0.97 for new bone, old bone, and total tissue, respectively.. DISCUSSION Adequate bone remodeling around orthodontically moved roots should play an important role in limiting the tooth from turning back to its previous position. Recently, corticotomy has emerged as a promising intervention for this purpose. One of the suggested advantages of corticotomy is that it can enhance the stability. www.e-kjo.org. https://doi.org/10.4041/kjod.2019.49.4.235. of orthodontic results,12-14 but its impact on tooth stability has still not been elucidated. Therefore, the benefits of corticotomy in rehabilitating bone quality during retention periods should be elaborated in comparison with conventional RME. This study involved adult sheep, whose growth had ceased. In addition, this animal had a larger dental arch than rodents, and the shapes of sheep teeth were convenient for retention of tooth-borne expanders, which facilitated the use of maxillary expansion procedures similar to those used in humans. After the 4-week retention period, a significant decrease in BV/TV and Tb.Th was observed in the two intervention groups in comparison with the control. These results imply that RME influenced the trabecular thickness and BV/TV more than other bone quality indices. After 12 weeks of retention, increments were observed in the BV/TV, Tb.Th, and Tb.N values for the two intervention groups. The BV/TV values relative to the control. 241.
(8) Le et al • Alveolar restoration following RME with/without corticotomy. Table 4. New and old bone components in supporting tissue in groups 1–3 after 4 and 12 weeks of retention Ratio of bone parameter. NBF. OBF. TNBF. TOBF. TBF. P2. 0.199 ± 0.075. 0.801 ± 0.075. 0.003 ± 0.0002. 0.013 ± 0.007. 0.015 ± 0.006. P3. 0.165 ± 0.059. 0.835 ± 0.059. 0.002 ± 0.0006. 0.010 ± 0.003. 0.012 ± 0.004. P2. 0.055 ± 0.030. 0.945 ± 0.030. 0.001 ± 0.0003. 0.018 ± 0.005. 0.019 ± 0.005. P3. 0.064 ± 0.032. 0.936 ± 0.032. 0.001 ± 0.0002. 0.014 ± 0.011. 0.015 ± 0.011. P2. 0.035 ± 0.011. 0.965 ± 0.011. 0.001 ± 0.0002. 0.031 ± 0.009. 0.032 ± 0.009. P3. 0.041 ± 0.018. 0.959 ± 0.018. 0.001 ± 0.0002. 0.033 ± 0.016. 0.034 ± 0.016. P2. 0.116 ± 0.046. 0.912 ± 0.036. 0.003 ± 0.0008. 0.023 ± 0.005. 0.025 ± 0.006. P3. 0.125 ± 0.045. 0.875 ± 0.045. 0.002 ± 0.0007. 0.016 ± 0.001. 0.019 ± 0.001. P2. 0.081 ± 0.054. 0.919 ± 0.055. 0.001 ± 0.0008. 0.014 ± 0.002. 0.015 ± 0.001. P3. 0.056 ± 0.026. 0.944 ± 0.026. 0.001 ± 0.0003. 0.015 ± 0.003. 0.017 ± 0.003. P2. 0.031 ± 0.016. 0.971 ± 0.018. 0.001 ± 0.0009. 0.031 ± 0.011. 0.032 ± 0.012. P3. 0.032 ± 0.010. 0.968 ± 0.010. 0.001 ± 0.0002. 0.030 ± 0.010. 0.031 ± 0.010. 0.777. 0.777. 0.043 (P2 vs. P3). 0.753. 0.709. 4-week G1 (n = 3). G2 (n = 3). G3 (n = 3). 12-week G1 (n = 3). G2 (n = 3). G3 (n = 3). p-value* 4-week Teeth Group Teeth × Group. 0.000 0.000 0.000 0.009 0.011 (G1 vs. G2; G1 vs. G3) (G1 vs. G2; G1 vs. G3) (G1 vs. G2; G1 vs. G3) (G1 vs. G3; G2 vs. G3) (G1 vs. G3, G2 vs. G3) 0.650. 0.447. 0.152. 0.883. 0.859. Teeth. 0.78. 0.766. 0.356. 0.523. 0.517. Group. 0.004 (G1 vs. G3). 0.009 (G1 vs. G3). 0.371. 0.337. 12-week. Teeth × Group. 0.003 0.004 (G1 vs. G2; G1 vs. G3) (G1 vs. G3; G2 vs. G3) 0.954. 0.552. 0.006 (G2 vs. G3) 0.605. Values are presented as mean ± standard deviation. G, Group; G1, corticotomy + rapid maxillary expansion (RME); G2, conventional RME; G3, control; P2, second premolar; P3, third premolar. *Two-way analysis of variance with Bonferroni post -hoc assessment for comparison among groups. See Table 1 for the definitions of each measurement.. recovered to more than 77% in most of the regions, except for the third premolar region in group 2 (60.71%). Interestingly, the pooled BV/TV value of banded teeth in group 1 was significantly higher than that in group 2 after the 12-week retention period. Therefore, corticotomy surgery improved the recovery of bone quality of banded teeth in group 1 in comparison with that in. 242. group 2. Some studies have quantified the alveolar bone density after orthodontic tooth movement.20-22 Verna et al.20 reported that the mesial tooth movement in rats caused a noticeable reduction in the BV/TV. This decrease occurred at the alveolar bone adjacent to the displaced teeth and also extended to the bone surrounding its. https://doi.org/10.4041/kjod.2019.49.4.235. www.e-kjo.org.
(9) Le et al • Alveolar restoration following RME with/without corticotomy. neighboring teeth. Recent studies in humans have shown that the alveolar density around the roots reduced by 20% to 29%. When the tooth was moved more than 0.5 mm, the density reduction increased up to 59.00% to 69.10%.21,22 However, these studies did not reveal the bone quality recovery during the retention period. In addition, the values of bone microstructure parameters evaluated via cone-beam computed tomography images were less accurate when compared to those obtained from microCT.23 Although our study did not evaluate the bone quality changes immediately after the expansion, the BV/TV values after the 4-week retention period were around 60% than of those of the control group. This result implies that the bone quality would have decreased more than 60%, which is in agreement with past studies.20-22 Another advantage of this study refers to the bone microstructure parameters, which were measured by using microCT to ascertain measurement accuracy. A previous study reported that the rate of tooth relapse and bone quality changes after tooth movement in 10 days.24 Franzen et al.24 showed that the molars relapsed very quickly from the first day and the amount of relapse was up to 73% of the achieved tooth movement. The relapse rate started to stabilize after 7 days, and the total relapse after 12 days was very high at 93%. The BV/TV increased from 17% to 25% within 21 days of follow-up.24 In our study, we did not evaluate the bone volume changes right after the activation phase since the high tendency of tooth relapse at this point of time might affect the results for bone quality. After the 4-week retention, bone microstructure recovered to a certain level to prevent the tooth from immediately returning back to its previous position. Studies on the effect of retention after long-term orthodontic treatment are scarce. van Leeuwen et al. 7 reported that teeth in the group without retention showed relapse immediately after orthodontic appliance removal. Conversely, teeth in the 3-month retention group showed a lower degree of relapse and at a slower rate. These authors also suggested that retention was crucial when the tooth was moved greater than 4 mm.7 As the bone microstructural value after the 12-week retention period was higher than that after 4 weeks, this study showed that the retention period did influence the recovery of bone quality after orthodontic treatment. However, at the 12-week retention period, the bone quality only returned to approximately 80% of the baseline. Therefore, retention periods exceeding 3 months are crucial to maintain the achieved treatment outcomes since a 3-month retention time is inadequate to remodel the alveolar bone for complete rehabilitation. The role of corticotomy in bone quality rehabilitation is more obvious for the banded teeth. After 12 weeks of retention, the pooled BV/TV value in group 1 was sig-. www.e-kjo.org. https://doi.org/10.4041/kjod.2019.49.4.235. nificantly higher than that in group 2. Banded and wiresupported teeth would bear different loads; therefore, their mechanical and biological responses would differ.25 In addition, some authors confirmed that the accumulated load from the expander caused root resorption even after the activation period.26 These findings might explain the slow recovery of bone microstructure around the banded teeth in group 2. Noticeably, the relative value of BV/TV to the control in the third premolar region in group 2 increased slightly (from 60.39% to 60.71%) after the 12-week retention period, which may signify an overloaded expansion force to this tooth. However, decortication was believed to release the resistance of cortical bone.12 Chung et al.14 showed that the disruption of cortical bone facilitates the displacement of the bone segment. Corticotomy resulted in discontinuation of the cortical bone and may help reduce the accumulative stress. Therefore, the bone quality recovered better in group 1 than in group 2. In another aspect, the benefit of corticotomy was not expressed clearly on wiresupported teeth, which could be due to the fewer incisions (only horizontal incisions at the apex) around the second premolars. The benefits of corticotomy may also be derived from RAP. Sebaoun et al.27 claimed that the anabolic turnover increased by two- to three-fold after decortication in rats. The hike in anabolic activity induces greater bone apposition in the trabecular bone around the molar roots.27 The findings reported by Sebaoun et al.27 are in agreement with other studies, in which anabolic activity and bone surface area were shown to dramatically increase some weeks after corticotomy.28,29 Parallel to previous studies, this study reveals that the rate of new bone formation in group 1 was three to four times greater than that in group 2 over the retention periods. This implies that the bone remodeling activities were very active in the corticotomy group; therefore, the rehabilitation of the alveolar bone was higher in group 1 than in group 2. To date, the relative bone quality changes during the retention period, especially after maxillary expansion, have not been well-documented. This study revealed that bone quality in terms of bone microstructure increased during the retention period. However, a 3-month retention period is insufficient for complete rehabilitation of bone microstructure, which explains the possibility of relapse after retention. In addition, corticotomy remarkably enhanced the restoration of bone quality and therefore had the potential to enhance the stability of orthodontic outcomes.. CONCLUSION Corticotomy significantly enhanced the restoration of. 243.
(10) Le et al • Alveolar restoration following RME with/without corticotomy. bone microstructure of banded teeth during the retention periods and might have the potential to increase the stability of orthodontic outcomes. The rate of bone remodeling was very active in the corticotomy group. New bone formation in group 1 was two to three times higher of those in groups 2 and 3.. CONFLICTS OF INTEREST No potential conflict of interest relevant to this article was reported.. ACKNOWLEDGEMENTS This research is supported by the High Impact Research MoE Grant UM.C/625/1/HIR/MoE/Dent21 from Ministry of Education Malaysia and University of Malaya Postgraduate Research Grant PG275-2016A.. REFERENCES 1. King EW. Relapse of orthodontic treatment. Angle Orthod 1974;44:300-15. 2. Little RM. Dr. Robert M. Little on the University of Washington post-retention studies. J Clin Orthod 2009;43:723-7. 3. Little RM. Clinical implications of the University of Washington post-retention studies. J Clin Orthod 2009;43:645-51. 4. Gurel HG, Memili B, Erkan M, Sukurica Y. Longterm effects of rapid maxillary expansion followed by fixed appliances. Angle Orthod 2010;80:5-9. 5. Suri L, Taneja P. Surgically assisted rapid palatal expansion: a literature review. Am J Orthod Dentofacial Orthop 2008;133:290-302. 6. Johnston CD, Littlewood SJ. Retention in orthodontics. Br Dent J 2015;218:119-22. 7. van Leeuwen EJ, Maltha JC, Kuijpers-Jagtman AM, van't Hof MA. The effect of retention on orthodontic relapse after the use of small continuous or discontinuous forces. An experimental study in beagle dogs. Eur J Oral Sci 2003;111:111-6. 8. Godoy F, Godoy-Bezerra J, Rosenblatt A. Treatment of posterior crossbite comparing 2 appliances: a community-based trial. Am J Orthod Dentofacial Orthop 2011;139:45-52. 9. Cozzani M, Guiducci A, Mirenghi S, Mutinelli S, Siciliani G. Arch width changes with a rapid maxillary expansion appliance anchored to the primary teeth. Angle Orthod 2007;77:296-302. 10. Bell RA, LeCompte EJ. The effects of maxillary expansion using a quad-helix appliance during the deciduous and mixed dentitions. Am J Orthod 1981;79:152-61.. 244. 11. Petrén S, Bjerklin K, Bondemark L. Stability of unilateral posterior crossbite correction in the mixed dentition: a randomized clinical trial with a 3-year follow-up. Am J Orthod Dentofacial Orthop 2011;139:e73-81. 12. Kole H. Surgical operations on the alveolar ridge to correct occlusal abnormalities. Oral Surg Oral Med Oral Pathol 1959;12:515-29. 13. Wilcko MT, Wilcko WM, Pulver JJ, Bissada NF, Bouquot JE. Accelerated osteogenic orthodontics technique: a 1-stage surgically facilitated rapid orthodontic technique with alveolar augmentation. J Oral Maxillofac Surg 2009;67:2149-59. 14. Chung KR, Kim SH, Lee BS. Speedy surgical-orthodontic treatment with temporary anchorage devices as an alternative to orthognathic surgery. Am J Orthod Dentofacial Orthop 2009;135:787-98. 15. Lines PA. Adult rapid maxillary expansion with corticotomy. Am J Orthod 1975;67:44-56. 16. Echchadi ME, Benchikh B, Bellamine M, Kim SH. Corticotomy-assisted rapid maxillary expansion: a novel approach with a 3-year follow-up. Am J Orthod Dentofacial Orthop 2015;148:138-53. 17. Le MHT, Lau SF, Ibrahim N, Noor Hayaty AK, Radzi ZB. Adjunctive buccal and palatal corticotomy for adult maxillary expansion in an animal model. Korean J Orthod 2018;48:98-106. 18. Charan J, Kantharia ND. How to calculate sample size in animal studies? J Pharmacol Pharmacother 2013;4:303-6. 19. Ferguson DJ, Wilcko MT. Tooth movement mechanobiology: toward a unifying concept. In: Shroff B, ed. Biology of orthodontic tooth movement. Basel: Springer; 2016. p. 13-44. 20. Verna C, Zaffe D, Siciliani G. Histomorphometric study of bone reactions during orthodontic tooth movement in rats. Bone 1999;24:371-9. 21. Chang HW, Huang HL, Yu JH, Hsu JT, Li YF, Wu YF. Effects of orthodontic tooth movement on alveolar bone density. Clin Oral Investig 2012;16:679-88. 22. Hsu JT, Chang HW, Huang HL, Yu JH, Li YF, Tu MG. Bone density changes around teeth during orthodontic treatment. Clin Oral Investig 2011;15:511-9. 23. Panmekiate S, Ngonphloy N, Charoenkarn T, Faruangsaeng T, Pauwels R. Comparison of mandibular bone microarchitecture between micro-CT and CBCT images. Dentomaxillofac Radiol 2015;44:20140322. 24. Franzen TJ, Monjo M, Rubert M, Vandevska-Radunovic V. Expression of bone markers and micro-CT analysis of alveolar bone during orthodontic relapse. Orthod Craniofac Res 2014;17:249-58. 25. Martins DC, Souki BQ, Cheib PL, Silva GA, Reis ID, Oliveira DD, et al. Rapid maxillary expansion: do banded teeth develop more external root resorption. https://doi.org/10.4041/kjod.2019.49.4.235. www.e-kjo.org.
(11) Le et al • Alveolar restoration following RME with/without corticotomy. than non-banded anchorage teeth? Angle Orthod 2016;86:39-45. 26. Langford SR. Root resorption extremes resulting from clinical RME. Am J Orthod 1982;81:371-7. 27. Sebaoun JD, Kantarci A, Turner JW, Carvalho RS, Van Dyke TE, Ferguson DJ. Modeling of trabecular bone and lamina dura following selective alveolar decortication in rats. J Periodontol 2008;79:167988.. www.e-kjo.org. https://doi.org/10.4041/kjod.2019.49.4.235. 28. Bogoch E, Gschwend N, Rahn B, Moran E, Perren S. Healing of cancellous bone osteotomy in rabbits-part II: local reversal of arthritis-induced osteopenia after osteotomy. J Orthop Res 1993;11:292-8. 29. McBride MD, Campbell PM, Opperman LA, Dechow PC, Buschang PH. How does the amount of surgical insult affect bone around moving teeth? Am J Orthod Dentofacial Orthop 2014;145:S92-9.. 245.
(12)
수치
관련 문서
