Study on the obesity and nutrition status of housewives in Seoul and Kyunggi area
Keun-Hee Chung
1§, Kyung-Ok Shin
1, Jin-A Yoon
2and Kyung Soon Choi
11
Department of Food and Nutrition, Sahmyook University, Hwarangro-815, Nowon-gu, Seoul 139-742, Korea
2
Department of Food and Nutrition, Baewha Women's College, Seoul 110-735, Korea
Abstract
This study was conducted to evaluate the rate of obesity of 212 women (age 45-60 years) in Seoul and the Kyunggi area through analysis of BMI and the dietary life factors related to obesity using a survey on dietary habits, dietary assessment, and nutrient intake. The height of the underweight group was taller than normal. The height of the obese group was equal to that of the normal group, but the weight was 8.5 kg greater than the normal group. Women in the underweight group consumed meals irregularly, and only 33.4% ate breakfast. Additionally, the rate of overeating was low in the underweight group, and milk, dairy products (yogurt, etc.), fruit, and fruit juice were consumed more than once a day. It was found that 62.1% of the women in the obese group never ate out, and the rate of eating one serving of fruit, drinking one cup of fruit juice, and eating various kinds of foods was high. The average point of women’s dietary life was 21.9 ± 2.9, and 12.7% of all women responded that their dietary life was good. However, in the obese group, only 6.9% of the women reported that their dietary life was good. Evaluation of snacking habits revealed that the underweight group consumed a high level of carbonated drinks and ice cream, whereas for in the obese group, 24.1%
of the women consumed milk and its products and 5.6% regularly consumed fast and fried foods. Evaluation of nutrient intake revealed that the consumption of energy, protein, vitamin A, vitamin B1, B2, B6, niacin, vitamin C, and vitamin E was high in all of the groups, but the intake of folic acid in the underweight group was lower than the required level. Overall, 24.1% of the women in the obese group were found to have metabolic diseases, mostly hypertension (43%). In conclusion, a balanced diet to avoid excessive nutrient intake is needed to prevent obesity.
Key Words: Housewives, BMI, mini dietary assessment, nutrient intakes, disease
Introduction
8)Dietary life is the fundamental element affecting health maintenance. Individual dietary life is influenced by several environmental factors such as age, education, job, economic level, family status, and residence [1]. Housewives often have less time available to maintain their health due to typical home- making duties, which include maintenance of familial dietary life and child care [2,3]. Women's social participation has recently increased the number of working housewives, resulting in changes in dietary patterns. Recently, the use of instant and processed foods has increased for reasons of convenience. Instant and processed foods are high-calorie foods and lead to safety problems when consumed regularly. Consequently, diseases associated with obesity and a sedimentary lifestyle have increased due to unbalanced diets.
Changes in the dietary intake of housewives, along with decreases in physical activity, have led to the social problem of obesity [4]. Obesity is the over accumulation of subcutaneous or abdominal fat that occurs when energy consumption decreases due to decreased activity [5,6]. The cause of obesity is a result
of genetic, social, economic, and environmental factors, as well as various factors including physical form, physique, and concept of health [7-9]. Obese individuals tend to consume diets that have higher energy and fat contents than normal individuals [10,11].
Additionally, it has been reported that a 10% increase in body weight can result in changes in plasma cholesterol and triacylglycerol levels [5]. This is especially true for women over 40 years of age after menopause, who undergo decreases in female hormones and increases in abdominal fat. Women 40 and 50 years of age tend to suffer from lifestyle diseases, including hypertension and diabetes, and often have endocrinal disease and health problems after menopause [12,13]. In previous studies [14-16], it was reported that women 30 and 40 years of age tend to consume much more fruit, bakery goods, noodles, and beverages as snacks as well as favor processed food, resulting in obesity.
Many recent studies [17-22] have been conducted to evaluate familial dietary management, purchasing habits of food, preparation of side dishes, nutrition status, and food preferences, but studies on obesity after childbirth are insufficient so far.
Accordingly, this study surveyed the obesity rate by analyzing
This paper was supported by the Sahmyook University Research Fund in 2010.
Keun-Hee Chung and Kyung-Ok Shin are co-first authors.
§Corresponding Author: Keun Hee Chung, Tel. 82-2-3399-1651, Fax. 82-2-3399-1655, Email. [email protected] Received: July 20, 2010, Revised: March 17, 2011, Accepted: March 30, 2011
ⓒ2011 The Korean Nutrition Society and the Korean Society of Community Nutrition
This is an Open Access article distributed under the terms of the Creative Commons Attribution Non-Commercial License (http://creativecommons.org/licenses/by-nc/3.0/) which permits unrestricted non-commercial use, distribution, and reproduction in any medium, provided the original work is properly cited.
the patterns of obesity in women as a result of dietary habits and nutrient intake.
Subjects and Methods
Subjects and study period
This study surveyed 212 subjects aged 45 to 60 years from October to December 2010 in Seoul and the Kyunggi Area. The subjects were stratified according to their BMI into underweight (21), normal (133), and obese (58) groups. Questionnaires were given to survey dietary habits, nutrient intake, and BMI.
Anthropometric measurements and BMI
Height (Sam Hwa Co., Korean) and weight (Tanita Co., Japan) were evaluated by a well-trained technician. Body fat was analyzed using a Tanita BIA (bioelectrical impedance analyzer).
To ensure the accuracy and reliability of the data, measurements were conducted by the same person. BMI values were calculated based on the measured heights and weights and stratified into underweight (BMI < 18.5 kg/m
2), normal (18.5 kg/m
2≤ BMI <
22.9 kg/m
2), and obese (BMI ≥ 23 kg/m
2) groups according to the Korea Obesity Association [23-25].
Survey of eating habits
Evaluation of eating habits was based on regularity of meal times, eating breakfast or not, reason for skipping meals, overeating, reason for overeating, eating out, preference for specific foods, and unbalanced meals.
Mini dietary assessment and types of snacks
A dietary life assessment survey [26] composed of ten questions was used to briefly assess the respondents’ dietary habits. Specifically, questions with 3-point responses were given to the subjects (3 = Very often, 1 = Seldom). The results of the dietary life assessment were stratified into good (30~26), fair (25~18), and poor (under 17) groups. The types of snacks included milk and its products, fruit, bread, and potato, carbonated drinks and ices, fast food and fried foods, and the subjects were queried regarding their intake of snacks.
Intakes nutrition
Dietary intake information was collected using food-frequency questionnaires [27]. Detailed descriptions of a total of 100 types of foods, including 14 types of grains and grain products, 10 types of meat products, 18 types of marine products, 13 types of fruits, seven types of beverages, as well as information regarding snacks, dairy products, and others items, were collected.
Diet composition was analyzed according to each nutrient using the Computerized Nutrient Analysis Program 3.0 (CAN PRO 3.0, 8th edition, 2005). The nutrient intake of each subject was assessed based on the Estimated Average Requirement (EAR), Recommended Intake (RI), and Adequate Intake (AI), which are commonly used to assess the standard dietary intakes of women aged 50 to 64 years in Korea [28].
Health habit
Items of health such as sleeping time, exercise, frequency of exercise, duration of exercise, interest in health, and methods of maintaining health were surveyed.
Intake of supplements and disease
Supplement intake, types of supplements, disease suffering, types of disease, and rate of influenza were evaluated.
Statistical analysis
The difference among the means were determined by ANOVA, followed by Duncan's multiple range test using the SPSS package (version 13.0). The level of statistical significance was set at P < 0.05. Frequency, percentage, and differences among factors were analyzed by a χ
2-test (P < 0.05).
Results
Anthropometric measurements and BMI
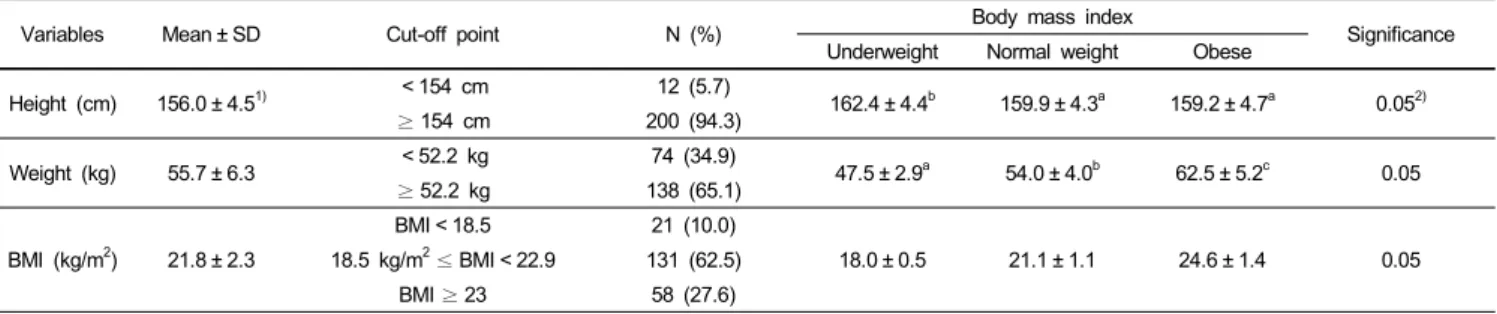
Physical characteristics and BMI are shown in Table 1. The average height, weight, and BMI of the women in this study were 156.0 ± 4.5 cm, 55.7 ± 6.3 kg, and 21.8 ± 2.3 kg/m
2, respec- tively. The rates of height and weight that were larger than normal values were 94.3% and 65.1%, respectively. Significant differences among the three groups were observed (P < 0.05).
The rates of underweight, normal, and obese individuals stratified by BMI were 10.0%, 62.5%, and 27.6%, respectively. The average BMI values of the underweight, normal, and obese groups were 18.0 ± 0.5 kg/m
2, 21.1 ± 1.1 kg/m
2, and 24.6 ± 1.4 kg/m
2, respectively (P < 0.05).
Survey of eating habits
The data obtained from the survey of eating habits are shown
in Table 2. Overall, 43.6% of normal and 41.4% of obese
individuals reported that they ate three meals regularly, whereas
only 23.8% of underweight individuals reported they ate three
meals regularly (P < 0.05). In addition, 33.4% of underweight,
50.4% of normal, and 60.3% of obese individuals ate breakfast
everyday, whereas 8.6% of the obese group and 9.5% of the
Variables Mean ± SD Cut-off point N (%) Body mass index
Significance Underweight Normal weight Obese
Height (cm) 156.0 ± 4.51) < 154 cm 12 (5.7)
162.4 ± 4.4b 159.9 ± 4.3a 159.2 ± 4.7a 0.052)
≥ 154 cm 200 (94.3)
Weight (kg) 55.7 ± 6.3 < 52.2 kg 74 (34.9)
47.5 ± 2.9a 54.0 ± 4.0b 62.5 ± 5.2c 0.05
≥ 52.2 kg 138 (65.1)
BMI (kg/m2) 21.8 ± 2.3
BMI < 18.5 21 (10.0)
18.0 ± 0.5 21.1 ± 1.1 24.6 ± 1.4 0.05
18.5 kg/m2≤ BMI < 22.9 131 (62.5)
BMI ≥ 23 58 (27.6)
1)Mean ± SD
2)Significant at P< 0.05 by ANOVA
Values with different letter were significantly different among the groups at *P< 0.05 by Duncan's multiple range test.
BMI : body mass index (kg/m2)
Cut-off point : KDRIs [50~64 years adults (woman) : height 154 cm, weight 52.2 kg]
Table 1. Physical characteristics of subjects by body mass index
Eating habits Underweight Normal weight Obese Significance
Meal times Regularly 5 (23.8) 58 (43.6) 24 (41.4)
0.051)
Sometimes 12 (57.1) 63 (47.4) 27 (46.6)
Irregularly 4 (19.1) 12 (9.0) 7 (12.0)
Total 21 (100) 133 (100) 58 (100)
Breakfast Every day 7 (33.4) 67 (50.4) 35 (60.3)
NS2)
5~6 times/week 5 (23.8) 22 (16.5) 8 (13.8)
3~4 times/week 5 (23.8) 26 (19.5) 3 (5.2)
1~2 times/week 2 (9.5) 13 (9.8) 7 (12.1)
Not at all 2 (9.5) 5 (3.8) 5 (8.6)
Total 21 (100) 133 (100) 58 (100)
Reason of skipping meal Too busy 8 (57.1) 58 (58.0) 26 (70.3)
NS
Due to previous overeat - 11 (11.0) 7 (18.9)
Hate to prepare 2 (14.3) 19 (19.0) 3 (8.1)
Oversleep 4 (28.6) 12 (12.0) 1 (2.7)
Total 14 (100) 100 (100) 37 (100)
Overeating Almost Never 11 (52.4) 48 (36.1) 16 (27.6)
Sometimes 10 (47.6) 82 (61.6) 36 (62.1) NS
Often - 3 (2.3) 6 (10.3)
Total 21 (100) 133 (100) 58 (100)
Reason of overeating Hungry 4 (25.0) 25 (21.6) 14 (28.6)
0.05
Delicious food 12 (75.0) 58 (50.0) 24 (49.0)
Habitually - 11 (9.4) 5 (10.2)
Get rid of stress - 22 (19.0) 6 (12.2)
Total 16 (100) 116 (100) 49 (100)
Eating out Almost Never 5 (23.8) 63 (47.4) 36 (62.1)
Sometimes 12 (57.1) 55 (41.4) 18 (31.0) 0.05
Often 4 (19.0) 15 (11.3) 4 (6.9)
Total 21 (100) 133 (100) 58 (100)
Kind of preference for food Korean dishes 13 (81.3) 60 (85.7) 15 (68.2)
NS
Western food 3 (18.7) 8 (11.4) 4 (18.2)
Chinese dishes - 2 (2.9) 2 (9.1)
Fast food - - 1 (4.5)
Total 16 (100) 70 (100) 22 (100)
Unbalanced meals Almost Never 1 (4.8) 4 (3.0) 4 (6.9)
Sometimes 8 (38.1) 55 (41.4) 18 (31.0) 0.05
Often 12 (57.1) 74 (55.6) 36 (62.1)
Total 21 (100) 133 (100) 58 (100)
1)Significant at P< 0.05 by χ2-test
2)NS : Not significantly different at P< 0.05 by χ2-test Table 2. Stratified eating habits of housewives
Underweight Normal weight Obese
Very often Sometimes Seldom Very often Sometimes Seldom Very often Sometimes Seldom Milk & its products, daily 8 (38.1)1) 8 (38.1) 5 (23.8) 34 (25.8) 58 (43.9) 40 (30.3) 9 (15.5) 29 (50.0) 20 (34.5) Meat, fish, egg, soybean etc, every
meal
7 (33.3) 11 (52.4) 3 (14.3) 50 (37.9) 66 (50.0) 16 (12.1) 25 (43.1) 27 (46.6) 6 (10.3)
Kimchi, vegetables, every meal 9 (42.9) 9 (42.9) 3 (14.3) 66 (50.0) 56 (42.4) 10 (7.6) 23 (39.7) 30 (51.7) 5 (8.6) Fruits & other juices, daily 11 (52.4) 5 (23.8) 5 (23.8) 57 (43.2) 55 (41.7) 20 (15.2) 29 (46.6) 21 (36.2) 10 (17.2) Fried foods, more than 2 times per
week
8 (38.1) 5 (23.8) 8 (38.1) 25 (18.9) 59 (44.7) 48 (36.4) 10 (17.2) 28 (48.3) 20 (34.5) High fat meat, more than 2 times per
week
4 (19.0) 11 (52.4) 6 (28.6) 9 (6.8) 51 (38.6) 72 (54.5) 5 (8.6) 19 (32.8) 34 (58.6)
Add more salt or soy source at meals 2 (9.5) 5 (23.8) 14 (66.7) 6 (4.5) 49 (37.1) 77 (58.3) 8 (13.8) 23 (39.7) 27 (46.6) 3 meals a day, regularly 7 (33.3) 8 (38.1) 6 (28.6) 57 (43.2) 49 (37.1) 26 (19.7) 27 (46.6) 19 (32.8) 12 (20.7) Ice cream, cake, cookies, carbonated
drinks as snack, more than 2 times per week
5 (23.8) 6 (28.6) 10 (47.6) 11 (8.3) 31 (23.5) 90 (68.2) 6 (10.3) 17 (29.3) 35 (60.3)
Variety of food (balanced diet) 11 (52.4) 8 (38.1) 2 (9.5) 71 (53.8) 49 (37.1) 12 (9.1) 28 (48.3) 25 (43.1) 5 (8.6)
1)N (%) : number of adults, the relative % of adults
Table 3. Mini dietary assessment of housewives by healthy eating index
Mini Dietary Assessment
Grade§ Score Frequency (%) Underweight Normal weight Obese Average (Mean ± SD)
Good 30-26 27 (12.7) 6 (28.6) 17 (12.8) 4 (6.9) 21.9 ± 2.9
Fair 25-18 172 (81.1) 11 (52.4) 109 (82.0) 52 (89.7) 21.9 ± 2.9
Poor ≤ 17 13 (6.1) 4 (19.0) 7 (5.3) 3 (3.4) 21.9 ± 2.9
§Good = Answered 1-2 items as sometimes or seldom Fair = Answered 3-6 items as sometimes or seldom Poor = Answered more than 7 items as sometimes or seldom
※ Average value for each questionnaire are stratified as very often : 3 points, sometimes : 2 points, seldom : 1 point.
※ Mini dietary assessment total scores : add more salt or soy source at meals and ice cream, cake, cookies, carbonated drinks as snack, more than 2 times per week stratified as very often: 1 point, sometimes : 2 points, seldom : 3 points
Table 4. Distribution of dietary quality of housewives graded by mini dietary assessment score
15.0
65.0
0.0 16.2
63.8
50.0
6.2
3.1 59.3
50.0
1.9 15.0*
60.0
5.6*
24.1*
0.0 10.0 20.0 30.0 40.0 50.0 60.0 70.0
Milk & its products Fruits Bread, potato Carbonated drinks, ices
Fast food, fried food
Kinds of snacks
%
Underweight Normal weight Obes e
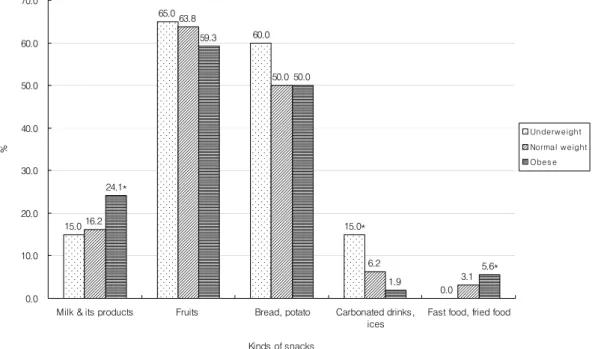
Fig. 1. Preference for snacks of housewives. * Significant at P< 0.05 by χ2-test
underweight group never ate breakfast. The major reason for not eating breakfast was being too busy in the morning. Moreover,
52.4% of underweight, 36.1% of normal, and 27.6% of obese
individuals never overate, whereas 2.3% of normal and 10.3%
Nutrients1) Underweight Normal weight Obese
Significance
Mean ± SD %EER3) %RI4) %AI5) Mean ± SD %EER %RI %AI Mean ± SD %EER %RI %AI
Energy (kcal) 2,223.6 ± 654.02) 117.0 - - 2,220.4 ± 674.9 169.9 - - 2,184.5 ± 604.8 115.0 - - NS6)
Carbohydrate (g) 357.1 ± 127.8 - - - 386.2 ± 160.6 - - - 396.6 ± 164.1 - - - NS
Protein (g) 101.6 ± 53.8 - 225.8 - 100.7 ± 53.1 - 223.8 - 101.5 ± 46.3 - 225.6 - NS
Fat (g) 64.3 ± 41.5 - - - 54.3 ± 33.4 - - - 55.7 ± 30.7 - - - NS
Vitamin A (μgRE) 1,104.1 ± 607.7 - 169.9 - 1,200.1 ± 631.1 - 184.6 - 1,262.4 ± 683.6 - 194.2 - NS
Vitamin B1 (mg) 1.8 ± 0.9 - 163.6 - 1.9 ± 0.9 - 172.7 - 2.1 ± 1.4 - 190.9 - NS
Vitamin B2 (mg) 2.1 ± 1.0 - 175.0 - 2.0 ± 1.1 - 166.7 - 2.1 ± 1.2 - 175.0 - NS
Vitamin B6 (mg) 2.7 ± 1.2 - 192.9 - 3.0 ± 1.6 - 214.3 - 2.9 ± 1.3 - 207.1 - NS
Niacin (mg) 19.7 ± 9.1 - 140.7 - 19.3 ± 8.2 - 137.9 - 19.3 ± 7.6 - 137.9 - NS
Vitamin C (mg) 135.6 ± 64.4 - 135.6 - 151.3 ± 67.5 - 151.3 - 153.5 ± 58.7 - 153.5 - NS
Vitamin E (mg) 15.5 ± 9.5 - - 155.0 15.4 ± 7.6 - - 154.0 16.5 ± 8.1 - - 165.0 NS
Folic acid (μg) 339.9 ± 160.9a - 85.0 - 417.3 ± 172.8ab - 104.3 - 449.6 ± 193.7b - 112.4 - 0.057)
Calcium (mg) 1,116.6 ± 400.0 - 159.5 - 1,147.9 ± 568.1 - 164.0 - 1,166.0 ± 521.7 - 166.6 - NS
Iron (mg) 20.8 ± 9.0 - 148.6 - 23.9 ± 13.8 - 170.7 - 24.0 ± 11.6 - 171.4 - NS
Zinc (mg) 12.7 ± 6.0 - 158.8 - 13.7 ± 7.3 - 171.3 - 14.3 ± 8.0 - 178.8 - NS
Phosphorus (mg) 1,599.9 ± 701.3 - 228.6 - 1,628.8 ± 765.9 - 232.7 - 1,634.8 ± 697.2 - 233.5 - NS
Sodium (mg) 5,247.2 ± 2,285.3 - - 349.8 5,517.0 ± 2,133.8 - - 367.8 5,722.7 ± 3,131.4 - - 381.5 NS
Fiber (g) 31.9 ± 14.6 - - 138.7 36.4 ± 18.8 - - 158.3 36.3 ± 16.1 - - 157.8 NS
Cholesterol (mg) 369.2 ± 203.7 - - - 304.5 ± 154.4 - - - 315.8 ± 160.4 - - - NS
1)KDRIs : Dietary Reference Intakes for Koreans, 2005
2)Mean ± SD
3)EER : Estimated energy requirements
4)RI : Recommended intake
5)AI : Adequate intake
6)NS : statistically no significant difference at P< 0.05 by ANOVA
7)Significant at P< 0.05 by ANOVA
Values with different letter were significantly different among the groups at *P< 0.05 by Duncan's multiple range test.
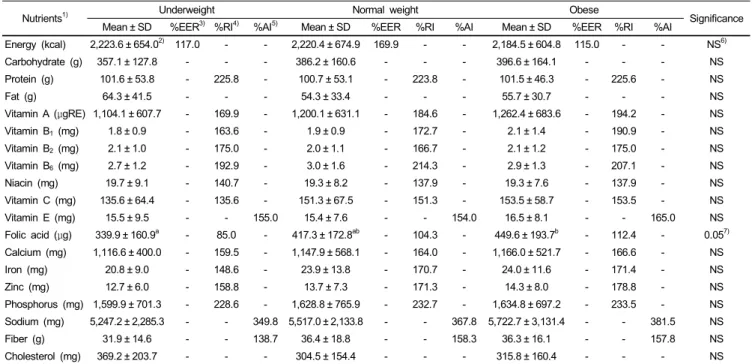
Table 5. Nutrient intakes calculated by food frequency questionnaire
of obese individuals frequently overate. The most common reason reported for overeating was that the meal was delicious (P <
0.05). A total of 23.8% of underweight, 47.4% of normal, and 62.1% of obese individuals never ate out (P < 0.05). Those that did eat out favored Korean food. Finally, 57.1% of underweight, 55.6% of normal, and 62.1% of obese individuals ate an unbalanced diet frequently, whereas 3.0% of normal and 6.9%
of obese individuals did not eat an unbalanced diet (P < 0.05).
Mini dietary assessment
A mini dietary assessment of housewives is shown in Table 3. Among the underweight group, 38.1% of subjects reported that they consumed more than one bottle of milk and its products, 52.4% of subjects ate more than one serving of fruit or one cup of fruit juice, and 52.4% of subjects ate a variety of foods everyday. Among the underweight group, 38.1% of subjects ate fried or roasted food more than twice a week.
Among the normal group, 50.0% of subjects reported that they ate vegetables besides kimchi, and 43.2% stated that they ate one piece of fruit and drank one cup of fruit juice daily.
Additionally, 43.2% of the normal group ate three meals a day and 53.8% ate a variety of foods. Among the obese group, 46.6%
of subjects ate one serving of fruit and drank one cup of fruit juice daily, 46.6% of subjects regularly ate three meals, and
48.3% ate a variety of foods. Meanwhile, 13.8% of housewives added source or salt to their meal.
The average value in the dietary assessment was 21.9 ± 2.9 (Table 4). Overall, 12.7% of subjects assessed their diet as good, 81.1% as fair, and 6.1% as poor. In addition, 28.6% of underweight, 12.8% of normal, and 6.9% of obese individuals reported that their dietary assessment was good.
Intakes snacks
The rates of snack intake are shown in Fig. 1. Compared to other groups, the rate of snack intake was highest (15.0%) in the underweight group (P < 0.05). Among obese individuals, the rates of intake of milk and its products (24.1%) and fast and fried foods (5.6%) was higher compared to those of other groups (P < 0.05).
Intake of nutrients
The rates of nutrient intake are shown in Table 5. The average energy intakes and intake rates of the underweight, normal, and obese groups were 2,223.6 ± 654.0 kcal (117.0%), 2,220.4 ± 674.9 kcal (169.9%), and 2,184.5 ± 604.8 kcal (115.0%), respectively.
The rates of protein intake of the underweight, normal, and
obese groups were 225.8%, 223.8%, and 225.6%, respectively.
Underweight Normal weight Obese Significance
Daily the sleeping hours
< 3 hours - 1 (0.8) -
NS1)
4-5 hours 5 (23.8) 22 (16.7) 9 (15.5)
6-8 hours 12 (57.1) 98 (74.2) 41 (70.7)
> 8 hours 4 (19.0) 11 (8.3) 8 (13.8)
Total 21 (100.0) 132 (100.0) 58 (100.0)
Exercise
Yes 14 (66.7) 83 (62.9) 37 (63.8)
NS
No 7 (33.3) 49 (37.1) 21 (36.2)
Total 21 (100.0) 132 (100.0) 58 (100.0)
Frequency of weekly exercise
1-2 times/W 5 (35.7) 25 (30.1) 16 (43.2)
NS
3 times/W 6 (42.9) 31 (37.3) 9 (24.3)
4-5 times/W 3 (21.4) 20 (24.1) 10 (27.0)
Every day - 7 (8.4) 2 (5.4)
Total 14 (100.0) 83 (100.) 37 (5.4)
Duration of daily exercise
< 30 minutes 2 (14.3) 8 (9.5) 7 (18.9)
NS
30 minutes - 1 hour 8 (57.1) 44 (52.4) 13 (35.1)
1 hour - 2 hours 3 (21.4) 21 (25.0) 14 (37.8)
≥ 2 hour 1 (7.1) 10 (13.1) 3 (8.1)
Total 14 (100.0) 83 (100.) 37 (5.4)
Show interest in health
Very often 6 (28.6) 22 (16.7) 7 (12.1)
Sometimes 10 (47.6) 67 (50.8) 30 (51.7) NS
Almost never 5 (23.8) 43 (32.6) 21 (36.2)
Total 21 (100.0) 132 (100.0) 58 (100.0)
A key to health
A good rest & sleep 7 (35.0) 42 (32.3) 12 (21.4)
NS
Regular exercise 8 (40.0) 48 (36.9) 22 (39.3)
Regular meals & taking nutrition 4 (20.0) 32 (24.6) 16 (28.6)
Prohibition of smoking & drinking 1 (5.0) 4 (3.1) 6 (10.7)
Supplement intake - 4 (3.1) -
Total 20 (100.0) 130 (100.0) 56 (10.7)
1)NS : Not significantly different at P< 0.05 by χ2-test Table 6. Selected physiological characteristics of housewives
Underweight Normal weight Obese Significance
Take supplements
Yes 14 (66.7) 90 (68.7) 33 (57.9)
NS1)
No 7 (33.3) 41 (31.3) 24 (42.1)
Total 21 (100.0) 131 (100.0) 57 (100.0)
Type of supplements
Chinese medicine 1 (8.3) 5 (6.0) 3 (11.1)
NS Synthesis medicine (multiple vitamin & mineral) 6 (50.0) 31 (37.8) 9 (33.3)
Vitamin C 5 (41.7) 37 (45.1) 14 (51.9)
Some kind of Ca or Fe 2 (16.7) 17 (20.7) 7 (25.9)
Total 14 (100.0) 90 (100.0) 33 (100.0)
Disease
Yes 3 (14.3) 20 (15.3) 14 (24.1)
NS
No 18 (85.7) 111 (84.7) 44 (75.9)
Total 21 (100.0) 131 (100.0) 58 (100.0)
Kind of disease
Hypertension - 2 (11.8) 6 (43.0)
NS
Thyroid disease 1 (50.0) 2 (11.8) 3 (21.4)
Diabetes - - 2 (14.3)
Arthritis - 2 (11.8) 1 (7.1)
Hypercholesterol - 2 (11.8) 1 (7.1)
Etcetera 1 (50.0) 9 (52.8) 1 (7.1)
Total 2 (100.0) 17 (100.0) 14 (100.0)
Influenza
Yes 7 (33.3) 27 (20.8) 10 (17.2)
NS
No 14 (66.7) 103 (79.2) 48 (82.8)
Total 21 (100.0) 130 (100.0) 58 (100.0)
1)NS : Not significantly different at P< 0.05 byχ2-test Table 7. Supplement intake and disease rates of housewives
The rates of intake of vitamin A in the underweight, normal, and obese groups were 1,104.1 ± 607.7 μgRE (169.9%), 1,200.1
± 631.1 μgRE (184.6%), and 1,262.4 ± 683.6 μgRE (194.2%), respectively. No significant differences were observed in the intake of vitamin B
1, B
2, and B
6. The rates of niacin intake in the underweight, normal, and obese groups were 140.7%, 137.9%
and 137.9%, respectively. The rates of intake of vitamin C in the underweight, normal, and obese groups were 135.6%, 151.3%, and 153.5%, respectively.
The rates of folic acid intake in the underweight, normal, and obese group were 339.9 ± 160.9 μg (85%), 417.3 ± 172.8 μg (104.3%), and 449.6 ± 193.7 μg (112.4%), respectively (P <
0.05). The rates of intake of vitamin E, calcium, iron, and zinc in the obese group were 16.5 ± 8.1 mg (165.0%), 1,166.0 ± 521.7 mg (166.6%), 24.0 ± 11.6 mg (171.4%), and 14.3 ± 8.0 mg (178.8%), respectively. The rates of intake of phosphorus among the underweight, normal, and obese groups were 228.6%, 232.7%, and 233.5%, respectively. The sodium intake rates in the underweight, normal, and obese groups were 349.8%, 367.8%, and 381.5%, respectively. The intake rates of cholesterol in the underweight, normal, and obese groups were 369.2 ± 203.7 mg, 304.5 ± 154.4 mg, and 315.8 ± 160.4 mg, respectively.
Health habit
The health habits of housewives are shown in Table 6. The average sleeping time was 6-8 hours, with 57.1% of underweight, 74.2% of normal, and 70.7% of obese individuals falling within that range. Additionally, 66.7% of underweight, 62.9% of normal, and 63.8% of obese individuals exercised regularly, with 42.9%
of underweight and 37.3% of normal individuals exercising three times weekly and 43.2% of obese individuals exercising 1 or 2 times a week. Duration of exercise in the underweight (57.1%) and normal group (52.4%) was 30 min to 1 hour, whereas 37.8%
of the obese group exercised for only 1 to 2 hours weekly.
Overall, 28.6% of underweight, 16.7% of normal, and 12.1%
of obese individuals appeared to have interest in health. All three groups reported that the major important factor for health was regular exercise.
Intake of supplement and disease
Intake of supplements and rates of disease are shown in Table 7. A total of 66.7% of underweight, 68.7% of normal, and 57.9%
of obese individuals reported that they took health supplements.
Among supplements, the rate of intake of vitamins was highest, followed by intake of synthetic medicine, calcium, and iron in order of decreasing amount.
Overall, 24.1% of the respondents reported that they are ill.
Among the obese group, 43.0% had hypertension, 21.4% had thyroid disease, and 14.3% suffered from diabetes. In addition, 33.3% of underweight, 20.8% of normal, and 17.2% of obese individuals had influenza at the time of the survey.
Discussion
This study evaluated 212 female subjects (aged 45 to 60 years) in Seoul and the Kyunggi area to determine their rates of obesity through BMI and dietary factors related to obesity, including dietary habits, dietary assessment, and nutrient intake. The average height and weight of the subjects were 2 cm higher and 3.5 kg heavier, respectively, than the average values [28].
The rates of height and weight that were larger than normal values were 94.3% and 65.1%, respectively. For the underweight group, height was larger than the standard value while the weight was below normal. Among obese individuals, height was the same as the standard value while the weight was an average of 8.5 kg above normal. Overall, underweight, normal, and obese individuals comprised 10.0%, 62.5%, and 27.6% of the total group, respectively, when stratified according to BMI (P < 0.05).
Rhie et al. [29] previously reported that the average height and weight are 156 cm and 54 kg, respectively, in the Youngin area, whereas Choi et al. [30] showed that the average height and weight are 160.20 cm and 54.05 kg, respectively, in the Daejun area.
The results of the present study indicate that 23.8% of underweight individuals ate regularly three daily meals, implying that underweight subjects ate three regular meals less often than normal and obese individuals (P < 0.05). Lee and Shim [31]
reported that 61.8% of women in Seoul did not regularly eat three meals a day.
More than 50% of normal and obese subjects ate breakfast daily, whereas only 33.4% of underweight subjects answered that they regularly ate breakfast. The primary reason for skipping breakfast was being busy. Choi et al. [32] reported that 56.8%
of subjects regularly eat breakfast, whereas Park et al. [33] found that 68.7% of subjects regularly eat breakfast and 10.6% of subjects never eat breakfast. Additionally, Lim and Na [34]
reported that 43.7% of subjects eat breakfast and 39.8% of subjects do not eat breakfast because they are too busy, which is similar to the results of the present study.
In the present study, 35.4% of all subjects reported that they never overate (52.4% of underweight subjects never overate, and 2.3% of normal subjects and 10.3% of obese individuals frequently overate). The main reason for overeating was that the food was delicious (P < 0.05). Additionally, a total of 49.1% of all subjects reported that they never ate out, whereas 62.1% of obese subjects never ate out (P < 0.05).
Among the underweight group, the rates of intake of milk and
its products as well as one serving of fruit and one cup of fruit
juice were high, and a greater percentage (52.4%) of these
subjects ate a balanced diet compared to the obese group. In
the normal group, the rates of eating vegetables other than kimchi
as well as one serving of fruit and one cup of fruit juice were
higher than in the other groups, and a high percentage of these
subjects ate three balanced meals daily. Among the obese group,
the rates of eating one serving of fruit, one cup of fruit juice,
and eating a balanced diet was high.
The average dietary assessment was 21.9 ± 2.9. Overall, 12.7%
of the subjects answered that their dietary life was good; however, only 6.9% of obese individuals reported that their dietary assessment was good.
Among underweight subjects, the rate of intake of carbonated drinks and ice was significantly higher than those of other groups (P < 0.05). In the obese group, the rate of intake of milk and its products was 24.1%, whereas that of fast food and fried food was 5.6%, and these rates were higher compared to those of the normal group (P < 0.05).
Average energy intake rates of the underweight, normal, and obese groups were 2,223.6 ± 654.0 kcal (117.0%), 2,220.4 ± 674.9 kcal (169.9%), and 2,184.5 ± 604.8 kcal (115.0%), respectively.
These values were higher than the KDRI values (EAR: 1,800 kcal) for the groups [28]. In a previous study [29], it was reported that the daily energy intake of women in the Youngin area is 1,770.3 ± 249.2 kcal. Jang [35] showed that the daily energy intake is 2,123.7 ± 518.4 kcal. Additionally, Park and Choi [36]
reported that the energy intake of women in the Taegu area is 2,247.0 ± 415.0 kcal, with that of obese individuals being 2,157.0
± 375.0 kcal. These differences in energy intake among studies are likely due to differences in survey time and area. The rates of intake of protein, vitamin A, vitamin B
1, B
2, and B
6, niacin, vitamin C, and vitamin E in all three groups were higher than the KDRI values [28].
The average intakes of folic acid in the underweight, normal, and obese groups were 339.9 ± 160.9 μg (85%), 417.3 ± 172.8 μ g (104.3%), and 449.6 ± 193.7 μg (112.4%), respectively (P <
0.05). The intake rate of folic acid in the obese group was significantly higher than those of the underweight and normal groups (P < 0.05). Folic acid plays a crucial role in the synthesis of amino acids, nucleic acids, formation of red blood cells, cell growth, hematogenus function, fetal growth, and anabolism, especially during pregnancy [37]. Macrocytic anemia, abortion, and retardation of nerve growth are all associated with folic acid deficiency [38]. Therefore, intake of folic acid must be increased by women during pregnancy.
The rates of calcium, zinc, and sodium intake were in excess compared to the KDRI values [28]. Sodium intake rates of the underweight, normal, and obese individuals in this study were 349.8%, 367.8%, and 381.5%, respectively. In previous reports [29,39], it was reported that sodium intake was 4,330.0 ± 1,779.2 mg and sodium intake was too high (5,190 mg) in some industry.
Chang [40] suggested low sodium intake during growth before reaching middle age, since excess sodium intake is associated with hypertension. Accordingly, Chang [40] stated that sodium intake should be kept low in processed foods and printed clearly on the packaging. Further, foods high in dietary fiber such as vegetables or fruits are recommended to be consumed everyday.
Cholesterol intake rates in the underweight, normal, and obese groups were 369.2 ± 203.7 mg, 304.5 ± 154.4 mg, and 315.8 ±
160.4 mg, respectively. In a previous study [41], it was recom-
mended that one’s cholesterol intake be under 300 mg daily and 100 mg per 1,000 kcal in order to prevent cardiovascular disease.
In this study, it appeared that cholesterol intake was higher compared to a previous report [41]. In another report [42], nutrient intake varied according to the sample area. For example, fat intake was high in Taegu area, whereas intake of iron, vitamin B
1, B
2, niacin, and vitamin C was high on Hansan island.
The average sleeping time of subjects was 6 to 8 hours. A total of 66.7% of underweight, 62.9% of normal, and 63.8% of obese individuals reported that they spent time exercising.
Specifically, the average frequency of weekly exercise for underweight and normal individuals was three times, whereas 43.2% of the obese group exercised one or two times weekly.
Duration of exercise for the underweight and normal group was 30 minutes to 1 hour, whereas 37.8% of obese individuals exercised for 1 to 2 hours per week. The most important factor for health among all three groups was exercise. Middle-aged women had endocrinal problems and chronological syndromes related to post-menopause [43]. It has been shown that management of health factors related to chronological diseases is necessary during middle age to achieve longevity [44].
Education regarding exercise and nutrition has been shown to be necessary to prevent obesity and metabolic diseases [43].
Accordingly, the moderated of exercise for middle-aged women must be preferred them unreasonable diet. In a previous study [40], 56.0% of women answered that a controlled diet and exercise are essential to maintain health. In addition, 52.7% of subjects agreed that they must lose weight. The rate of supplement intake was low in the obese group. The most common supplement among all subjects was vitamin tablets, followed by synthetic medicine, calcium, and iron tablets in order of decreasing amount. Lee et al. [45] has reported that the reasons for taking supplements are maintenance of health, to supply nutrients, and recover from tiredness.
A total of 24.1% of the obese group suffered from disease at the time of the survey. The most common disease was hypertension (43.0%). Further, 33.3% of underweight subjects were susceptible to influenza. Therefore, this study concluded that women in the underweight group must eat a balanced, regular diet to raise their level of immunity against influenza infection.
The results of this study show that the underweight group tended to not eat three regular meals daily and had very low rate of eating breakfast. Conversely, the rate of overeating among the underweight group was low, although the rates of consuming milk and its products as well as one serving of fruit and one cup of fruit juice per day were high. Women in the underweight group also consumed carbonated drinks and ice frequently, resulting in lower folic acid intake compared to standard values.
Women in the obese group commonly ate one serving of fruit
and one cup of fruit juice daily, and they tended to consume
nutrients in excess. The rate of hypertension was high among
obese women, although their frequency and duration of exercise
were greater than those of the underweight and normal groups.
In conclusion, the results of this study demonstrate that it is essential not to consume excessive amounts of nutrients. New programs to assess dietary habits and diagnose health status should be developed to enable maintenance of physical health among the respondents.
References
1. Kim WK. A study on the housemaker's interest in dietary life and the knowledge of cooking principle and method. J Korean Soc Diet Cult 1992;7:157-71.
2. Choi J, Chung YJ. Evaluation of diet quality according to food consumption between highly educated, married, unemployed and employed women. Korean J Nutr 2006;39:274-85.
3. Shin KO, Yoon JA, Lee JS, Chung KH. A comparative study of the dietary assessment and knowledge of (full-time) housewives and working (job-holding) housewives. J East Asian Soc Dietary Life 2010;20:1-10.
4. Lee KJ. A study on recognition and consumption about instant food of homemakers in Inchon. J East Asian Soc Dietary Life 1995;5:299-307.
5. Kim SK, Kim HJ. Comparison of the blood lipids, insulin and nutrients intake by fat distribution of obese male in Korea.
Korean J Nutr 1998;31:72-9.
6. Huh KB. The present status of nutrition-related diseases and its countermeasures. Korean J Nutr 1990;23:197-207.
7. Moon HK, Lee HJ, Park Y. Comparison of health status and dietary habits by percent body fat (PBF) change for adult women in the weight control program by the community health center.
Korean J Community Nutr 2007;12:477-88.
8. Lee HS, Lee JA, Paik JJ. A study of food habits, physical status and related factors of college students in Chuncheon. Korean J Community Nutr 1998;3:34-43.
9. Matuschka P. Diabetes and 'normal' lifestyle. Am Fam Physician 1995;52:2011-2.
10. Lee J, Lee H, Yim J, Kim Y, Choue R. Effects of medical nutrition therapy on changes of anthropometric measurements, dietary pattern and blood parameters in over weight or obese women. Korean J Nutr 2005;38:432-44.
11. Lee K, Kim E, Kim M. Iron nutritional status of female students in Kangnung National University. Korean J Community Nutr 1997;2:23-32.
12. Sira N, Pawlak R. Prevalence of overweight and obesity, and dieting attitudes among Caucasian and African American college students in Eastern North Carolina: a cross-sectional survey. Nutr Res Pract 2010;4:36-42.
13. Zhang M, Binns CW, Lee AH. Dietary patterns and nutrient intake of adult women in south-east China: a nutrition study in Zhejiang province. Asia Pac J Clin Nutr 2002;11:13-21.
14. Han Y, Joo N. An analysis on the factors of adolescence obesity.
Korean J Food Cult 2005;20:172-85.
15. Ahn MS, Chang IY, Kim KH. Comparisons of UCP2 polymorphism, dietary habits, and obesity index in normal and obese university students. Korean J Food Cult 2007;22:404-13.
16. Choi KS, Shin KO, Chung KH. Comparison of the dietary pattern, nutrient intakes, and blood parameters according to body mass index (BMI) of college women in Seoul area. J Korean Soc Food Sci Nutr 2008;37:1589-98.
17. Lee KJ. A survey on the status of the housemakers' meal management in Jeonbuk area. J Korean Soc Diet Cult 1991;6:
403-11.
18. Yoo YS. A study on the survey of the meal management. J Korean Home Econ Assoc 1980;18:53-67.
19. Kim MR. A study on the status of the employed and housewives' meal management in Daejeon city. J Korean Soc Food Nutr 1984;13:107-16.
20. Lee JH. A survey on the status of the meal management behaviors of housewives living in the apartment of Jinju. Korean J Community Nutr 2001;6:755-64.
21. Park YS. Food management pattern and preception of housewives in Yuanbean area. J East Asian Soc Dietary Life 2001;11:430-45.
22. Jang MS, Hwang JH. Research on the status of the meal management and nutritional knowledge of the housewives living in Yong-dong area. J Korean Soc Food Nutr 1984;13:389-96.
23. Yoon GA. The relation of educational level and life-style behaviors to obesity in adult males. Korean J Nutr 2004;37:
385-93.
24. Kang HW, Lee SS. Obesity and weight control prevalence of middle school students in Seoul Gyeonggi area. Korean J Nutr 2006;39:674-83.
25. Lee DH. A study on SOD activity and serum antioxidant mineral concentrations in obese adolescents. Korean J Nutr 2007;40:41-8.
26. Kim WY, Cho MS, Lee HS. Development and validation of mini dietary assessment index for Koreans. Korean J Nutr 2003;36:
83-92.
27. Lim Y, Oh SY. Development of a semi-quantitative food frequency questionnaire for pre-school children in Korea. Korean J Community Nutr 2002;7:58-66.
28. The Korean Nutrition Society. Dietary Reference Intakes for Koreans. Seoul, Korea; 2006.
29. Rhie SG, Lee DT, Kim HN, Kim AJ, Sung CJ. The comparison mineral intakes with serum lipids and minerals in some rural housewives. J Korean Soc Food Nutr 1990;19:411-17.
30. Choi J, Lee TY, Chung YJ. Factors influencing a health- promoting lifestyle among highly educated, married, employed and unemployed women. Korean J Nutr 2002;35:1089-103.
31. Lee HG, Shim JS. A study on the relationship between dietary habits status of the middle-aged adults. J Korean Home Econ Assoc 1999;37:17-27.
32. Choi MK, Kim JM, Kim JG. A study on the dietary habit and health of office workers in Seoul. Korean J Food Cult 2003;18:
45-55.
33. Park YS, Myung CO, Lee KW, Nam HW. A study on the well-being related awareness and dietary life pattern in urban housewives. Korean J Food Cult 2005;20:574-83.
34. Lim YH, Na MI. A survey on dining-out behaviors and food habits of housewives in Daejon. Korean J Food Cult 2008;23:1-9.
35. Jang HS. A study on nutrient intake of rural housewives. J Korean Soc Food Nutr 1991;20:433-9.
36. Park KS, Choi YS. A study on prevalence of obesity and its related factors in housewives residing in apartments in Taegu.
Korean J Nutr 1990;23:170-8.
37. Lim HS, Jin HO, Lee JA. Dietary intakes and status of folate in Korean women of child-bearing potential. Korean J Nutr 2000;33:296-303.
38. Hibbard BM. Folate and fetal development. Br J Obstet Gynaecol 1993;100:307-9.
39. Yoon YO, Kim ES, Ro HK. Sodium intakes of some industrial
workers. Korean J Nutr 1990;23:37-43.
40. Chang SO. The amount of sodium in the processed foods, the use of sodium information on the nutrition label and the acceptance of sodium reduced ramen in the female college students. Korean J Nutr 2006;39:585-91.
41. Lee MS, Kwak CS. The comparison in daily intake of nutrients quality of diets and dietary habits between male and female college students in Daejeon. Korean J Community Nutr 2006;11:
39-51.
42. Park YS. A study on image and consumption about instant food of homemakers in Ullungdo, Hansando, and Daegu. J East Asian
Soc Dietary Life 1994;4:37-47.
43. Choi MS. Effects of nutrition education and exercise intervention on health and diet quality of middle-aged women. Korean J Nutr 2009;42:48-58.
44. Lee KJ, Chang CJ, Yoo JH, Yi YJ. Factors effecting health promoting behaviors in middle-aged women. J Korean Acad Nurs 2005;35:494-502.
45. Lee MY, Kim JS, Lee JH, Cheong SH, Chang KJ. A study on usage of dietary supplements and related factors in college students attending web class via internet. Korean J Nutr 2001;34:
946-55.