Impact of socio-demographic factors, lifestyle and health status on nutritional status among the elderly in Taiwan
Ghislain G. Poda
1,2, Chien-Yeh Hsu
3,4, Hsiao-Hsien Rau
5and Jane C.-J. Chao
1,4,6§1School of Nutrition and Health Sciences, College of Nutrition, Taipei Medical University, 250 Wu-Hsing Street, Taipei 110, Taiwan
2Ministry of Health, Avenue of Burkina, Ouagadougou 7035, Burkina Faso
3Department of Information Management, National Taipei University of Nursing and Health Sciences, 365 Ming-Te Road, Peitou District, Taipei 112, Taiwan
4Master Program in Global Health and Development, Taipei Medical University, 250 Wu-Hsing Street, Taipei 110, Taiwan
5Joint Commission of Taiwan, 5F, No. 31, Sec. 2, Sanmin Rd., Banqiao Dist., New Taipei City 220, Taiwan
6Nutrition Research Center, Taipei Medical University Hospital, 252 Wu-Hsing Street, Taipei 110, Taiwan
BACKGROUND/OBJECTIVES: Aging is an imperative problem for many countries in this century, and presents several challenges for the maintenance of good nutritional status. This study aims to assess the impact of socio-demographic factors, lifestyle and health status on the nutritional status among the elderly in Taiwan.
SUBJECTS/METHODS: A cross-sectional study was carried out in Taiwan. Data were obtained from the Mei Jau Health Management Institution, which is a private health evaluation provider with multiple health screening centers in Taiwan and Asia. This study included 7947 adults aged 65 years or above. The data were extracted between 2001 to 2010. Nutritional status was assessed using anthropometric data, biochemical data and dietary intake information.
RESULTS: Among the 7947 participants with mean age of 70.1 (SD = 4.5) years, 20.2%, 6.6%, 10.5% and 52.5% experienced underweight, protein malnutrition, anemia and inadequate dietary intake in the past month, respectively. Age was negatively correlated with body weight (r = -0.19, P = 0.02), body mass index (r = -0.41, P < 0.001), albumin level (r = -0.93, P < 0.001) and hemoglobin level (r = -0.30, P = 0.008). Age above 70 years, gender, unmarried status, retirement, lack of education, low family income, smoking, alcohol drinking, sleep duration of 6-8 hours, vegetarian diet, multiple medications, comorbidity and dysphagia were positively associated with malnutrition in older adults.
CONCLUSIONS: Underweight and inadequate dietary intake are prevalent among the elderly in Taiwan. Vegetarian diet, multiple medications, comorbidity, dysphagia and lifestyle factors such as smoking, alcohol drinking and sleep duration of 6-8 hours are risk factors for undernutrition in older adults.
Nutrition Research and Practice 2019;13(3):222-229; https://doi.org/10.4162/nrp.2019.13.3.222; pISSN 1976-1457 eISSN 2005-6168
Keywords: Undernutrition, lifestyle, diet, elderly, Taiwan
http://e-nrp.org
INTRODUCTION
5)The chronological age 65 years and above is defined as the later part of life, and most developed countries have accepted this definition for elderly or older people [1]. In 2010, an estimated 524 million people were aged 65 years or older, representing around 8% of the world population [2]. By 2050, the number of elderly is expected to nearly triple to about 1.5 billion, representing 16% of the world population. Aging is an imperative problem for many countries in this century, especially in developed countries such as Taiwan [3,4]. Taiwan is a small island located in East Asia, and the proportion of older adults aged 65 years or above has increased from 6.2% in 1990, to 8.6% in 2000 and 12.5% in 2015 [5]. The accelerated rate of aging in Taiwan is more than twice of European countries and the United States [6].
Aging is associated with the decline in appetite and food
consumption that, in turn, affects the nutritional status [7]. As the aging population continues to escalate, preventing malnutrition in the elderly has been identified as one of the best strategies for achieving healthy aging [8-11]. Older adults are vulnerable to malnutrition for many reasons, including weight loss, lack of financial support and inadequate access to food [7,12,13]. Previous studies report that socio-demographic characteristics and lifestyle are associated with nutritional status in older adults [12,14-16].
Ending hunger, ensuring healthy lives, and promoting well-being of all ages are the goals worldwide [17]. Previous studies have investigated the association between health characteristics and nutritional status [18-22], nutritional status and sleeping disorders [23,24], and malnutrition and feeding difficulty in older adults in Taiwan [8,25]. Identifying the elderly who are malnourished or at risk of malnutrition in the community setting is necessary to provide adequate nutritional
§Corresponding Author: Jane C.-J. Chao, Tel. 886-2-2736-1661 ext. 6548, Fax. 886-2-2737-3112, Email. chenjui@tmu.edu.tw Received: February 19, 2019, Revised: May 7, 2019, Accepted: May 14, 2019
This is an Open Access article distributed under the terms of the Creative Commons Attribution Non-Commercial License (http://creativecommons.org/licenses/by-nc/3.0/) which permits unrestricted non-commercial use, distribution, and reproduction in any medium, provided the original work is properly cited.
support, prevent further deterioration, and improve their quality of life. Therefore, it is important to assess the impact of socio-demographics, lifestyle and health characteristics on nutritional status in older adults in Taiwan. This study aims to assess the prevalence of undernutrition, and determine the association between socio-demographics, lifestyle and health status with nutritional status among the elderly in Taiwan.
SUBJECTS AND METHODS Study design and setting
A cross-sectional study was carried out in Taiwan. Data were obtained from the Mei Jau (MJ) Health Management Institution, which is a private health evaluation provider with multiple health screening centers in Taiwan and Asia. The multiple centers of the MJ Health Management Institution in Taiwan located in Taipei, Taoyuan, Taichung and Kaohsiung cities provide comprehensive health management services for their members in Taiwan.
Participants of study
This study included data of 482,641 Taiwanese subjects between 2001 and 2010, extracted from the MJ Health Management Institution database. The sample size was 316191 after excluding subjects with multiple entries, and included 19,215 participants aged 65 years or above. Of the 19,215 participants, 6,872 participants were further excluded due to missing data. After screening for exclusion of chronic diseases such as cardiovascular disease, cerebrovascular disease, diabetes mellitus or renal failure, and all types of cancer (n = 4,396), 7,947 adults aged 65 years or above were finally recruited for analyses (Fig. 1).
Ethical considerations
This study used the data extracted from the MJ Health Management Institution database. All participants read, understood and signed informed consent forms before data collection procedures by the MJ Health Management Institution, and the protocol was approved by the Taiwan National Health Research Ethics. The detailed information concerning the data collection procedure can be found at the Taiwan MJ Health Screening Centers. The MJ Health Management Institution delinked the data, and the data were anonymous without any information regarding the identity of participants. Additionally, this study was approved by the Taipei Medical University-Joint Institutional Review Board (TMU-JIRB No N201612035).
Socio-demographic characteristics, lifestyle and health status Socio-demographic characteristics, lifestyle and health status were collected using a self-reporting questionnaire, or was recorded face-to-face by the nurse prior to health screening.
Socio-demographic characteristics included age, gender, occupation, education level (uneducated with illiteracy or educated with elementary education or above), marital status and annual family income. Lifestyle factors, including cigarette smoking (no or yes), alcohol drinking (no or yes), betel nut chewing (no or yes) and daily sleeping duration (< 6 hours, 6 to 8 hours or ≥ 9 hours) were recorded. Health status such as
morbidity, medication use and swallowing difficulty (dysphagia) was also analyzed in this study.
Nutritional status
The nutritional status of the elderly was defined by using anthropometric indicators, biochemical data and dietary intake scores. In terms of anthropometric indicators, height (cm) and weight (kg) of older adults were obtained from medical records, and body mass index (BMI) was computed by dividing the body weight in kilograms by the square of body height in meters.
Underweight was defined as BMI < 18.5 kg/m
2as per the guidelines of the World Health Organization (WHO) [26] and the Ministry of Health and Welfare, Taiwan.
Biochemical data included serum albumin and blood hemoglobin (Hb) as protein status and anemia indicators, respectively. Blood samples were obtained during the health screening at the Taiwan MJ Health Screening Centers, and analysis of the collected blood samples was performed at the central laboratory of the MJ Health Management Institution.
Serum albumin level < 3.5 g/dL was defined as protein malnutrition. The WHO definition of anemia is blood Hb level
< 13 g/dL in men and < 12 g/dL in non-pregnant women [27].
Dietary intake in the past month was assessed using a food frequency questionnaire (FFQ). Fourteen individual food groups were analyzed in this study: rice, bread, instant noodles, root crops, legumes/beans, light-colored vegetables, dark and green leafy vegetables, fruits, milk, other dairy products, eggs, meat, seafood and organ meat. The dietary intake score ranged from 1 to 5, and was assigned for the consumption frequency of each food group, from the lowest to the highest. Consumption frequencies of the various foods were assessed as per their respective criteria, as follows: vegetables, < 0.5 bowl/day, 0.5-1 bowl/day, 1-1.5 bowls/day, 1.5-2 bowls/day and ≥ 2 bowls/day (a bowl equal to the size of 11 cm in diameter); milk, < 1 glass/week, 1-3 glasses/week, 4-6 glasses/week, 1 glass/day and
≥ 2 glasses/day (1 glass is equivalent to 240 mL); fruits and rice, < 1 serving/day, 1-2 servings/day, 2-3 servings/day, 3-4 servings/day and ≥ 4 servings/day; other food groups, < 1 serving/week, 1-3 servings/week, 4-6 servings/week, 1 serving/day and ≥ 2 servings/day. The dietary intake score was calculated according to dietary habits (vegetarians vs non-vegetarians).
Vegetarians included 6 categories of food groups: grains (rice,
bread and instant noodles), root crops, legumes/beans,
vegetables (light-colored vegetables and dark and green leafy
vegetables), fruits, and dairy products (milk and other dairy
products). Non-vegetarians included 7 categories of food
groups: 6 categories included for vegetarians, plus animal
products (eggs, meat, seafood and organ meat). Dietary intake
score of all categories of food groups was summed up. The
minimum and maximum dietary intake scores for grains, root
crops, legumes/beans, vegetables, fruits, dairy products and
animal products are 3-15, 1-5, 1-5, 2-10, 1-5, 2-10 and 4-20,
respectively. Dietary intake scores for vegetarians and non-
vegetarians ranged from 10 to 50 and from 14 to 70,
respectively. Inadequate dietary intake was defined as a dietary
intake score below the median of 30 for vegetarians, and 42
for non-vegetarians. The median was used as a cutoff to define
inadequate or adequate dietary intake as reported in previous
Characteristics
Dietary habit Total
(n = 7,947)
Non-vegetarian (n = 6,269)
Vegetarian
(n = 1,678) P-value
Age (yrs), Mean ± SD 70.1 ± 4.5 70.1 ± 4.6 70.0 ± 4.4 0.36
Gender, n (%) 0.16
Female 4,455 (56.1) 3,489 (55.7) 966 (57.6)
Male 3,492 (43.9) 2,780 (44.3) 712 (42.4)
Occupation, n (%) 0.75
Part-time job 657 (8.3) 525 (8.4) 132 (7.9)
Retired 3,300 (41.5) 2,606 (41.6) 694 (41.4)
Unemployed 3,990 (50.2) 3,138 (50.1) 852 (50.8)
Education level, n (%) < 0.001
Uneducated 1,520 (19.1) 1,401 (22.3) 119 (7.1)
Educated 6,427 (80.9) 4,868 (77.6) 1,559 (92.9)
Marital status, n (%) 0.12
Unmarried 2,361 (29.7) 1,888 (30.1) 473 (28.2)
Married 5,586 (70.3) 4,381 (69.9) 1,205 (71.8)
Annual family income, n (%) 0.93
< 400,000 NTD 4,458 (56.1) 3,518 (56.1) 940 (56.0)
≥ 400,000 NTD 3,489 (43.9) 2,751 (43.9) 738 (44.0)
Smoking, n (%) < 0.001
No 6,039 (76.0) 4,819 (76.9) 1,220 (72.7)
Yes 1,908 (24.0) 1,450 (23.1) 458 (27.3)
Alcohol drinking, n (%) < 0.001
No 4,601 (57.9) 4,211 (67.2) 390 (23.2)
Yes 3,346 (42.1) 2,058 (32.8) 1,288 (76.8)
Betel nut chewing, n (%) < 0.001
No 5,569 (70.1) 4,810 (76.7) 759 (45.3)
Yes 2,378 (29.9) 1,459 (23.3) 919 (54.7)
Daily sleep duration, n (%) < 0.001
< 6 hours 3,924 (49.4) 2,484 (39.6) 1,440 (85.8)
6-8 hours 4,023 (50.6) 3,785 (60.4) 238 (14.2)
Medication use, n (%) < 0.001
0-1 medicine used 4,134 (52.0) 3,802 (60.6) 332 (19.8)
2-4 medicine used 3,813 (48.0) 2,467 (39.4) 1,346 (80.2)
Morbidity, n (%) < 0.001
0-1 disease 3,932 (49.5) 3,149 (50.2) 783 (46.7)
2-4 diseases 4,015 (50.5) 3,120 (49.8) 895 (53.3)
Dysphagia, n (%) 0.26
No 7,565 (95.2) 5,959 (95.1) 1,606 (95.7)
Yes 382 (4.8) 310 (4.9) 72 (4.3)
Data within the parentheses are the percentage. NTD = New Taiwan dollar (1 USD = 30.7 NTD currency rate in September 2018).
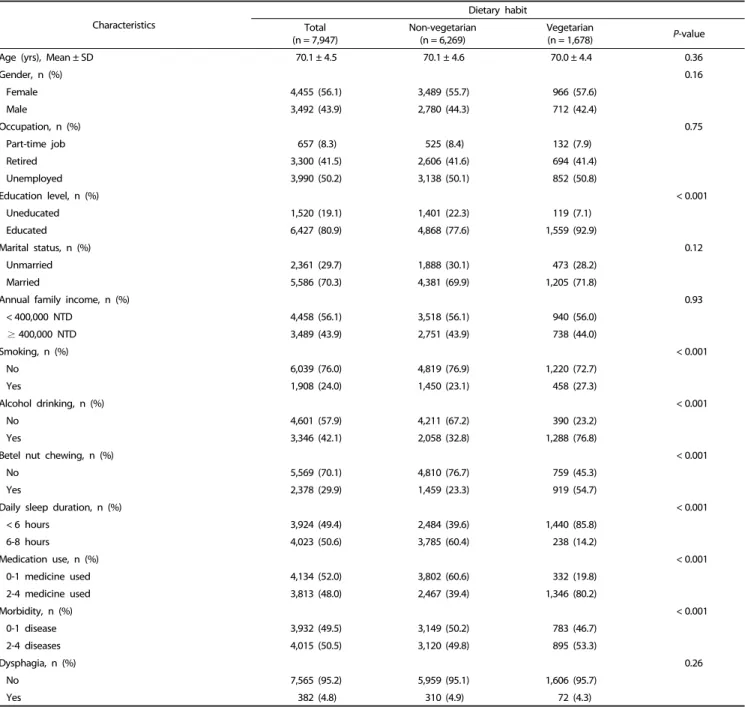
Table 1. Characteristics of the participants for non-vegetarians (n = 6,269) and vegetarians (n = 1,678)
studies, by using healthy eating index or scores of healthy eating indices [28-30].
Data analysis
Data analysis was performed using the IBM SPSS Statistics 21.0 (SPSS Inc., Chicago, IL, USA). Normality test was done by the Shapiro-Wilk test to determine the distribution of outcome variables. The data were normally distributed, and the mean, standard deviation and proportions were used in the descriptive analysis of the variables. Chi-square test for categorical data and Pearson’s correlation were performed to assess the relationship between variables. Potential risk factors for malnutrition in older
adults were determined by multiple logistic regression analysis.
Data are considered statistically significant at an alpha level of P < 0.05.
RESULTS
Characteristics of participants
The socio-demographic characteristics, lifestyle and health
status of the participants are presented in Table 1. The mean
age of the participants was 70.1 (SD = 4.5) years, ranging from
65 to 92 years. Majority of the participants were female (56.1%),
retired or unemployed (91.7%), educated (80.9%), married
Variable n (%)
BMI < 18.5 kg/m2 1,603 (20.2)
Albumin < 3.5 g/dL 527 (6.6)
Hemoglobin (Hb) 834 (10.5)
Female (Hb < 12 g/dL) 585 (70.1)
Male (Hb < 13 g/dL) 249 (29.8)
Dietary intake score 4,170 (52.5)
Non-vegetarian (score < 42) 3,229 (77.4)
Vegetarian (score < 30) 941 (22.6)
Table 2. Prevalence of malnutrition among older adults in Taiwan (n = 7,947)
Variable Age
(yrs)
Weight (kg)
BMI (kg/m2)
Albumin (g/dL)
Hemoglobin
(g/dL) Dietary intake score
Age (yrs) 1.00
Weight (kg) -0.19* 1.00
BMI (kg/m2) -0.41*** 0.77*** 1.00
Albumin (g/dL) -0.93*** 0.59*** 0.29*** 1.00
Hemoglobin (g/dL) -0.30** 0.37*** 0.12*** 0.20*** 1.00
Dietary intake score 0.11 0.65*** 0.21 0.29*** 0.85*** 1.00
*P< 0.05, **P< 0.01, ***P< 0.001.
Table 3. Correlation coefficients between variables and nutritional status (n = 7,947)
Variable Underweight Inadequate protein nutrition Anemia Inadequate dietary intake
OR (95% CI) OR (95% CI) OR (95% CI) OR (95% CI)
Age (yrs)
65-70 1.00 1.00 1.00 1.00
71-92 1.06 (0.96-1.17) 1.97 (0.78-4.95) 1.62 (1.39-1.90)*** 1.20 (1.07-1.98)*
Gender
Female 1.00 1.00 1.00 1.00
Male 1.27 (1.16-1.39)*** 0.93 (0.60-1.70) 0.47 (0.40-0.55)*** 0.91 (0.58-1.33)
Occupation
Part-time job 1.00 1.00 1.00 1.00
Retired 1.10 (1.02-1.39)* 1.27 (0.14-3.69) 1.09 (0.86-1.42) 1.38 (0.86-2.22)
Unemployed 1.19 (1.05-1.41)* 1.56 (0.10-2.78) 1.12 (0.89-1.63) 1.30 (0.82- 2.08)
Education level
Educated 1.00 1.00 1.00 1.00
Uneducated 1.68 (1.19-1.90)*** 0.97 (0.24-3.73) 1.20 (1.02-1.44)* 1.89 (1.06-2.12)*
Marital status
Married 1.00 1.00 1.00 1.00
Unmarried 0.98 (0.88-1.09) 0.96 (0.33-2.77) 1.19 (1.01-1.40)* 1.09 (0.81-1.46)
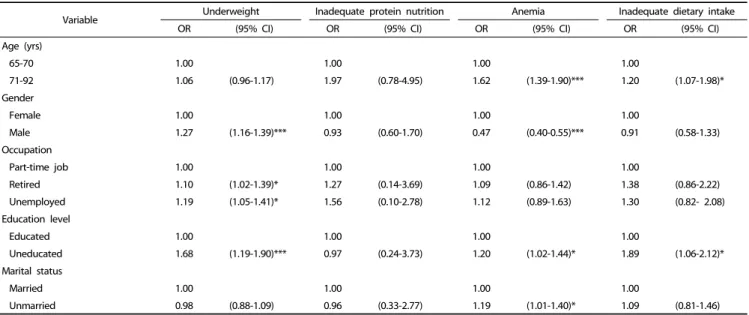
Table 4. Association between variables and inadequate nutritional status among older adults in Taiwan (n = 7,947)
(70.3%), and having annual family income less than 400,000 NTD (13,200 USD, 56.1%). Considering the lifestyle factors, most participants were non-smokers (76.0%), non-drinkers (57.9%), non-betel nut chewers (70.1%), and having daily sleep duration of 6-8 hours (50.6%). Around half the participants took 2 to 4 different medicines (48.0%) and were afflicted with 2 to 4 diseases (50.5%). Only 4.8% of the participants experienced dysphagia.
The distribution of education, smoking, alcohol drinking, betel nut chewing, daily sleep duration, medication use, and morbidity were significantly different between vegetarians and non-vegetarians (P < 0.001). Compared to non-vegetarians, a higher proportion of vegetarians were educated (92.9% vs 77.6%), smokers (27.3% vs 23.1%), drinkers (76.8% vs 32.8%) and
betel nut chewers (54.7% vs 23.3%), had daily sleep duration of less than 6 hours (85.8% vs 39.6%), used multiple medications (80.2% vs 39.4%) and experienced comorbidity (53.3% vs 49.8%).
Prevalence of inadequate nutritional status
Among the elderly subjects, the prevalence of underweight, protein malnutrition, anemia and inadequate dietary intake was 20.2%, 6.6%, 10.5% and 52.5%, respectively (Table 2). Anemia was prevalent in 70.1% female subjects, and inadequate dietary intake included 77.4% non-vegetarians.
Correlation between variables and nutritional status
The correlation coefficients between variables and nutritional status are presented in Table 3. Age shows a negative correlation with body weight (r = -0.19, P = 0.02), BMI (r = -0.41, P < 0.001), albumin level (r = -0.93, P < 0.001) and hemoglobin level (r = -0.30, P = 0.008). Except for no significant association between BMI and dietary intake score, significantly positive correlations were observed among all nutritional status variables such as body weight, BMI, albumin level, hemoglobin level and dietary intake score at P < 0.001.
Association between variables and inadequate nutritional status
Factors associated with inadequate nutritional status were
analyzed by odds ratios and are presented in Table 4. Male
gender (OR, 1.27; 95% CI, 1.16-1.39), retired (OR, 1.10; 95% CI,
Variable Underweight Inadequate protein nutrition Anemia Inadequate dietary intake
OR (95% CI) OR (95% CI) OR (95% CI) OR (95% CI)
Annual family income (NTD)
< 400,000 1.00 1.00 1.00 1.00
≥ 400,000 0.99 (0.91-1.09) 1.14 (0.48-2.67) 1.06 (0.92-1.23) 1.12 (1.07-1.94)*
Smoking
No 1.00 1.00 1.00 1.00
Yes 1.19 (1.06-1.32)** 1.13 (0.40-3.14) 1.02 (0.84-1.24) 1.50 (1.10-2.05)*
Alcohol drinking
No 1.00 1.00 1.00 1.00
Yes 0.92 (0.82-1.03) 3.28 (1.11-9.70)* 1.15 (1.04-1.38)** 1.25 (1.01-1.79)*
Betel nut chewing
No 1.00 1.00 1.00 1.00
Yes 0.83 (0.43-0.98)*** 1.09 (0.92-1.66) 0.96 (0.70-1.24) 0.98 (0.69-1.46)
Daily sleep duration
< 6 hours 1.00 1.00 1.00 1.00
6-8 hours 1.16 (1.06-1.30)** 0.92 (0.66-4.33) 1.10 (0.94-1.30) 0.90 (0.55-1.17)
Dietary habit
Non-vegetarian 1.00 1.00 1.00 1.00
Vegetarian 1.19 (1.01-1.62)* 3.13 (1.03-9.48)* 1.15 (0.83-1.79) 1.31 (1.18-2.04)**
Medication use
0-1 medicine used 1.00 1.00 1.00 1.00
2-4 medicine used 1.34 (1.02-1.85)*** 1.95 (0.82-4.62) 1.16 (0.94-2.03) 0.76 (0.53-1.06)
Morbidity
0-1 disease 1.00 1.00 1.00 1.00
2-4 diseases 0.97 (0.89-1.07) 2.64 (1.01-6.85)* 1.30 (1.11-1.76)*** 1.04 (0.81-1.33)
Dysphagia
No 1.00 1.00 1.00 1.00
Yes 1.12 (0.91-1.39) 1.20 (0.94-1.42) 0.92 (0.62-1.25) 1.34 (1.15-2.56)*
NTD = New Taiwan dollar (1 USD = 30.7 NTD currency rate in September 2018)
*P< 0.05, **P< 0.01, ***P< 0.001.
OR, odds ratio; CI, confidence interval Table 4. continued
1.02-1.39), unemployed (OR, 1.19; 95% CI, 1.05-1.41), uneducated (OR, 1.68; 95% CI, 1.19-1.90), smoking (OR, 1.19; 95% CI, 1.06-1.32), vegetarian diet (OR, 1.19; 95% CI, 1.01-1.62), slept between 6 and 8 hours a night (OR, 1.16; 95% CI, 1.06-1.30), or used multiple medications (OR, 1.34; 95% CI, 1.02-1.85) were associated with the risk of being underweight. However, those who chewed betel nut (OR, 0.83; 95% CI, 0.43-0.98) were less likely to be underweight compared to those who did not chew betel nut.
The odds of protein malnutrition were significantly higher for drinkers (OR, 3.28; 95% CI, 1.11-9.70), vegetarians (OR, 3.13; 95%
CI, 1.03-9.48), or those who had comorbidity (OR, 2.64; 95% CI, 1.01-6.85). The risk of being anemic was higher in older adults aged > 70 years (OR, 1.62; 95% CI, 1.39-1.90), uneducated (OR, 1.20; 95% CI, 1.02-1.44), unmarried (OR, 1.19; 95% CI, 1.01-1.40), drank (OR, 1.15; 95% CI, 1.04-1.38), or had comorbidity (OR, 1.30;
95% CI ,1.11-1.76). However, males (OR, 0.47; 95% CI, 0.40-0.55) were less likely to be anemic compared to females.
Inadequate dietary intake was more prevalent in adults aged
> 70 years (OR, 1.20; 95% CI, 1.07-1.98), uneducated (OR, 1.89;
95% CI , 1.06-2.12), smoked (OR, 1.50; 95% CI, 1.10-2.05), drank alcohol (OR, 1.25; 95% CI , 1.01-1.79), consumed vegetarian diet
(OR, 1.31; 95% CI , 1.18-2.04), were in low income group (OR, 1.12; 95% CI, 1.07-1.94), or had dysphagia (OR, 1.34; 95% CI, 1.15-2.56).
DISCUSSION
This study found that 20.2% of the elderly were underweight, which is similar to a previous study in Ethiopia [31]. Our data also revealed that 6.6% and 10.5% of the elderly had protein malnutrition and anemia, and better nutritional status in terms of biochemical data, as compared to previous studies in Germany and Malaysia where they reported that hypoalbu- minemia (11% vs 63%) and anemia (14% vs 11%) were highly prevalent in older adults [32,33]. However, 52.5% of the subjects had inadequate dietary intake, resulting in increased risk of undernutrition.
The prevalence of undernutrition among the elderly was
determined using anthropometric indicators, biochemical data
and dietary intake score. Several screening tools for
undernutrition have been developed for the assessment of
nutritional status among older adults. The multiple assessment
methods used in this study could be more effective and
confirmative than a generally considered reference tool, mini nutritional assessment (MNA) [34-38]. Biochemical data such as serum albumin and hemoglobin, which are not considered in the MNA questionnaire, are important for assessing the protein and anemic status of individuals. Anemia appeared to be a risk factor for hypoalbuminemia in geriatric patients with malnutrition [32]. This study found a positive correlation between the hemoglobin and albumin levels, indicating that anemic adults could have an increased risk of hypoalbuminemia.
Previous studies reported the negative correlation between age and nutritional status in older adults [39,40]. Similarly, we observed that old age positively correlated with inadequate nutritional status such as underweight, anemia and protein malnutrition. In addition, several factors were identified as risk factors for undernutrition in older adults. This study found that socio-demographic characteristics such as age > 70 years, gender, uneducated level, unmarried status and low income were positively associated with undernutrition in older adults.
These findings are consistent to previous studies which report that age, gender [41,42], marital status, education level [37] and household income [40] are correlated with nutritional status in the elderly.
Lifestyle factors, including smoking, alcohol drinking, daily sleep duration of 6 to 8 hours and vegetarian diet, also correlated with increased risk of undernutrition, when compared to the corresponding reference group. Similarly, underweight was positively associated with smoking [14,15]. Alcohol consumption was associated with decreases in body weight, body fat, BMI and hematological parameters such as hemoglobin [44] and albumin [44,45]. Short sleep duration of less than 6 hours correlated with higher BMI [43], greater waist circumference [46], elevated high-sensitivity C-reactive protein [47], and increased risk of obesity in adults or older adults [24,48], as compared with normal sleep duration of 6 to 8 hours. We also demonstrate that betel nut chewers had a lower risk of being underweight as compared to non-betel nut chewers. Chewing betel nut is considered to increase appetite and therefore weight gain [49,50], which may be further related to the development of obesity and metabolic syndrome.
We further correlated the health status with nutritional status among the elderly. Our study found that increased risk of undernutrition in older adults is associated with multiple medications, comorbidity and dysphagia. This is consistent with the findings of previous studies, where inadequate health condition, comorbidity and multiple medications are reported as contributing factors for malnutrition in older adults [51,52].
In addition, dysphagia is also considered a crucial risk factor for malnutrition in the aged populations [53,54].
There are several strengths of the present study. To the best of our knowledge, this is the first study carried out in Taiwan using a large sample size and a comprehensive nutritional assessment, including anthropometric measurements, biochemical analysis and dietary assessment, to evaluate the nutritional status of older adults. In addition, unlike the previous studies done in Taiwan [18-24], our study investigated potential factors of malnutrition using socio-demographic characteristics, lifestyle and health status as independent variables. However, this study has certain limitations. First, clinical examination was not
included in the present study to evaluate nutrient deficiency in older adults [7]. Secondly, as suggested by previous studies, other assessment methods such as emotional or functional assessment may also be important for better evaluation of nutritional status among the elderly [55-57].
In conclusion, inadequate nutritional status, including under- weight, anemia and inadequate dietary intake, are prevalent (10.5-52.5%) in older adults in Taiwan. Several factors such as age, gender, occupation, education, marital status, family income, smoking, alcohol drinking, betel nut chewing, sleep duration, dietary habit, medication, morbidity and dysphagia are significantly associated with the nutritional status of older adults. Early screening and nutritional assessment are necessary for the effective diagnosis of malnutrition. We propose that more interventions with respect to lifestyle modification and appropriate management of health status are required, to improve the nutritional status among older adults.
ACKNOWLEDGMENTS
The authors would like to thank Taiwan Mei Jau (MJ) Health Management Institution for providing the data.
AUTHORS’ CONTRIBUTIONS
All authors were involved in the conceptualization and design of this manuscript. All authors provided critical input for data analyses and manuscript. All authors have read and approved the final version for submission.
CONFLICT OF INTEREST
All authors declare no conflict of interest.
ORCID
Ghislain G. Poda: https://orcid.org/0000-0002-7948-3054 Chien-Yeh Hsu: https://orcid.org/0000-0001-8233-6461 Hsiao-Hsien Rau: https://orcid.org/0000-0002-7233-2085 Jane C.-J. Chao: https://orcid.org/0000-0002-3610-9580 REFERENCES
1. World Health Organization. Health statistics and information systems [Internet]. Geneva: World Health Organization; 2016 [cited 2016 August 19]. Available from: http://www.who.int/healthinfo/
survey/ageingdefnolder/en/.
2. World Health Organization; National Institutes of Health (US);
National Institute on Aging (US). Global health and aging [Internet].
Geneva: World Health Organization; 2011 [cited 2016 August 19].
Available from: http://www.who.int/ageing/publications/global_
health.pdf.
3. Chen LK, Inoue H, Won CW, Lin CH, Lin KF, Tsay SF, Lin PF, Li SH.
Challenges of urban aging in Taiwan: summary of urban aging forum. J Clin Gerontol Geriatr 2013;4:97-101.
4. Lu L. Aging and quality of life in Taiwan. J Altern Med Res 2012;4:233-43.
5. National Statistics (TW). Yearly statistics: population and housing
[Internet]. Taipei: National Statistics; 2016 [cited 2016 August 19].
Available from: http://eng.stat.gov.tw/lp.asp?ctNode=2265&CtUnit=
1072&BaseDSD=36&mp=5.
6. Lin YY, Huang CS. Aging in Taiwan: building a society for active aging and aging in place. Gerontologist 2016;56:176-83.
7. Ahmed T, Haboubi N. Assessment and management of nutrition in older people and its importance to health. Clin Interv Aging 2010;5:207-16.
8. Chang CC, Roberts BL. Malnutrition and feeding difficulty in Taiwanese older with dementia. J Clin Nurs 2011;20:2153-61.
9. Madeira T, Peixoto-Plácido C, Goulão B, Mendonça N, Alarcão V, Santos N, de Oliveira RM, Yngve A, Bye A, Bergland A, Lopes C, Nicola P, Santos O, Clara JG. National survey of the Portuguese elderly nutritional status: study protocol. BMC Geriatr 2016;16:139.
10. Mathew AC, Das D, Sampath S, Vijayakumar M, Ramakrishnan N, Ravishankar SL. Prevalence and correlates of malnutrition among elderly in an urban area in Coimbatore. Indian J Public Health 2016;60:112-7.
11. Okabe Y, Furuta M, Akifusa S, Takeuchi K, Adachi M, Kinoshita T, Kikutani T, Nakamura S, Yamashita Y. Swallowing function and nutritional status in Japanese elderly people receiving home-care services: a 1-year longitudinal study. J Nutr Health Aging 2016;20:
697-704.
12. Agarwalla R, Saikia AM, Baruah R. Assessment of the nutritional status of the elderly and its correlates. J Family Community Med 2015;22:39-43.
13. Porter Starr KN, McDonald SR, Bales CW. Nutritional vulnerability in older adults: a continuum of concerns. Curr Nutr Rep 2015;4:
176-84.
14. Da Silva Coqueiro R, Rodrigues Barbosa A, Ferreti Borgatto A.
Nutritional status, health conditions and socio-demographic factors in the elderly of Havana, Cuba: data from SABE survey. J Nutr Health Aging 2010;14:803-8.
15. Fares D, Barbosa AR, Borgatto AF, Coqueiro RS, Fernandes MH.
Factors associated with nutritional status of the elderly in two regions of Brazil. Rev Assoc Med Bras (1992) 2012;58:434-41.
16. Boscatto EC, da Silva Duarte MF, da Silva Coqueiro R, Barbosa AR.
Nutritional status in the oldest elderly and associated factors. Rev Assoc Med Bras (1992) 2013;59:40-7.
17. United Nations Development Programme. World leaders adopt sustainable development goals [Internet]. New York, NY: United Nations Development Programme; 2016 [cited 2016 August 22].
Available from: http://www.undp.org/content/undp/en/home/
presscenter/pressreleases/2015/09/24/undp-welcomes-adoption-of -sustainable-development-goals-by-world-leaders.html.
18. Lou MF, Dai YT, Huang GS, Yu PJ. Nutritional status and health outcomes for older people with dementia living in institutions. J Adv Nurs 2007;60:470-7.
19. Chen SH, Acton G, Shao JH. Relationships among nutritional self-efficacy, health locus of control and nutritional status in older Taiwanese adults. J Clin Nurs 2010;19:2117-27.
20. Liu HY, Tseng MY, Li HJ, Wu CC, Cheng HS, Yang CT, Chou SW, Chen CY, Shyu YI. Comprehensive care improves physical recovery of hip-fractured elderly Taiwanese patients with poor nutritional status. J Am Med Dir Assoc 2014;15:416-22.
21. Chen SH, Cheng HY, Chuang YH, Shao JH. Nutritional status and its health-related factors among older adults in rural and urban areas. J Adv Nurs 2015;71:42-53.
22. Tsai MT, Liu HC, Huang TP. The impact of malnutritional status on survival in elderly hemodialysis patients. J Chin Med Assoc 2016;79:309-13.
23. Chien MH, Guo HR. Nutritional status and falls in community- dwelling older people: a longitudinal study of a population-based random sample. PLoS One 2014;9:e91044.
24. Lin CL, Lin CP, Chen SW, Wu HC, Tsai YH. The association between sleep duration and overweight or obesity in Taiwanese adults: a cross-sectional study. Obes Res Clin Pract 2018;12:384-8.
25. Chang CC. Prevalence and factors associated with feeding difficulty in institutionalized elderly with dementia in Taiwan. J Nutr Health Aging 2012;16:258-61.
26. WHO Expert Consultation. Appropriate body-mass index for Asian populations and its implications for policy and intervention strategies. Lancet 2004;363:157-63.
27. World Health Organization. Haemoglobin concentrations for the diagnosis of anaemia and assessment of severity [Internet]. Geneva:
World Health Organization; 2011 [cited 2016 August 19]. Available from: http://www.who.int/vmnis/indicators/haemoglobin.pdf.
28. Hengeveld LM, Wijnhoven HA, Olthof MR, Brouwer IA, Harris TB, Kritchevsky SB, Newman AB, Visser M, Health ABC Study. Prospective associations of poor diet quality with long-term incidence of protein-energy malnutrition in community-dwelling older adults:
the Health, Aging, and Body Composition (Health ABC) Study. Am J Clin Nutr 2018;107:155-64.
29. Procter-Gray E, Olendzki B, Kane K, Churchill L, Hayes RB, Aguirre A, Kang HJ, Li W. Comparison of dietary quality assessment using food frequency questionnaire and 24-hour-recalls in older men and women. AIMS Public Health 2017;4:326-46.
30. Tomey KM, Chen DM, Wang X, Braunschweig CL. Dietary intake and nutritional status of urban community-dwelling men with paraplegia. Arch Phys Med Rehabil 2005;86:664-71.
31. Tessfamichael D, Gete AA, Wassie MM. High prevalence of undernutrition among elderly people in Northwest Ethiopia: a cross sectional study. J Nutr Health Food Sci 2014;2:1-5.
32. Röhrig G, Becker I, Polidori MC, Schulz RJ, Noreik M. Association of anemia and hypoalbuminemia in German geriatric inpatients:
relationship to nutritional status and comprehensive geriatric assessment. Z Gerontol Geriatr 2015;48:619-24.
33. Singh DK, Manaf ZA, Yusoff NA, Muhammad NA, Phan MF, Shahar S. Correlation between nutritional status and comprehensive physical performance measures among older adults with undernourishment in residential institutions. Clin Interv Aging 2014;9:1415-23.
34. de van der Schueren MA, Lonterman-Monasch S, van der Flier WM, Kramer MH, Maier AB, Muller M. Malnutrition and risk of structural brain changes seen on magnetic resonance imaging in older adults.
J Am Geriatr Soc 2016;64:2457-63.
35. Donini LM, Poggiogalle E, Molfino A, Rosano A, Lenzi A, Rossi Fanelli F, Muscaritoli M. Mini-nutritional assessment, malnutrition universal screening tool, and nutrition risk screening tool for the nutritional evaluation of older nursing home residents. J Am Med Dir Assoc 2016;17:959.e11-8.
36. Chang SF. Frailty is a major related factor for at risk of malnutrition in community-dwelling older adults. J Nurs Scholarsh 2017;49:63-72.
37. Ghimire S, Baral BK, Callahan K. Nutritional assessment of community- dwelling older adults in rural Nepal. PLoS One 2017;12:e0172052.
38. Verlaan S, Ligthart-Melis GC, Wijers SL, Cederholm T, Maier AB, de van der Schueren MA. High prevalence of physical frailty among
community-dwelling malnourished older adults-a systematic review and meta-analysis. J Am Med Dir Assoc 2017;18:374-82.
39. Amarya S, Singh K, Sabharwal M. Changes during aging and their association with malnutrition. J Clin Gerontol Geriatr 2015;6:78-84.
40. Camina-Martín MA, de Mateo-Silleras B, Malafarina V, Lopez-Mongil R, Niño-Martín V, López-Trigo JA, Redondo-del-Río MP. Nutritional status assessment in geriatrics: consensus declaration by the Spanish Society of Geriatrics and Gerontology Nutrition Work Group. Maturitas 2015;81:414-9.
41. Papparotto C, Bidoli E, Palese A. Risk factors associated with malnutrition in older adults living in Italian nursing homes: a cross-sectional study. Res Gerontol Nurs 2013;6:187-97.
42. O'Shea E, Trawley S, Manning E, Barrett A, Browne V, Timmons S.
Malnutrition in hospitalized older adults: a multicentre observa- tional study of prevalence, associations and outcomes. J Nutr Health Aging 2017;21:830-6.
43. Naidoo I, Charlton KE, Esterhuizen TM, Cassim B. High risk of malnutrition associated with depressive symptoms in older South Africans living in KwaZulu-Natal, South Africa: a cross-sectional survey. J Health Popul Nutr 2015;33:19.
44. Das SK, Vasudevan DM. Biochemical diagnosis of alcoholism. Indian J Clin Biochem 2005;20:35-42.
45. Ebuehi OAT, Asonye CL. Gender and alcohol consumption affect human serum enzymes, protein and bilirubin. Asian J Biochem 2007;2:330-6.
46. Gildner TE, Liebert MA, Kowal P, Chatterji S, Josh Snodgrass J. Sleep duration, sleep quality, and obesity risk among older adults from six middle-income countries: findings from the study on global AGEing and adult health (SAGE). Am J Hum Biol 2014;26:803-12.
47. Chiang JK. Short duration of sleep is associated with elevated high-sensitivity C-reactive protein level in Taiwanese adults: a cross-sectional study. J Clin Sleep Med 2014;10:743-9.
48. Chien MY, Wang LY, Chen HC. The relationship of sleep duration with obesity and sarcopenia in community-dwelling older adults.
Gerontology 2015;61:399-406.
49. Chang WC, Hsiao CF, Chang HY, Lan TY, Hsiung CA, Shih YT, Tai TY. Betel nut chewing and other risk factors associated with obesity among Taiwanese male adults. Int J Obes 2006;30:359-63.
50. Lin WY, Pi-Sunyer FX, Liu CS, Li TC, Li CI, Huang CY, Lin CC. Betel nut chewing is strongly associated with general and central obesity in Chinese male middle-aged adults. Obesity (Silver Spring) 2009;17:1247-54.
51. Chavarro-Carvajal D, Reyes-Ortiz C, Samper-Ternent R, Arciniegas AJ, Gutierrez CC. Nutritional assessment and factors associated to malnutrition in older adults: a cross-sectional study in Bogotá, Colombia. J Aging Health 2015;27:304-19.
52. Peng LN, Cheng Y, Chen LK, Tung HH, Chu KH, Liang SY. Cognition and social-physiological factors associated with malnutrition in hospitalized older adults in Taiwan. J Nurs Res 2015;23:1-5.
53. Sura L, Madhavan A, Carnaby G, Crary MA. Dysphagia in the elderly:
management and nutritional considerations. Clin Interv Aging 2012;7:287-98.
54. Takeuchi K, Aida J, Ito K, Furuta M, Yamashita Y, Osaka K. Nutritional status and dysphagia risk among community-dwelling frail older adults. J Nutr Health Aging 2014;18:352-7.
55. Andre MB, Dumavibhat N, Ngatu NR, Eitoku M, Hirota R, Suganuma N. Mini Nutritional Assessment and functional capacity in community-dwelling elderly in rural Luozi, Democratic Republic of Congo. Geriatr Gerontol Int 2013;13:35-42.
56. Esmayel EM, Eldarawy MM, Hassan MM, Hassanin HM, Reda Ashour WM, Mahmoud W. Nutritional and functional assessment of hospitalized elderly: impact of sociodemographic variables. J Aging Res 2013;2013:101725.
57. Tanimoto Y, Watanabe M, Sun W, Tanimoto K, Shishikura K, Sugiura Y, Kusabiraki T, Kono K. Association of sarcopenia with functional decline in community-dwelling elderly subjects in Japan. Geriatr Gerontol Int 2013;13:958-63.