축성근시에서 당뇨 및 당뇨망막병증의 억제효과
Axial Myopia and Low HbA1c Level are Correlated and Have a Suppressive Effect on Diabetes and Diabetic Retinopathy
김홍규1, 임형택2, 양종윤3, 김수한4, 김성수2
Hong Kyu Kim1, Tyler Hyungtaek Rim2, Jong Yun Yang3, Soo Han Kim4, Sung Soo Kim2
1단국대학교 의과대학 단국대학교병원 안과학교실, 2연세대학교 의과대학 세브란스병원 안과학교실 시기능개발연구소, 3실로암안과병원,
4연세대학교 원주의과대학 원주세브란스기독병원 안과학교실
1Department of Ophthalmology, Dankook University Hospital, Dankook University College of Medicine, Cheonan, Korea
2The Institute of Vision Research, Department of Ophthalmology, Severance Hospital, Yonsei University College of Medicine, Seoul, Korea
3Siloam Eye Hospital, Seoul, Korea
4Department of Ophthalmology, Wonju Severance Christian Hospital, Yonsei University Wonju College of Medicine, Wonju, Korea
Purpose: The aim of this study was to investigate whether axial myopia has a suppressive effect on diabetes and diabetic retinopathy.
Methods: This retrospective, cross-sectional study used propensity-score matching to explore the correlations between axial myopia and diabetes and diabetic retinopathy. This study included patients who underwent ophthalmic surgery, including cataract surgery, be- tween April 2009 and July 2016.
Results: With an increase of the axial length (AL < 24 mm; 24 mm ≤ AL < 26 mm; and AL ≥ 26 mm) in axial myopia, the prevalence of diabetes (35.9%, 27.9%, and 20.1%, respectively) and diabetic retinopathy (43.3%, 31.2%, and 24.1%, respectively) decreased (p < 0.001 and = 0.001, respectively). Similarly, glycosylated hemoglobin (HbA1c) level (7.00%, 6.67%, and 6.44%, respectively) decreased with an increase of AL in axial myopia (p < 0.001). Axial length and HbA1c level were significantly and negatively correlated, as determined by partial correlation analysis after adjusting for age and sex (r = -0.127; p < 0.001).
Conclusions: Axial myopia and low HbA1c level are correlated and have a suppressive effect on diabetes and diabetic retinopathy.
Keywords: Axial length; Diabetes mellitus; Diabetic retinopathy; Glycosylated hemoglobin; Myopia
Introduction
The worldwide prevalence of diabetes has been increas- ing steadily and is expected to increase more dramatically than previously estimated [1,2]. The prevalence of diabetes among Korean adults is approximately 10%, and it gradually increases with age until 60 years, at which point, the preva-
lence has been reported to range between 20% and 25% [3,4].
The prevalence of diabetic retinopathy (DR) increases with duration of diabetes and has been reported to be approxi- mately 15% among Koreans with diabetes [5,6].
Several recent studies have suggested that myopia has a protective effect against DR [7-12]. Decreased blood flow in eyes with greater axial length (AL) has been suggested to be
Address reprint requests to Sung Soo Kim, MD, PhD
Department of Ophthalmology, Severance Hospital, #50-1 Yonsei-ro, Seodaemun-gu, Seoul 03722, Korea Tel: 82-2-2019-3440, Fax: 82-2-363-3271
E-mail: semekim@yuhs.ac
Received: 2017. 7. 27 Revised: 2017. 11. 14 Accepted: 2017. 12. 11
protective against the development of DR [9,13]. However, a subsequent experimental study reported that reduced retinal blood flow was not a major factor for progression of DR [14], and a population-based study failed to demonstrate any as- sociation between axial myopia and DR [15].
There are fewer studies on the correlation between myo- pia and diabetes than there are on the correlation between myopia and DR. Pierro et al. reported that, among patients with AL < 24 mm, those with diabetes exhibited a shorter AL than those without [16]. Herse conducted experiments in rabbits and reported that chronic hyperglycemia impedes axial development [17]. Li et al. reported that hyperglycemia induces lenticular swelling and causes myopic changes by increasing refractive power [18]. However, no study to date has clarified the exact relationship between axial myopia and diabetes. The present study aimed to evaluate the hypothesis that patients with axial myopia exhibit a relatively low prev- alence of diabetes.
Materials and Methods
This study adhered to the tenets of the Declaration of Hel- sinki. The study protocol was approved by the institutional review board of Severance Hospital, Yonsei University, which waived the requirement for informed patient consent because of the retrospective study design.
Study population
This study retrospectively reviewed the data of 12,628 pa- tients (18,449 eyes) who underwent extracapsular cataract extraction (ECCE) with intraocular lens (IOL) implantation at Severance Hospital, Seoul, South Korea, between April 1, 2009, and July 31, 2016. Data regarding patient age at the time of surgery, presence of hypertension, diabetes, DR, and intraoperative AL of both eyes were retrieved from medical records of physical and ophthalmologic examinations. For patients who underwent bilateral surgery, only data from the eye that was operated first were included. After exclud- ing 465 patients under 40 years of age, 61 patients above 90 years of age, 57 patients with confirmed type I diabetes, and 100 patients with suspected secondary diabetes, the study fi- nally included 11,945 patients. In addition, patients with data available for glycated hemoglobin (HbA1c) level, systolic
blood pressure (SBP), diastolic blood pressure (DBP), height, and weight were grouped separately (n = 4,795; Fig. 1).
The subjects were divided into three groups based on mean AL (AL < 24 mm, 24 mm ≤ AL < 26 mm, and 26 mm
≤ AL). Differences among the three groups were determined based on age at the time of surgery, sex, and presence of hypertension, diabetes and DR. Propensity-score matching (PSM) analysis was performed in order to adjust for statis- tical bias (selection bias) and to confirm whether the same results would be obtained with other analytical methods.
The model was used to obtain a 1:1 match using the nearest neighbor matching method. After matching the “24 mm
≤ AL < 26 mm” group with the “26 mm ≤ AL” group, the
“AL < 24 mm” group was matched with the “24 mm ≤ AL”
group.
Statistical analysis
Data for numeric variables are expressed as mean ± standard deviation. Biases due to differences in age, sex, and pres- ence of hypertension were adjusted by PSM. Continuous
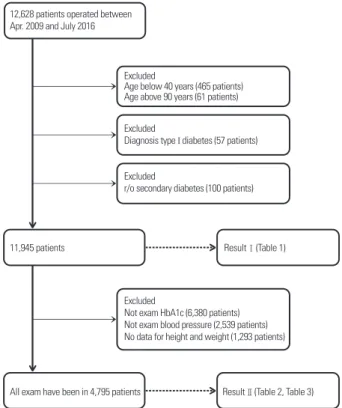
Figure 1. Study design. Out of 12,628 patients, 11,945 patients were included in the Result 1, and 4,795 patients were included in the Re- sult 2. HbA1c = glycated hemoglobin or glycohemoglobin.
12,628 patients operated between Apr. 2009 and July 2016
Excluded
Age below 40 years (465 patients) Age above 90 years (61 patients) Excluded
Diagnosis type I diabetes (57 patients)
Excluded
r/o secondary diabetes (100 patients)
Excluded
Not exam HbA1c (6,380 patients) Not exam blood pressure (2,539 patients) No data for height and weight (1,293 patients)
11,945 patients ResultⅠ(Table 1)
ResultⅡ(Table 2, Table 3) All exam have been in 4,795 patients
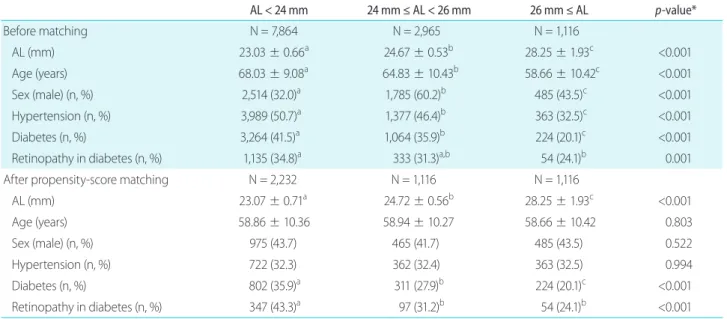
Table 1. Demographic characteristics of the study population
AL < 24 mm 24 mm ≤ AL < 26 mm 26 mm ≤ AL p-value*
Before matching N = 7,864 N = 2,965 N = 1,116
AL (mm) 23.03 ± 0.66a 24.67 ± 0.53b 28.25 ± 1.93c <0.001
Age (years) 68.03 ± 9.08a 64.83 ± 10.43b 58.66 ± 10.42c <0.001
Sex (male) (n, %) 2,514 (32.0)a 1,785 (60.2)b 485 (43.5)c <0.001
Hypertension (n, %) 3,989 (50.7)a 1,377 (46.4)b 363 (32.5)c <0.001
Diabetes (n, %) 3,264 (41.5)a 1,064 (35.9)b 224 (20.1)c <0.001
Retinopathy in diabetes (n, %) 1,135 (34.8)a 333 (31.3)a,b 54 (24.1)b 0.001
After propensity-score matching N = 2,232 N = 1,116 N = 1,116
AL (mm) 23.07 ± 0.71a 24.72 ± 0.56b 28.25 ± 1.93c <0.001
Age (years) 58.86 ± 10.36 58.94 ± 10.27 58.66 ± 10.42 0.803
Sex (male) (n, %) 975 (43.7) 465 (41.7) 485 (43.5) 0.522
Hypertension (n, %) 722 (32.3) 362 (32.4) 363 (32.5) 0.994
Diabetes (n, %) 802 (35.9)a 311 (27.9)b 224 (20.1)c <0.001
Retinopathy in diabetes (n, %) 347 (43.3)a 97 (31.2)b 54 (24.1)b <0.001
Data are presented as mean ± standard deviation or number (percentage).
AL = axial length.
*Analysis of variance and post-hoc analysis with Bonferroni correction for age; chi-square test and post-hoc analysis with Bonferroni correction for sex, diabetes, and hypertension; different letters in the same row indicate statistically significant differences among the groups.
variables were compared by analysis of variance, followed by post-hoc analysis with Bonferroni correction. Categorical variables were compared by the chi-square test, followed by Bonferroni correction (Tables 1, 2). Partial correlation analy- sis was performed to investigate correlations among contin- uous variables (Table 3). In addition, the effect of an increase in AL on diabetes and DR was evaluated by multinomial logistic regression analysis (Table 4, 5). Values of p < 0.05 were considered statistically significant. Statistical analyses were performed using SPSS version 23.0 for Windows (IBM Corp., Armonk, NY, USA), SPSS R-plugin PSMATCH- ING3, and R version 3.1.1 (R Foundation for Statistical Com- puting; http://www.r-project.org).
Results
The 11,945 patients included in this study were grouped based on AL as follows: AL < 24 mm, 7,684 patients; 24 mm ≤ AL < 26 mm, 2,965 patients; and 26 mm ≤ AL, 1,116 patients. After PSM, these three groups included 2,232, 1,116, and 1,116 patients, respectively. There was no significant dif- ference in age, sex, or presence of hypertension among the
three groups after PSM. However, the prevalence of diabetes (35.9%, 27.9%, and 20.1%, respectively) and DR (43.3%, 31.2%, and 24.1%, respectively) decreased significantly (both, p < 0.001; Table 1) with increasing AL (AL < 24 mm;
24 mm ≤ AL < 26 mm; and AL ≥ 26 mm).
The 4,795 patients with data available for HbA1c level, SBP, DBP, height, and weight were grouped based on AL as follows: AL < 24 mm, 3,325 patients; 24 mm ≤ AL < 26 mm, 1,120 patients; and 26 mm ≤ AL, 250 patients. After PSM, these three groups contained 500, 250, and 250 patients, re- spectively. There was no significant difference in age, sex, or presence of hypertension among the three groups after PSM.
However, the prevalence of diabetes (78.8%, 70.0%, and 60.0%, respectively) and DR (49.5%, 38.9%, and 28.0%, re- spectively) decreased significantly (both, p < 0.001) with in- creasing AL (AL < 24 mm; 24 mm ≤ AL < 26 mm; and AL
≥ 26 mm). Similarly, the HbA1c level was found to decrease significantly with increasing AL (p < 0.001; Table 2).
The results of partial correlation analysis for associations between AL, HbA1c level, height, weight, SBP, and DBP revealed that AL and HbA1c were significantly negatively correlated (p < 0.001), while AL, height, and weight were significantly and positively correlated with each other (all, p
< 0.001; Table 3). The results of multinomial logistic regression analysis for evaluating the effects of axial myopia on diabetes and DR revealed that the odds ratio (OR) of both diseases de- creased with an increase in axial myopia (Table 4). However, the results of multinomial logistic regression analysis performed using all parameters, including HbA1c, revealed no significant effects of axial myopia on diabetes or DR (Table 5).
Discussion
Diabetes remains one of the leading causes of morbidity and mortality worldwide [19]. The prevalence of diabetes has been projected to reach 69% in developing countries and 20% in developed countries by the year 2030 [1,2]. Risk factors for diabetes include obesity, hypertension, lifestyle Table 2. Demographic characteristics of the study population
AL < 24 mm 24 mm ≤ AL < 26 mm 26 mm ≤ AL p-value*
Before matching N = 3,325 N = 1,120 N = 250
AL (mm) 23.05 ± 0.63a 24.63 ± 0.51b 27.81 ± 1.67c <0.001
Age (years) 68.38 ± 8.94a 66.43 ± 10.08b 61.81 ± 9.54c <0.001
Sex (male) (n, %) 2,514 (32.0)a 1,785 (60.2)b 485 (43.5)c <0.001
Hypertension (n, %) 3,989 (50.7)a 1,377 (46.4)b 363 (32.5)c <0.001
Diabetes (n, %) 2,496 (75.1) 834 (68.4) 150 (60.0) <0.001
Retinopathy in diabetes (n, %) 958 (38.4)a 285 (34.2)a,b 42 (28.0)b 0.006
Height (cm) 157.80 ± 8.45a 163.56 ± 8.28b 164.01 ± 8.90b <0.001
Weight (kg) 60.78 ± 10.08a 65.48 ± 11.09b 66.68 ± 12.47b <0.001
BMI (kg/m2) 24.39 ± 3.45 24.43 ± 3.44 24.67 ± 3.32 0.444
SBP (mmHg) 129.48 ± 16.29a 129.22 ± 16.25b 126.72 ± 13.91b 0.033
DBP (mmHg) 74.63 ± 10.41a 75.54 ± 9.92a,b 76.68 ± 9.72b 0.001
MAP (mmHg) 93.04 ± 10.88 93.03 ± 10.89 93.16 ± 10.67 0.941
HbA1c level (%) 6.83 ± 1.31a 6.65 ± 1.24b 6.44 ± 1.12c <0.001
After propensity-score matching N = 500 N = 250 N = 250
AL (mm) 23.14 ± 0.58a 24.67 ± 0.49b 27.81 ± 1.67c <0.001
Age (years) 61.98 ± 10.39 61.34 ± 10.08 61.81 ± 9.54 0.719
Sex (male) (n, %) 311 (62.2) 155 (62.0) 144 (57.6) 0.444
Hypertension (n, %) 217 (43.4) 107 (42.8) 114 (45.6) 0.793
Diabetes (n, %) 394 (78.8)a 175 (70.0)b 150 (60.0)c <0.001
Retinopathy in diabetes (n, %) 195 (49.5)a 68 (38.9)b 42 (28.0)c <0.001
Height (cm) 161.68 ± 8.44a 164.27 ± 8.66b 164.01 ± 8.490b <0.001
Weight (kg) 63.60 ± 10.42a 66.73 ± 10.30b 66.68 ± 12.47b <0.001
BMI (kg/m2) 24.31 ± 3.45 24.70 ± 3.12 24.67 ± 3.32 0.199
SBP (mmHg) 129.60 ± 15.51a 127.84 ± 14.61a,b 126.72 ± 13.91b 0.034
DBP (mmHg) 76.84 ± 10.50 76.51 ± 9.49 76.68 ± 9.72 0.911
MAP (mmHg) 94.43 ± 10.63 93.62 ± 9.80 93.36 ± 9.92 0.337
HbA1c (%) 7.00 ± 1.42a 6.67 ± 1.21b 6.44 ± 1.12c <0.001
Data are presented as mean ± standard deviation or number (percentage).
AL = axial length; BMI = body mass index; SBP = systolic blood pressure; DBP = diastolic blood pressure; MAP, mean arterial pressure; HbA1c, glycated hemoglobin or glycohemoglobin.
*Analysis of variance and post-hoc analysis with Bonferroni correction for age, HbA1c level, BMI, and MAP; chi-square test and post-hoc analy- sis with Bonferroni correction for sex, diabetes, and hypertension; different letters in the same row indicate statistically significant differences among the groups.
Table 3. Partial correlation analysis among the study variables
Control Variable Axial
length HbA1c
level Height Weight SBP DBP
Age, sex Axial length r
p 1
- -0.127
<0.001 0.184
<0.001 0.114
<0.001 -0.018
0.209 0.042
0.004
HbA1c r
p -
- 1
- -0.021
0.145 0.405
<0.001 -0.032
0.027 -0.034
0.018
Height r
p -
- -
- 1
- 0.405
<0.001 -0.032
0.027 -0.034
0.018
Weight r
p -
- -
- -
- 1
- 0.026
0.068 0.071
<0.001
SBP r
p -
- -
- -
- -
- 1
- 0.573
<0.001
DBP r
p -
- -
- -
- -
- -
- 1
- HbA1c = glycated hemoglobin or glycohemoglobin; SBP = systolic blood pressure; DBP = diastolic blood pressure.
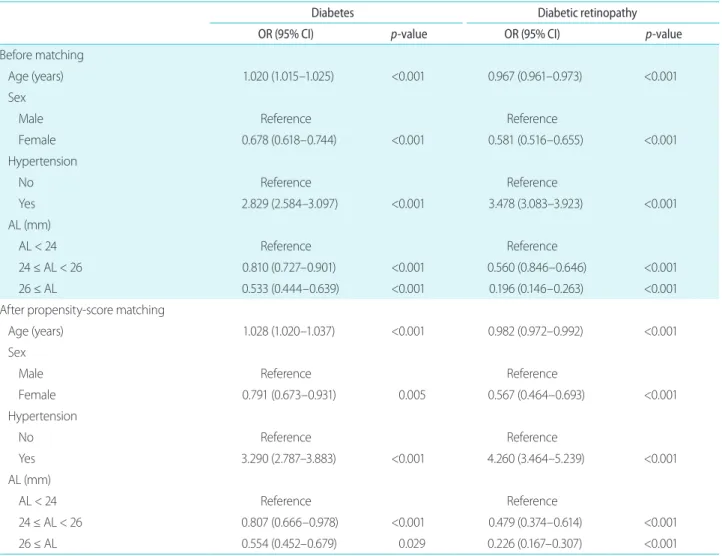
Table 4. Multinomial logistic regression analysis of diabetes severity according to age, sex, hypertension, and AL
Diabetes Diabetic retinopathy
OR (95% CI) p-value OR (95% CI) p-value
Before matching
Age (years) 1.020 (1.015–1.025) <0.001 0.967 (0.961–0.973) <0.001
Sex
Male Reference Reference
Female 0.678 (0.618–0.744) <0.001 0.581 (0.516–0.655) <0.001
Hypertension
No Reference Reference
Yes 2.829 (2.584–3.097) <0.001 3.478 (3.083–3.923) <0.001
AL (mm)
AL < 24 Reference Reference
24 ≤ AL < 26 0.810 (0.727–0.901) <0.001 0.560 (0.846–0.646) <0.001
26 ≤ AL 0.533 (0.444–0.639) <0.001 0.196 (0.146–0.263) <0.001
After propensity-score matching
Age (years) 1.028 (1.020–1.037) <0.001 0.982 (0.972–0.992) <0.001
Sex
Male Reference Reference
Female 0.791 (0.673–0.931) 0.005 0.567 (0.464–0.693) <0.001
Hypertension
No Reference Reference
Yes 3.290 (2.787–3.883) <0.001 4.260 (3.464–5.239) <0.001
AL (mm)
AL < 24 Reference Reference
24 ≤ AL < 26 0.807 (0.666–0.978) <0.001 0.479 (0.374–0.614) <0.001
26 ≤ AL 0.554 (0.452–0.679) 0.029 0.226 (0.167–0.307) <0.001
AL = axial length; OR = odds ratio; CI = confidence interval.
changes, pancreatic dysfunction, and smoking [2,20].
Among patients with diabetes in the present study, the proportion of men and the frequency of hypertension were
relatively high (data not shown). Several studies on the as- sociation between diabetes and sex have documented that men exhibit higher rates of diabetes than women, and that Table 5. Multinomial logistic regression analysis of diabetes severity according to age, sex, hypertension, AL, height, weight, SBP, DBP, and HbA1c level
Diabetes Diabetic retinopathy
OR (95% CI) p-value OR (95% CI) p-value
Before matching
Age (years) 1.003 (0.992–1.013) 0.627 1.003 (0.992–1.013) <0.001
Sex
Male Reference Reference
Female 0.797 (0.615–1.033) 0.086 0.797 (0.615–1.033) <0.001
Hypertension
No Reference Reference
Yes 1.793 (1.505–2.137) <0.001 1.793 (1.505–2.137) <0.001
AL (mm)
< 24 Reference Reference
24–25.99 0.864 (0.706–1.056) 0.154 0.864 (0.706–1.056) <0.001
≥ 26 0.729 (0.508–1.047) 0.087 0.729 (0.508–1.047) <0.001
Height (cm) 0.995 (0.979–1.011) 0.542 0.995 (0.979–1.011) 0.723
Weight (kg) 1.013 (1.003–1.023) 0.014 1.013 (1.003–1.023) 0.743
SBP (mmHg) 1.013 (1.006–1.020) <0.001 1.013 (1.006–1.020) <0.001
DBP (mmHg) 0.979 (0.969–0.989) <0.001 0.979 (0.969–0.989) <0.001
HbA1c level 12.578 (10.465–15.118) <0.001 12.578 (10.465–15.118) <0.001
After propensity-score matching
Age (years) 1.010 (0.988–1.032) 0.387 1.010 (0.988–1.032) <0.001
Sex
Male Reference Reference
Female 0.905 (0.489–1.676) 0.751 0.905 (0.489–1.676) 0.013
Hypertension
No Reference Reference
Yes 1.678 (1.124–2.504) 0.011 1.678 (1.124–2.504) 0.001
AL (mm)
< 24 Reference Reference
24–25.99 0.613 (0.379–0.992) 0.046 0.613 (0.379–0.992) <0.001
≥ 26 0.837 (0.508–1.379) 0.485 0.837 (0.508–1.379) 0.076
Height (cm) 1.002 (1.002–1.037) 0.913 1.002 (1.002–1.037) 0.454
Weight (kg) 1.013 (0.989–1.037) 0.287 1.013 (0.989–1.037) 0.727
SBP (mmHg) 1.020 (1.002–1.037) 0.025 1.020 (1.002–1.037) 0.001
DBP (mmHg) 0.977 (0.953–1.002) 0.068 0.977 (0.953–1.002) 0.003
HbA1c level 21.387 (13.226–34.584) <0.001 21.387 (13.226–34.584) <0.001
AL = axial length; SBP = systolic blood pressure; DBP = diastolic blood pressure; HbA1c = glycated hemoglobin or glycohemoglobin; OR = odds ratio; CI = confidence interval.
male sex is a risk factor for diabetes [21-23]. In contrast, some studies have demonstrated a lack of association be- tween these two factors [24]. With regard to this controversy, Nordström et al. [25] reported that the higher rates of diabe- tes among men was attributable to the higher proportion of visceral fat, and that being male was no longer a risk factor for diabetes after adjustment for visceral fat. Many studies on the association between hypertension and diabetes have found the former to be a risk factor for developing diabetes [20,26].
Myopia is known to induce nuclear and posterior sub-cap- sular cataract, causing patients with myopia to undergo early surgery [27,28]. In the present study, patients with a longer AL were younger than those with a shorter AL. In order to compensate for differences in age, sex, and hypertension due to AL, the AL groups in the present study were selected by PSM.
Previous studies have suggested that patients with rela- tively long AL exhibit decreased retinal perfusion, which is one of the factors contributing to the decreased incidence of DR. Therefore, some studies have described myopia as having a protective effect against DR [7-13]. However, in the present study, patients with axial myopia exhibited a rela- tively low prevalence of diabetes as well as DR. In addition, HbA1c levels were low among patients with axial myopia.
The strength of the correlation between myopia and diabe- tes decreased after adjusting for HbA1c level. Based on the present findings, the authors suggest that axial myopia and low HbA1c level are correlated and have a suppressive effect on diabetes and DR (Fig. 2).
Further studies are warranted to investigate the mecha- nisms underlying the correlation between axial myopia and HbA1c level, as well as the suppressive effect of axial myo- pia on diabetes and DR. A follow-up study is being planned at our institute.
There are several limitations to the present study. First, the subjects in this study underwent ophthalmic surgery involving ECCE with IOL implantation at tertiary medical institutions. Second, the effects of socioeconomic status and education were not investigated. Consequently, the present findings on the prevalence of diabetes and hypertension might not be applicable in a population-based study. Howev- er, the aim of this study was not to evaluate the prevalence of diabetes or DR among patients with axial myopia, but rather to analyze differences based on the presence of axial myo-
pia. This study was meaningful in that it included patients who underwent ECCE with IOL implantation over a period of more than seven years.
In conclusion, even after adjusting for age, sex, and hy- pertension, patients with axial myopia exhibited a gradual decrease both in the prevalence of diabetes and DR and HbA1c level with increasing AL. Patients with axial myopia exhibited relatively low ORs of diabetes and DR; however, after adjusting for HbA1c level, the relationship between axial myopia and diabetes and DR was no longer significant.
The authors believe that a decrease in HbA1c level with an increase in AL is the reason for the decreased prevalence of diabetes and DR among patients with axial myopia (Fig. 2).
These findings demonstrate that axial myopia and low HbA1c level are correlated and have a suppressive effect on diabetes and DR.
Acknowledgments
We thank Woojoo Lee, PhD, (Department of Statistics, Inha University, Inchon, South Korea) for his advice regarding the statistical analysis.
Conflicts of Interest
The authors declare no conflicts of interest relevant to this article.
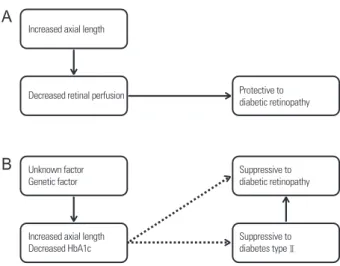
Figure 2. Study conclusions. Previous (A) and new (B) theories.
HbA1c = glycated hemoglobin or glycohemoglobin.
Increased axial length
Decreased retinal perfusion
Unknown factor Genetic factor
Increased axial length Decreased HbA1c
Suppressive to diabetic retinopathy
Suppressive to diabetes typeⅡ Protective to diabetic retinopathy
B A
References
1. Zhang P, Zhang X, Brown J, et al. Global healthcare expendi- ture on diabetes for 2010 and 2030. Diabetes Res Clin Pract 2010;87:293-301.
2. Chan JC, Malik V, Jia W, et al. Diabetes in Asia: epidemiology, risk factors, and pathophysiology. JAMA 2009;301:2129-40.
3. Cho H, Kim JH. Prevalence of microalbuminuria and its associat- ed cardiometabolic risk factors in Korean youth: data from the Korea National Health and Nutrition Examination Survey. PLoS One 2017;12:e0178716.
4. Kim HS, Cho JH, Yoon KH. New directions in chronic disease management. Endocrinol Metab (Seoul) 2015;30:159-66.
5. Kim JH, Kwon HS, Park YM, et al. Prevalence and associated fac- tors of diabetic retinopathy in rural Korea: the Chungju metabol- ic disease cohort study. J Korean Med Sci 2011;26:1068-73.
6. Jee D, Lee WK, Kang S. Prevalence and risk factors for diabetic retinopathy: the Korea National Health and Nutrition Examina- tion Survey 2008-2011. Invest Ophthalmol Vis Sci 2013;54:6827-33.
7. Tayyab H, Haider MA, Haider Bukhari Shaheed SA. Axial myopia and its influence on diabetic retinopathy. J Coll Physicians Surg Pak 2014;24:728-31.
8. Fu Y, Geng D, Liu H, Che H. Myopia and/or longer axial length are protective against diabetic retinopathy: a meta-analysis. Acta Ophthalmol 2016;94:346-52.
9. Man RE, Sasongko MB, Wang JJ, Lamoureux EL. Association between myopia and diabetic retinopathy: a review of observa- tional findings and potential mechanisms. Clin Exp Ophthalmol 2013;41:293-301.
10. Man RE, Sasongko MB, Sanmugasundram S, et al. Longer axial length is protective of diabetic retinopathy and macular edema.
Ophthalmology 2012;119:1754-9.
11. Lim LS, Lamoureux E, Saw SM, et al. Are myopic eyes less likely to have diabetic retinopathy? Ophthalmology 2010;117:524-30.
12. Wang X, Tang L, Gao L, et al. Myopia and diabetic retinopathy:
a systematic review and meta-analysis. Diabetes Res Clin Pract 2016;111:1-9.
13. Quigley M. Myopia and diabetic retinopathy. Ophthalmology 2010;117:2040.
14. Man RE, Sasongko MB, Xie J, et al. Decreased retinal capillary flow is not a mediator of the protective myopia-diabetic retinopathy relationship. Invest Ophthalmol Vis Sci 2014;55:6901-7.
15. Ganesan S, Raman R, Reddy S, et al. Prevalence of myopia and its association with diabetic retinopathy in subjects with type II di- abetes mellitus: a population-based study. Oman J Ophthalmol 2012;5:91-6.
16. Pierro L, Brancato R, Robino X, et al. Axial length in patients with diabetes. Retina 1999;19:401-4.
17. Herse P. Effects of hyperglycaemia on ocular development in rabbit: refraction and biometric changes.Ophthalmic Physiol Opt 2005;25:97-104.
18. Li HY, Luo GC, Guo J, Liang Z. Effects of glycemic control on re- fraction in diabetic patients. Int J Ophthalmol 2010;3:158-60.
19. Lozano R, Naghavi M, Foreman K, et al. Global and regional mortality from 235 causes of death for 20 age groups in 1990 and 2010: a systematic analysis for the Global Burden of Disease Study 2010. Lancet 2012;380:2095-128.
20. Kim SM, Lee JS, Lee J, et al. Prevalence of diabetes and impaired fasting glucose in Korea: Korean National Health and Nutrition Survey 2001. Diabetes Care 2006;29:226-31.
21. Chen L, Magliano DJ, Zimmet PZ. The worldwide epidemiology of type 2 diabetes mellitus--present and future perspectives. Nat Rev Endocrinol 2011;8:228-36.
22. Yang W, Lu J, Weng J, et al. Prevalence of diabetes among men and women in China. N Engl J Med 2010;362:1090-101.
23. Sattar N. Gender aspects in type 2 diabetes mellitus and cardiometabolic risk. Best Pract Res Clin Endocrinol Metab 2013;27:501-7.
24. Akter S, Rahman MM, Abe SK, Sultana P. Prevalence of diabetes and prediabetes and their risk factors among Bangladeshi adults:
a nationwide survey. Bull World Health Organ 2014;92:204-13, 213A.
25. Nordström A, Hadrévi J, Olsson T, et al. Higher prevalence of type 2 diabetes in men than in women is associated with differences in visceral fat mass. J Clin Endocrinol Metab 2016;101:3740-6.
26. Nguyen CT, Pham NM, Lee AH, Binns CW. Prevalence of and risk factors for type 2 diabetes mellitus in Vietnam: a systematic re- view. Asia Pac J Public Health 2015;27:588-600.
27. Pan CW, Boey PY, Cheng CY, et al. Myopia, axial length, and age-related cataract: the Singapore Malay eye study. Invest Oph- thalmol Vis Sci 2013;54:4498-502.
28. Kubo E, Kumamoto Y, Tsuzuki S, Akagi Y. Axial length, myopia, and the severity of lens opacity at the time of cataract surgery.
Arch Ophthalmol 2006;124:1586-90.