ABSTRACT
γδ T cells are abundant in the gut mucosa and play an important role in adaptive immunity as well as innate immunity. Although γδ T cells are supposed to be associated with the enhancement of Ab production, the status of γδ T cells, particularly in the synthesis of IgA isotype, remains unclear. We compared Ig expression in T cell receptor delta chain deficient (TCRδ−/−) mice with wild-type mice. The amount of IgA in fecal pellets was substantially elevated in TCRδ−/− mice. This was paralleled by an increase in surface IgA expression and total IgA production by Peyer's patches (PPs) and mesenteric lymph node (MLN) cells.
Likewise, the TCRδ−/− mice produced much higher levels of serum IgA isotype. Here, surface IgA expression and number of IgA secreting cells were also elevated in the culture of spleen and bone marrow (BM) B cells. Germ-line α transcript, an indicator of IgA class switch recombination, higher in PP and MLN B cells from TCRδ−/− mice, while it was not seen in inactivated B cells. Nevertheless, the frequency of IgA+ B cells was much higher in the spleen from TCRδ−/− mice. These results suggest that γδ T cells control the early phase of B cells, in order to prevent unnecessary IgA isotype switching. Furthermore, this regulatory role of γδ T cells had lasting effects on the long-lived IgA-producing plasma cells in the BM.
Keywords: gamma delta; B-Lymphocytes; Immunoglobulin A; Immunoglobulin class switching
INTRODUCTION
Vertebrate animals have adaptive immune systems composed of three key lymphocytes (B cells, αβ T cells, and γδ T cells), which all possess specific antigen receptors. It is now textbook knowledge that αβ T cells play a critical role in antigen-specific B cell
differentiation. Although the role of γδ T cells in the immune system is not fully understood yet, it has become clear that they, like αβ T cells, exert a strong influence on B cell
differentiation and, accordingly, Ab synthesis (1). Many studies have demonstrated that γδ T cells are associated with the enhancement of Ab production. Indeed, γδ T cells induce
Original Article
Received: May 28, 2018 Revised: Jul 12, 2018 Accepted: Jul 25, 2018
*Correspondence to Pyeung-Hyeun Kim
Department of Molecular Bioscience, College of Biomedical Science and Institute of Bioscience and Biotechnology, Kangwon National University, 1 Kangwondaehak-gil, Chuncheon24341, Korea.
E-mail: phkim@kangwon.ac.kr
†These authors contributed equally to this work.
Copyright © 2018. The Korean Association of Immunologists
This is an Open Access article distributed under the terms of the Creative Commons Attribution Non-Commercial License (https://
creativecommons.org/licenses/by-nc/4.0/) which permits unrestricted non-commercial use, distribution, and reproduction in any medium, provided the original work is properly cited.
Conflict of Interest
The authors declare no potential conflicts of interest.
Abbreviations
AID, activation-induced cytidine deaminase;
BM, bone marrow; CSR, class switch recombination; DP, double positive; FBS, fetal bovine serumGLT, germ-line transcripts; LP,
Hye-Ju Han1,†, Young-Saeng Jang1,†, Goo-Young Seo1,†, Sung-Gyoo Park2, Seung Goo Kang3, Sung-il Yoon3, Hyun-Jeong Ko4, Geun-Shik Lee5, Pyeung-Hyeun Kim1,*
1 Department of Molecular Bioscience, College of Biomedical Science and Institute of Bioscience and Biotechnology, Kangwon National University, Chuncheon 24341, Korea
2 School of Life Sciences and BioImaging and Immune Synapse Research Center, Gwangju Institute of Science and Technology (GIST), Gwangju 61005, Korea
3 Division of Biomedical Convergence, School of Biomedical Science and Institute of Bioscience and Biotechnology, Kangwon National University, Chuncheon 24341, Korea
4 Laboratory of Microbiology and Immunology, College of Pharmacy, Kangwon National University, Chuncheon 24341, Korea
5College of Veterinary Medicine, Kangwon National University, Chuncheon 24341, Korea
Murine γδ T Cells Render B Cells
Refractory to Commitment of IgA
Isotype Switching
IgE isotype switching by expressing CD40 ligand (2) and IL-13 (3). In one study, a patient with very high absolute numbers of circulating γδ T cells also demonstrated high titers of circulating IgM, IgG, and IgA (4). It was also reported that γδ T cells induced IgA isotype switching in IgA nephropathy (5). Caccamo et al. (6) reported that Vγ9Vδ2 T cells expressed the costimulatory molecules, ICOS and CD40L, and provided B cell help for the production of IgG, IgA, and IgM. In addition, an earlier study has shown that T cell receptor delta chain deficient (TCRδ−/−) mice have impaired mucosal and systemic IgA responses, while IgM and IgG levels were little changed (7). By contrast, TCRδ−/− mice had normal IgA/IgM and reduced IgG1/IgE levels (8). As a whole, the exact role of γδ T cells in Ig isotype regulation is not delineated yet. Because γδ T cells are prevalent in mucosal tissues, such as the intestinal tract, we were particularly interested in the effect of γδ T cells on preimmune IgA response. Using TCRδ−/− mice, we investigated the role of γδ T cells in IgA expression, from early to late stage B cell differentiation. Our data indicate that γδ T cells prevent IgA isotype commitment prior to mature B cell stage.
MATERIALS AND METHODS
Animals and genotyping of TCR δ knockout mice
Wild-type (WT) C57BL/6 (Daehan Biolink, Seoul, Korea) and TCRδ−/− mice (9) (JAX stock #002119, Jackson Lab) were maintained on an 8:16-h light:dark cycle in an animal environmental control chamber (Daehan Biolink). Mice used in this study were 8–20 wk of age. Animal care was performed in accordance with the institutional guidelines set forth by Kangwon National University.
Genomic DNA was isolated using a genomic DNA purification kit according to the manufacturer's protocol (Promega, Madison, WI, USA). To confirm either WT or TCRδ knockout genotype, PCR was performed with 4 primers: TCRδ mutant forward primer, oIMR6916, 5′-CTT GGG TGG AGA GGC TAT TC-3′; reverse primer, oIMR6917, 5′-AGG TGA GAT GAC AGG AGA TC-3′; internal positive control forward primer, oIMR8744, 5′-CAA ATG TTG CTT GTC TGG TG-3′; and reverse primer, oIMR8745, 5′-GTC AGT CGA GTG CAC AGT TT- 3′. The WT and TCRδ knockout alleles resulted in a 200 bp and 280 bp product, respectively.
Reagents
Lipopolysaccharides (LPS; Escherichia coli O111:B4) was purchased from Sigma-Aldrich (St. Louis, MO, USA). TRIzol Reagent was purchased from Invitrogen Life Technologies (Carlsbad, CA, USA). The antibodies used in the ELISA were purchased from Southern Biotechnology (Birmingham, AL, USA).
Preparation of cells and peritoneal lavage, and cell culture
Murine splenic B cell suspensions were prepared as described previously (10). B cells were incubated with anti-CD43 Ab-conjugated microbeads (Miltenyi Biotec, Bergisch Gladbach, Germany). The bead-bound cells were separated from unbound cells using an AutoMacs magnetic cell sorter (Miltenyi Biotec). Subsequently, membrane IgA-negative (mIgA−) B cells were prepared using anti-mouse IgA Ab-coated tissue culture dish panning. This procedure resulted in >95% depletion of mIgA+ cells. Bone marrow (BM) whole cells were isolated from C57BL/6 and TCRδ−/− mouse femurs. Peyer's patches (PPs) cells were prepared as described previously (11,12), and mesenteric lymph node (MLN) cells were separated lamina propria; LPS, lipopolysaccharides;
mIgA, membrane IgA; MLN, mesenteric lymph node; PP, Peyer’s patch; qPCR, quantitative PCR; RT, room temperature; TCRδ−/−, T cell receptor delta chain deficient; TFH, follicular B helper T cells; Treg, regulatory T cell; WT, wild-type
Author Contributions
Conceptualization: Kim PH; Investigation:
Han HJ, Jang YS, Seo GY; Methodology: Park SG, Kang SG; Formal analysis: Yoon SI, Ko HJ, Lee GS.
from intestinal fatty tissues by using 2 forceps in a petri dish containing PBS. MLN cells were teased and harvested by centrifugation at 500 g for 5 min. Cells were washed twice with HBSS and suspended in RPMI 1640 medium (Sigma-Aldrich) supplemented with 10% fetal bovine serum (FBS), 50 mM 2-mercaptoethanol, 5 mM HEPES, penicillin, and streptomycin. Intestinal lamina propria (LP) lymphocytes were extracted from the colon.
In brief, the colon was collected and PP removed. Mucus was removed by incubating with 1 mM DTT/PBS for 10 min, and intraepithelial cells were removed by incubating with 30 mM EDTA/PBS for 8 min and repeated twice at room temperature (RT). The intestines were washed with PBS, and lamina propria lymphocytes were isolated by digestion with 20 ml collagenase solution for 90 min at 37°C in a CO2 incubator. The LP lymphocyte fractions were purified by 44/67% Percoll (GE Healthcare, Piscataway, NJ, USA) gradient. To prepare murine peritoneal lavage fluid, the peritoneum was flushed with 3 ml of PBS containing 2% FBS. The recovered fluid was immediately centrifuged at 600 g for 2 min and the supernatant was used for ELISA.
Isotype-specific ELISA and ELISPOT assay
Isotype-specific ELISAs were done as described (13). The reaction products were measured at 405 nm with an ELISA reader (VERSAMAX reader, Molecular Devices, Sunnyvale, CA, USA). To detect Ab present in the gut, fecal pellets were diluted in PBS and centrifuged at 10,000 g for 10 min before supernatants were collected. An isotype-specific ELISPOT assay was performed as described before (14). Data are presented as numbers of spot-forming cells/2×105 cultured cells with background subtracted.
RNA preparation and RT-PCR
RNA preparation, reverse transcription, and PCR were performed as described previously (13). PCR primers were synthesized by Bioneer Corp. (Seoul, Korea): germ-line transcript (GLT) α sense, 5′-CAA GAA GGA GAA GGT GAT TCA G-3′; and antisense, 5′-GAG CTG GTG GGA GTG TCA GTG-3′; activation-induced cytidine deaminase (AID) sense, 5′-TGC TAC GTG GTG AAG AGG AG-3′; and antisense, 5′-TCC CAG TCT GAG ATG TAG CG-3′; and β-actin sense, 5′-CAT GTT TGA GAC CTT CAA CAC CCC-3′; and antisense, 5′-GCC ATC TCC TGC TCG AAG TCT AG-3′. All reagents for RT-PCR were purchased from Promega.
PCR reactions for β-actin were performed in parallel to normalize cDNA concentrations within each set of samples. Aliquots of the PCR products were resolved by electrophoresis on 2% agarose gels. For quantitative PCR (qPCR), 24 µl of PCR master mix (iQ-SYBR green master mix, Bio-Rad Laboratories, Hercules, CA, USA) containing 25 pmol each of
“downstream” and “upstream” primers were added to each sample. qPCR was performed by Bio-Rad CFX-96.
CFSE staining and flow cytometric analysis
CFSE staining and flow cytometric analysis were done as described (15). Isolated spleen B cells were labeled with a CFSE kit (Invitrogen Life Technologies). Dilution of CFSE was measured by counting 30,000 viable cells with a FACSCalibur (BD Biosciences, San Diego, CA, USA). The cells were stained with: goat anti-mouse IgA-FITC (Southern Biotech, Birmingham, AL, USA); goat anti-mouse IgA-biotin (Southern Biotech); goat anti-mouse IgM-FITC (Fisher Biotech, Wembley, Australia); mouse anti-mouse IgM-biotin; goat anti- mouse IgG1-biotin (Southern Biotech); goat anti-mouse IgG2b-biotin (Southern Biotech);
and streptavidin-APC (eBioscience, San Diego, CA, USA). Samples were analyzed with FlowJo software (Tree Star, Ashland, MA, USA), using unstained controls to determine gating.
Immunohistochemistry
Spleen tissues were mounted in OCT (Leica, Wetzlar, Germany) embedding compound and frozen at −80°C. Blocks were cut into 7 µm frozen tissue sections and blocked with 3%
H2O2 in methanol for 10 min. After washing, they were further blocked with 3% bovine serum albumin in PBS for 1 h at RT. Tissues were incubated with biotinylated anti-mouse IgA antibody at 4°C overnight, then with peroxidase conjugated streptavidin antibody in a humidified chamber for 1 h at RT. The sections were developed with DAB (Sigma-Aldrich) substrate solution, and slides were immersed in dH2O before being counterstained with hematoxylin (Sigma-Aldrich), dried, and mounted.
Statistical analysis
Statistical differences between experimental groups were determined by ANOVA, and values of p<0.05 by unpaired, 2-tailed Student's t-test were considered significant.
RESULTS
Determination of Ig levels in TCRδ-deficient (TCRδ
−/−) and WT mice
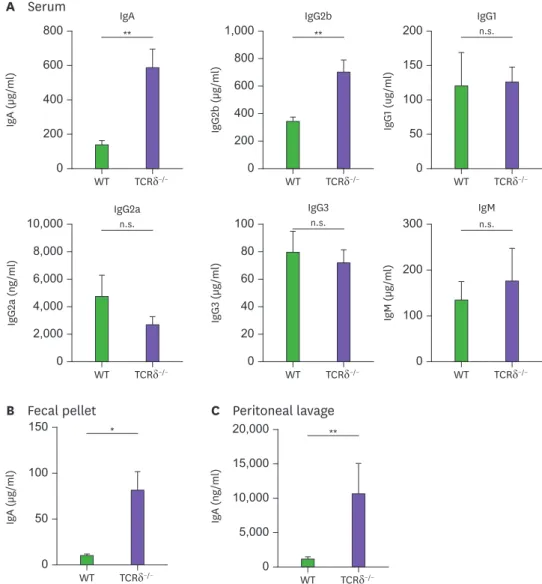
Several studies have shown that γδ T cells are involved in the enhancement of IgA production (4,5,7). We initially aimed to unveil how γδ T cells possess such an effect on IgA response by using TCRδ−/− mice (Supplementary Fig. 1). As opposed to some previous reports, IgA levels were substantially elevated in the serum of TCRδ−/− mice (Fig. 1A). Similarly, IgA levels in fecal pellets and even in peritoneal lavage were increased in TCRδ−/− mice (Fig. 1B and C).
Interestingly, serum IgG2b was also elevated in TCRδ−/− mice. On the other hand, levels of other isotypes were virtually identical between WT and TCRδ−/− mice (Fig. 1A). Thus, these results indicate that γδ T cells affect Ig isotype switching selectively.
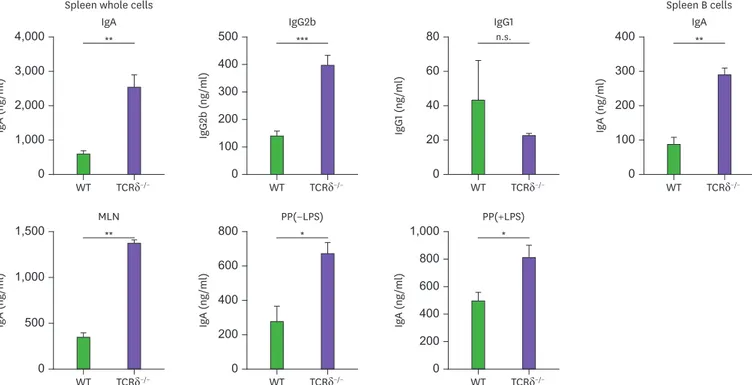
Because IgA was markedly elevated in the fecal pellets and serum of TCRδ−/− mice, it was necessary to examine the production of Igs by spleen, PP, and MLN cells. IgA production was consistently increased in the cultures of spleen, PP and MLN cells of TCRδ−/− mice (Fig. 2), suggesting that γδ T cells affect IgA B cell commitment in the spleen, PP, MLN, peritoneal cavity, and result in an increase in the mucosal and systemic IgA response.
Occurrence of mIgA
+B cell population is already increased prior to stimulation of mature B cells in TCR δ
−/−mice
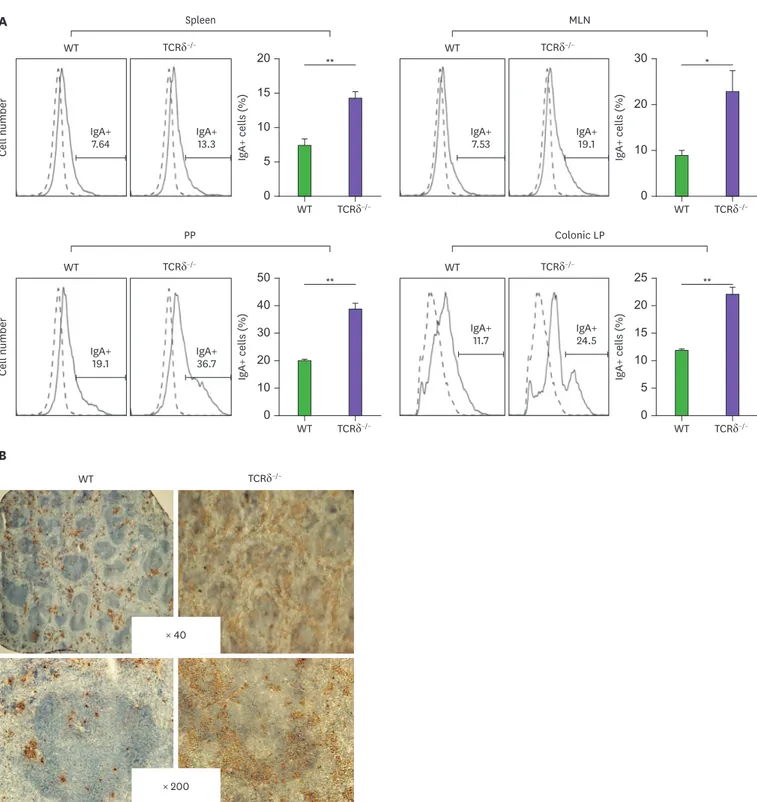
The findings that secreted IgA level in TCRδ−/− mice was elevated for both in vivo and in vitro cultures (Figs. 1 and 2) prompted us to examine whether the frequency of mIgA+ B cells was altered in TCRδ−/− mice. As shown in Fig. 3A, the number of mIgA+ B cells was substantially increased in freshly isolated cell populations of TCRδ−/− mouse spleen, PP, MLN, and colonic LP. Furthermore, the frequency of mIgA+ B cells was much higher in the TCRδ−/−
spleen (Fig. 3B). These results reveal that γδ T cells suppress the unwanted IgA class switch recombination (CSR), by an unknown mechanism, to maintain homeostasis of an intact state of naïve B cells before foreign Ag stimulation.
Assessment of IgA expression by using further purified spleen B cells
Because we observed the possibility that γδ T cells may constrain IgA CSR, it was necessary to determine if mIgA− B cells from TCRδ−/− mice possess the same IgA CSR potential as that of WT mice. mIgA− B cells were cultured with LPS for 7 days and IgA secretion was assessed by ELISA. Unexpectedly, an increase of IgA production by TCRδ−/− whole B cellswas also observed when mIgA− B cells were tested (Supplementary Fig. 2A). We initially expected that this IgA increase would not be seen in the culture of TCRδ−/− mIgA− B cells, and therefore surmised that the purity of the prepared mIgA− B cells was not satisfactory. We subsequently prepared mIgM+ spleen B cells. The purity of mIgM+ B cells was not less than 98% (Supplementary Fig. 2B). Nonetheless, IgA secretion by TCRδ−/− mIgM+ B cells was still far greater than WT (Fig. 4A). This result was puzzling. One possible reason for the findings is that some of the prepared mIgM+ cells also expressed mIgA, and indeed, this seemed to be the case (Fig. 4B), as the frequency of IgM+/IgA+ double positive (DP) B cells was significantly higher in the TCRδ−/− spleen and MLN B cells. IgM+/IgG2b+ DP cells were also elevated in TCRδ−/− mice (Supplementary Fig. 3), while no difference was noted in the frequency of IgM+/ IgG1+ DP B cells in the spleen. Taken together, these results suggest that elevated frequencies of IgM+/IgA+ DP B cells led to an increase of IgA production in TCRδ−/− mice.
WT IgG1
TCRδ−/−
200
50 150 100
0
IgG1 (ug/ml)
n.s.
WT IgM
TCRδ−/−
300
100 200
0
IgM (µg/ml)
n.s.
Serum
WT IgA
TCRδ−/−
800
200 600 400
0
IgA (µg/ml)
**
n.s.
WT IgG2a
TCRδ−/−
10,000
4,000 8,000
2,000 6,000
0
IgG2a (ng/ml)
A
*
WT
Fecal pellet
TCRδ−/−
150
50 100
0
IgA (µg/ml)
B
WT IgG2b
TCRδ−/−
1,000
200 600 800
400
0
IgG2b (µg/ml)
**
WT IgG3
TCRδ−/−
100
40 80
20 60
0
IgG3 (µg/ml)
n.s.
**
WT
Peritoneal lavage
TCRδ−/−
20,000
5,000 15,000 10,000
0
IgA (ng/ml)
C
Figure 1. IgA and IgG2b levels are elevated in TCRδ−/− mice. Levels of Ig isotypes were determined by ELISA in serum (A), fecal pellet (B), and peritoneal lavage (C) from WT (C57BL/6) and TCRδ−/− mice. Data are expressed as means±standard error of the mean (n=3 mice).
n.s., not significant.
*p<0.05; **p<0.01.
IgA production in BM in TCRδ
−/−mice
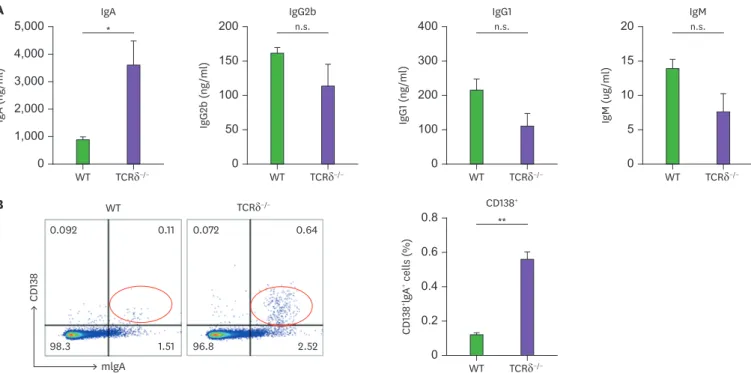
It has been shown that pro-B cells in the BM can undergo robust CSR in response to specific stimuli followed by V(D)J recombination (16). Therein, it was assumed that there are more IgA-committed B cells in TCRδ−/− BM. To address this possibility, we determined the levels of Igs in BM cells from WT and TCRδ−/− mice. As expected, IgA secretion was elevated in the cultures of TCRδ−/− BM cells and none of the other isotypes differed between WT and TCRδ−/− mice (Fig. 5A). Finally, the number of BM mIgA+CD138 (plasma cell marker)+ cells was increased by 6-fold in TCRδ−/− mice as compared to WT mice (Fig. 5B). These results clearly reveal that the higher level of IgA production by TCRδ−/− BM cells is attributed to the increased number of BM IgA-producing plasma cells.
Cellular and molecular analyses why IgA antibody is abundant in TCR δ
−/−mice
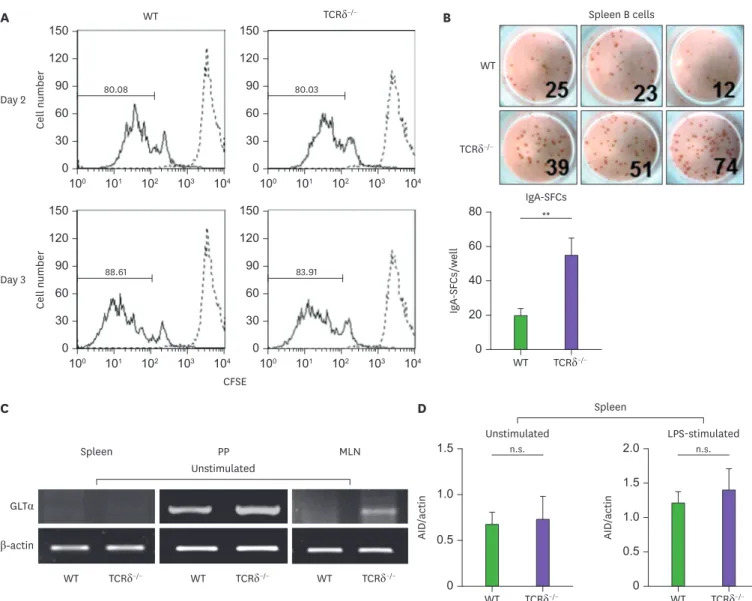
Thus far, the results from the present study reveal that γδ T cells may somehow suppress B cell differentiation toward IgA-producing plasma cells. There are 2 possibilities to explain how γδ T cells may suppress IgA production: by decreasing the total number of cells that secrete IgA, or simply by decreasing the amount of IgA secreted per cell. To distinguish between these 2 possibilities, CFSE and ELISPOT assays were performed. There was no significant difference in proliferation of B cells between the WT and TCRδ−/− mice (Fig. 6A), but the numbers of IgA-secreting cells were significantly higher in the cultures of TCRδ−/−spleen B cells (Fig. 6B). This finding was paralleled by an increase in the total amount of IgA secreted (Fig. 1).
The increase in the number of IgA-secreting cells in TCRδ−/− mice in the above experiments is due to one of 2 possibilities: 1) an increase in the frequency of B cells that switch to express
Spleen whole cells Spleen B cells
WT IgA
TCRδ−/−
4,000
1,000 3,000 2,000
0
IgA (ng/ml)
**
WT IgG2b
TCRδ−/−
500
100 300 400
200
0
IgG2b (ng/ml)
***
WT IgG1
n.s.
TCRδ−/−
80
20 60 40
0
IgG1 (ng/ml)
WT MLN
TCRδ−/−
1,500
500 1,000
0
IgA (ng/ml)
**
WT PP(−LPS)
TCRδ−/−
800
200 600 400
0
IgA (ng/ml)
* *
WT PP(+LPS)
TCRδ−/−
1,000
200 800
400 600
0
IgA (ng/ml)
WT IgA
TCRδ−/−
400
100 300 200
0
IgA (ng/ml)
**
Figure 2. B cells from various lymphoid tissues of TCRδ−/− mice readily produce IgA isotype. Spleen whole cells, spleen B cells, and MLN cells from WT and TCRδ−/− mice were cultured with LPS (12.5 µg/ml) for 7 days. Here, PP cells were cultured with or without LPS (12.5 µg/ml). Levels of Ig isotypes were determined by ELISA. Data are expressed as means±standard error of the mean (n=3 mice).
n.s., not significant.
*p<0.05; **p<0.01.
the IgA isotype, or 2) an increased proliferation of B cells that are already committed to express the IgA isotype in TCRδ−/− mice. To assess this issue, we investigated the expression of Ig GLT, an indicator of specific CSRs in spleen, PP, and MLN cells. GLTα expression in PP and MLN B cells from the TCRδ−/− mice was higher than from the WT, although it was A
WT TCRδ−/−
20
5 15 10
0
IgA+ cells (%)IgA+ cells (%)
Cell numberCell number
**
WT TCRδ−/−
30
10 20
0
IgA+ cells (%)
*
IgA+13.3
7.64 IgA+
7.53 IgA+
19.1
WT TCRδ−/− WT TCRδ−/−
Spleen MLN
WT TCRδ−/−
50
10 40 30 20
0
IgA+ cells (%)
**
WT TCRδ−/−
25
5 20 15 10
0
IgA+ cells (%)
**
IgA+19.1 IgA+
36.7
IgA+11.7 IgA+
24.5
WT TCRδ−/− WT TCRδ−/−
PP Colonic LP
B
WT TCRδ−/−
× 200
× 40 IgA+
Figure 3. Levels of mIgA are higher in TCRδ−/− mice. (A) Spleen, MLN, PP, and colonic LP cells were isolated and were analyzed for mIgA expression by FACS.
(B) Immunohistochemical analysis of mIgA expression in spleen. Data are means±standard error of the mean (n=3–6 mice).
*p<0.05; **p<0.01.
undistinguishable in unactivated spleen B cells (Fig. 6C). These results indicate that γδ T cells down-regulate IgA CSR from a very early stage of B cell differentiation. Because it is well established that AID is a prerequisite for Ig CSR (17,18), it was important to determine the levels of AID. As shown in Fig. 6D, the transcriptional level of AID in the spleen showed no difference between WT and TCRδ−/− mice regardless of the presence of LPS, indicating that γδ T cells are not associated with B cell AID expression.
A
WT mIgM+ B cells
TCRδ−/− TCRδ−/−
Whole B cells WT 2,000
500 1,500 1,000
0
IgA (ng/ml) *
*
WT
Spleen MLN
mIgM
mIgA TCRδ−/−
B
3.3%
8.7%
4.6%
9.9%
Figure 4. Numbers of mIgM/mIgA dual positive B cells are increased in TCRδ−/− mice. (A) spleen mIgM+ B cells and whole B cells were cultured with LPS (12.5 µg/ml) for 7 days. Levels of IgA were determined by ELISA. (B) Spleen and MLN cells were analyzed simultaneously for dual mIgM+/mIgA+ expression. Data are expressed as means±standard error of the mean (n=3 mice).
*p<0.01.
A
WT IgG1
TCRδ−/−
400
100 300 200
0
IgG1 (ng/ml)
n.s.
WT IgA
TCRδ−/−
5,000
1,000 3,000 4,000
2,000
0
IgA (ng/ml)
*
WT IgG2b
TCRδ−/−
200
50 150 100
0
IgG2b (ng/ml)
n.s.
B
**
WT CD138+
TCRδ−/−
0.8 0.6
0.2 0.4
0 CD138+lgA+ cells (%)
n.s.
WT IgM
TCRδ−/−
20
5 15 10
0
IgM (ug/ml)
WT
mlgA
CD138
TCRδ−/−
0.11 0.092
1.51 98.3
0.64 0.072
2.52 96.8
Figure 5. IgA production and mIgA expression in BM. (A) BM cells were cultured with LPS (12.5 µg/ml) for 7 days. Levels of Ig isotypes were determined by ELISA.
(B) BM cells were analyzed for mIgA+ and CD138+ expression by FACS. Data are expressed as means±standard error of the mean (n=3 mice).
n.s., not significant.
*p<0.05; **p<0.01.
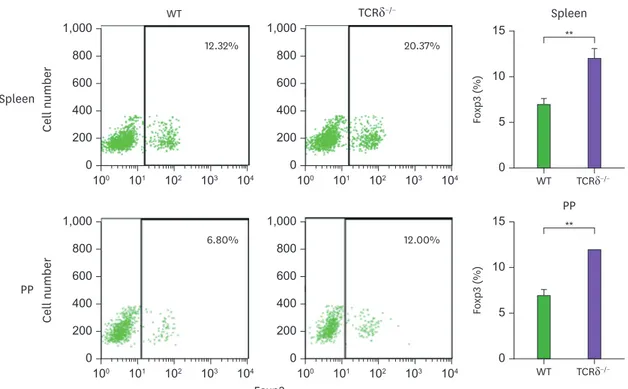
Because we and other groups have shown that CD4+CD25+ regulatory T cells (Tregs) positively regulate IgA isotype commitment (19,20), we determined the prevalence of Tregs in the spleen and PP (Fig. 7). The number of Tregs in both the spleen and PP was more than 2-fold greater in the TCRδ−/− mice compared with the WT mice. This result may provide a clue as to why overall IgA response is elevated in TCRδ−/− mice.
DISCUSSION
The present study assessed whether γδ T cells can control humoral immune response.
Unexpectedly, mucosal and systemic IgA production was substantially elevated in TCRδ−/− mice.
Thus, TCRδ−/− mice are overwhelmed with preimmune IgA all over the body: serum, fecal pellet,
C D
WT Unstimulated
n.s. n.s.
TCRδ−/−
1.5
1.0
0.5
0
AID/actin
WT
LPS-stimulated
TCRδ−/−
2.0 1.5
0.5 1.0
0
AID/actin
GLTα
β-actin
WT TCRδ−/−
WT TCRδ−/−
WT TCRδ−/−
Spleen PP
Unstimulated
MLN
Spleen
A
Day 2
Day 3
**
WT IgA-SFCs
TCRδ−/−
80 60
20 40
0
IgA-SFCs/well
B
WT
TCRδ−/−
Spleen B cells
WT TCRδ−/−
CFSE 150
104 101 102 103 100
90 120
30 60
0
80.08
150
104 101 102 103 100
90 120
30 60
0
80.03
150
104 101 102 103 100
90 120
30 60
0
88.61
150
104 101 102 103 100
90 120
30 60
0
83.91
Cell numberCell number
Figure 6. Levels of mIgA and GLTα are higher in TCRδ−/− mice. (A) Comparison of B cell proliferation between WT and TCRδ−/− mice. CFSE-labeled spleen whole cells (1×10⁶ cells) were cultured with LPS (12.5 µg/ml). B cell proliferation was assessed after 2 and 3 days by analyzing CFSE dilution. Dotted line indicates CFSE- labeled cells at day 0. (B) Numbers of IgA secreting B cells (SFCs) were measured by ELISPOT assay. (C) Levels of GLTα and β-actin were measured in spleen, PP, and MLN cells by RT-PCR. (D) Expression of AID at the transcriptional level was determined by real-time PCR. Spleen whole cells were cultured with LPS (0.5 µg/ml) when needed, and incubated for 2 days. Data are means±standard error of the mean (n=3 mice).
SFC, spot forming cell; n.s., not significant.
**p<0.01.
PP, MLN, LP, spleen, peritoneal cavity, and BM. These results strongly suggest that γδ T cells govern systemic and mucosal IgA responses. In TCRδ−/− mice, levels of IgM and most of IgG isotypes were virtually unchanged, suggesting that γδ T cells serve an important regulatory function, especially for maintenance of the normal mucosal and systemic IgA response. Because TCRδ−/− mice possess normal numbers of CD4+ αβ T cells (data not shown), it is likely that γδ T cells control unwanted IgA responses independently. Unexpectedly, our report stood in sharp contrast to certain other studies, where TCRδ−/− mice demonstrated impaired mucosal IgA responses (7); however, yet another study revealed that TCRδ−/− mice have normal IgA levels (8).
We note that the present report does not address why the discrepancies exist in the genetically identical TCRδ−/− mice. In this regard, the study, which demonstrated IgA induction by gut microbiota (21), suggests that different mouse housing environments exert a strong influence on γδ T cells, leading to totally divergent levels of IgA responses among research groups. Another possibility is that different γδ T cell subsets may participate in Ab responses. It has been shown that preimmune IgA level was diminished in TCRγ1−/− mice but little changed in TCRγ4−/−/γ6−/−
mice (8). Thus, it is evident that γδ T cell subsets can cross-talk to regulate IgA response. In the present study, parallel to the IgA findings, IgG2b isotypes were also elevated in TCRδ−/− mice. This seems to be attributed to sequential IgA CSR via transitional IgG2b CSR, as shown by us (22).
A relatively higher frequency of IgA+ B cells were found in TCRδ−/− lymphoid tissues.
The presence of large numbers of IgA+ cells in TCRδ−/− spleen is intriguing and could be interpreted as the potential spill-over of IgA switched B cells from other sites. However, studies with purified B cells revealed that there were more IgM+IgA+ DP B cells in TCRδ−/−
mice. This transient stage of B cells may switch to IgA before or when arriving in the secondary lymphoid tissues. In this regard, it has been demonstrated that pro-B cells in BM can undergo robust CSR in response to specific stimuli, followed by V(D)J recombination
**
WT Spleen
PP TCRδ−/−
15 10 5 0
Foxp3 (%)
**
WT TCRδ−/−
15 10 5 0
Foxp3 (%)
TCRδ−/−
Foxp3 WT
12.32% 20.37%
Spleen
1,000
104 101 102 103 100
600 800
200 400
0
1,000
104 101 102 103 100
600 800
200 400
0
PP
6.80% 12.00%
1,000
104 101 102 103 100
600 800
200 400
0
1,000
104 101 102 103 100
600 800
200 400
0
Cell numberCell number
Figure 7. Expression of Foxp3 in WT and TCRδ−/− mice. Spleen and PP cells were analyzed for intracellular Foxp3 expression by FACS. Data are means±standard error of the mean (n=3 mice).
**p<0.01.
(16). Thus, our unexpected finding implies that γδ T cells, by an unknown mechanism, have a negative influence on the process of IgA CSR prior to mature B cell stage.
In the present study, B cells from TCRδ−/− mice produced higher levels of IgA as compared to that of WT mice. This warrants comment. It is now well known that BM is a major site of long- term antibody production by long-lived plasma cells (23), and this seems to be the case for IgA production. Gut IgA-producing plasma cells are generated through CSR of activated B cells in the PP (24). Nevertheless, oral immunization confers a notable frequency of long-lived IgA-producing plasma cells that remain in gut LP and BM (25). Taken together, it is likely that prevalent IgA CSR occurred in TCRδ−/− mice, which can affect even the survival of long-lived IgA-producing plasma cells in BM. It remains to be determined whether IgA B cells generated from PP actually migrate to BM.
What would be the possible mechanisms by which γδ T cells actively inhibit IgA isotype switching? As shown in Fig. 6, we observed a high frequency of Foxp3+ T cells in TCRδ−/−
mice. It has been consistently shown that depletion of γδ T cells increases Foxp3+ Treg (26).
Others also have reported that γδ T cells prevent the induction of Foxp3+ Treg, resulting in inflammation promotion during experimental autoimmune encephalomyelitis (27). In this regard, we have previously demonstrated that CD4+CD25+ Tregs enhance IgA isotype commitment by expressing TGF-β1 and B cell-activating factor (BAFF) (19). It was also reported that Tregs are the major helper cells for IgA responses to microbiota antigens (20).
Further, B cells induce the proliferation of Treg that in turn promotes B cell differentiation into IgA-producing plasma cells (28). Thus, it is conceivable that an increased number of Treg producing TGF-β in TCRδ−/− mice contributes to a greater IgA response. Another possibility is that Treg is indirectly involved in IgA production, as Foxp3+ T cells in PP are preferentially converted into follicular B helper T cells (TFH) (29). These converted TFH are capable of inducing IgA production. It remains to be seen whether TFH are actually elevated in TCRδ−/− mice.
In conclusion, the present study provides the evidence to support a possible regulatory function of γδ T cells in humoral immunity. Thus, IgA production is substantially increased in TCRδ−/− mice, suggesting that γδ T cells control unwanted IgA responses. Furthermore, the frequency of Treg in PP is high in TCRδ−/− mice. As both Treg and TFH (which is converted from Treg by controlling IgA selection in PP) have a crucial role in the regulation of host–
bacteria relationships (20,28-30), it is assumed that γδ T cells play an important role in the maintenance of gut microbiota and immune homeostasis.
ACKNOWLEDGEMENTS
This work was supported by a National Research Foundation of Korea grant (NRF- 2016R1A4A1010115 and 2016R1A2B4009646 to PHK) and a 2015 Research Grant from Kangwon National University.
SUPPLEMENTARY MATERIALS
Supplementary Figure 1
Genotyping WT and TCRδ−/− mice.Click here to view
Supplementary Figure 2
Determination of IgA expression by further purified B cells. (A) mIgA− B cells were cultured with LPS (12.5 µg/ml) for 7 days. Production of IgA was determined by ELISA. (B) Spleen mIgM+ B cells were sorted and subsequently analyzed for mIgA expression by FACS (related to Figure 4).
Click here to view
Supplementary Figure 3
Numbers of mIgM+/mIgG2b+ and mIgM+/mIgG1+ B cells in WT and TCRδ−/− mice. Spleen cells were analyzed for mIgM/mIgG2b and mIgM/mIgG1 dual positivity by FACS. Data are expressed as means±standard error of the mean (n=3 mice).
Click here to view
REFERENCES
1. Born WK, Huang Y, Reinhardt RL, Huang H, Sun D, O'Brien RL. γδ T cells and B cells. Adv Immunol 2017;134:1-45.
PUBMED | CROSSREF
2. Horner AA, Jabara H, Ramesh N, Geha RS. Gamma/delta T lymphocytes express CD40 ligand and induce isotype switching in B lymphocytes. J Exp Med 1995;181:1239-1244.
PUBMED | CROSSREF
3. Strid J, Sobolev O, Zafirova B, Polic B, Hayday A. The intraepithelial T cell response to NKG2D-ligands links lymphoid stress surveillance to atopy. Science 2011;334:1293-1297.
PUBMED | CROSSREF
4. Ehl S, Schwarz K, Enders A, Duffner U, Pannicke U, Kühr J, Mascart F, Schmitt-Graeff A, Niemeyer C, Fisch P. A variant of SCID with specific immune responses and predominance of gamma delta T cells. J Clin Invest 2005;115:3140-3148.
PUBMED | CROSSREF
5. Toyabe S, Harada W, Uchiyama M. Oligoclonally expanding gammadelta T lymphocytes induce IgA switching in IgA nephropathy. Clin Exp Immunol 2001;124:110-117.
PUBMED | CROSSREF
6. Caccamo N, Battistini L, Bonneville M, Poccia F, Fournié JJ, Meraviglia S, Borsellino G, Kroczek RA, La Mendola C, Scotet E, et al. CXCR5 identifies a subset of Vgamma9Vdelta2 T cells which secrete IL-4 and IL-10 and help B cells for antibody production. J Immunol 2006;177:5290-5295.
PUBMED | CROSSREF
7. Fujihashi K, McGhee JR, Kweon MN, Cooper MD, Tonegawa S, Takahashi I, Hiroi T, Mestecky J, Kiyono H. Gamma/delta T cell-deficient mice have impaired mucosal immunoglobulin A responses. J Exp Med 1996;183:1929-1935.
PUBMED | CROSSREF
8. Huang Y, Heiser RA, Detanico TO, Getahun A, Kirchenbaum GA, Casper TL, Aydintug MK, Carding SR, Ikuta K, Huang H, et al. γδ T cells affect IL-4 production and B-cell tolerance. Proc Natl Acad Sci U S A 2015;112:E39-E48.
PUBMED | CROSSREF
9. Itohara S, Mombaerts P, Lafaille J, Iacomini J, Nelson A, Clarke AR, Hooper ML, Farr A, Tonegawa S. T cell receptor delta gene mutant mice: independent generation of alpha beta T cells and programmed rearrangements of gamma delta TCR genes. Cell 1993;72:337-348.
PUBMED | CROSSREF
10. Kim PH, Kagnoff MF. Transforming growth factor-beta 1 is a costimulator for IgA production. J Immunol 1990;144:3411-3416.
PUBMED
11. Frangakis MV, Koopman WJ, Kiyono H, Michalek SM, McGhee JR. An enzymatic method for preparation of dissociated murine Peyer's patch cells enriched for macrophages. J Immunol Methods 1982;48:33-44.
PUBMED | CROSSREF
12. Yasui H, Mike A, Ohwaki M. Immunogenicity of Bifidobacterium breve and change in antibody production in Peyer's patches after oral administration. J Dairy Sci 1989;72:30-35.
PUBMED | CROSSREF
13. Park SR, Lee JH, Kim PH. Smad3 and Smad4 mediate transforming growth factor-beta1-induced IgA expression in murine B lymphocytes. Eur J Immunol 2001;31:1706-1715.
PUBMED | CROSSREF
14. Kim PH, Kagnoff MF. Transforming growth factor beta 1 increases IgA isotype switching at the clonal level. J Immunol 1990;145:3773-3778.
PUBMED
15. Lee JM, Jang YS, Jin BR, Kim SJ, Kim HJ, Kwon BE, Ko HJ, Yoon SI, Lee GS, Kim WS, et al. Retinoic acid enhances lactoferrin-induced IgA responses by increasing betaglycan expression. Cell Mol Immunol 2016;13:862-870.
PUBMED | CROSSREF
16. Kumar S, Wuerffel R, Achour I, Lajoie B, Sen R, Dekker J, Feeney AJ, Kenter AL. Flexible ordering of antibody class switch and V(D)J joining during B-cell ontogeny. Genes Dev 2013;27:2439-2444.
PUBMED | CROSSREF
17. Muramatsu M, Kinoshita K, Fagarasan S, Yamada S, Shinkai Y, Honjo T. Class switch recombination and hypermutation require activation-induced cytidine deaminase (AID), a potential RNA editing enzyme. Cell 2000;102:553-563.
PUBMED | CROSSREF
18. Revy P, Muto T, Levy Y, Geissmann F, Plebani A, Sanal O, Catalan N, Forveille M, Dufourcq-Labelouse R, Gennery A, et al. Activation-induced cytidine deaminase (AID) deficiency causes the autosomal recessive form of the Hyper-IgM syndrome (HIGM2). Cell 2000;102:565-575.
PUBMED | CROSSREF
19. Park KH, Seo GY, Jang YS, Kim PH. TGF-β and BAFF derived from CD4+CD25+Foxp3+ T cells mediate mouse IgA isotype switching. Genes Genomics 2012;34:619-625.
CROSSREF
20. Cong Y, Feng T, Fujihashi K, Schoeb TR, Elson CO. A dominant, coordinated T regulatory cell-IgA response to the intestinal microbiota. Proc Natl Acad Sci U S A 2009;106:19256-19261.
PUBMED | CROSSREF
21. Macpherson AJ, Harris NL. Interactions between commensal intestinal bacteria and the immune system.
Nat Rev Immunol 2004;4:478-485.
PUBMED | CROSSREF
22. Park SR, Seo GY, Choi AJ, Stavnezer J, Kim PH. Analysis of transforming growth factor-beta1-induced Ig germ-line gamma2b transcription and its implication for IgA isotype switching. Eur J Immunol 2005;35:946-956.
PUBMED | CROSSREF
23. Radbruch A, Muehlinghaus G, Luger EO, Inamine A, Smith KG, Dörner T, Hiepe F. Competence and competition: the challenge of becoming a long-lived plasma cell. Nat Rev Immunol 2006;6:741-750.
PUBMED | CROSSREF
24. Bergqvist P, Stensson A, Lycke NY, Bemark M. T cell-independent IgA class switch recombination is restricted to the GALT and occurs prior to manifest germinal center formation. J Immunol 2010;184:3545-3553.
PUBMED | CROSSREF
25. Bemark M, Hazanov H, Strömberg A, Komban R, Holmqvist J, Köster S, Mattsson J, Sikora P, Mehr R, Lycke NY. Limited clonal relatedness between gut IgA plasma cells and memory B cells after oral immunization. Nat Commun 2016;7:12698.
PUBMED | CROSSREF
26. Huber SA. Depletion of gammadelta+ T cells increases CD4+ FoxP3 (T regulatory) cell response in coxsackievirus B3-induced myocarditis. Immunology 2009;127:567-576.
PUBMED | CROSSREF
27. Petermann F, Rothhammer V, Claussen MC, Haas JD, Blanco LR, Heink S, Prinz I, Hemmer B, Kuchroo VK, Oukka M, et al. γδ T cells enhance autoimmunity by restraining regulatory T cell responses via an interleukin-23-dependent mechanism. Immunity 2010;33:351-363.
PUBMED | CROSSREF
28. Wang L, Ray A, Jiang X, Wang JY, Basu S, Liu X, Qian T, He R, Dittel BN, Chu Y. T regulatory cells and B cells cooperate to form a regulatory loop that maintains gut homeostasis and suppresses dextran sulfate sodium-induced colitis. Mucosal Immunol 2015;8:1297-1312.
PUBMED | CROSSREF
29. Tsuji M, Komatsu N, Kawamoto S, Suzuki K, Kanagawa O, Honjo T, Hori S, Fagarasan S. Preferential generation of follicular B helper T cells from Foxp3+ T cells in gut Peyer's patches. Science 2009;323:1488-1492.
PUBMED | CROSSREF
30. Kawamoto S, Tran TH, Maruya M, Suzuki K, Doi Y, Tsutsui Y, Kato LM, Fagarasan S. The inhibitory receptor PD-1 regulates IgA selection and bacterial composition in the gut. Science 2012;336:485-489.
PUBMED | CROSSREF