Received on August 18, 2011. Revised on September 6, 2011. Accepted on September 19, 2011.
CC This is an open access article distributed under the terms of the Creative Commons Attribution Non-Commercial License (http://creativecommons.org/licenses/by-nc/3.0) which permits unrestricted non-commercial use, distribu- tion, and reproduction in any medium, provided the original work is properly cited.
*Corresponding Author. Tel: 82-42-611-3165; Fax: 82-42-611-3148; E-mail: ssc@eulji.ac.kr Keywords: Rheumatoid arthritis, Collagen induced arthritis, Gene expression, T-cell receptor
Gene Expression Profile of T-cell Receptors in the Synovium, Peripheral Blood, and Thymus during the Initial Phase of Collagen-induced Arthritis
Ji-Young Kim1, Mi Kyoung Lim1, Dong Hyuk Sheen1, Chan Kim2, So Young Lee1, Hyo Park1, Min Ji Lee1, Sang Kwang Lee1, Yun Sik Yang3 and Seung Cheol Shim1*
1Department of Medicine, Eulji Medi-Bio Research Institute, 2Department of Physiology, School of Medicine, Eulji University, Daejeon 302-799, 3Genome Research Center for Immune Disorders, School of Medicine, Wonkwang University, Iksan 570-749, Korea
Background: Current management strategies attempt to di- agnose rheumatoid arthritis (RA) at an early stage. Trans- cription profiling is applied in the search for biomarkers for detecting early-stage disease. Even though gene profiling has been reported using several animal models of RA, most studies were performed after the development of active ar- thritis, and conducted only on the peripheral blood and joint.
Therefore, we investigated gene expression during the initial phase of collagen-induced arthritis (CIA) before the arthritic features developed in the thymus in addition to the periph- eral blood and synovium. Methods: For gene expression anal- ysis using cDNA microarray technology, samples of thymus, blood, and synovium were collected from CIA, rats immu- nized only with type II collagen (Cll), rats immunized only with adjuvant, and unimmunized rats on days 4 and 9 after the first immunization. Arrays were scanned with an Illumina bead array. Results: Of the 21,910 genes in the array, 1,243 genes were differentially expressed at least 2-fold change in various organs of CIA compared to controls. Among the 1,243 genes, 8 encode T-cell receptors (TCRs), including CD3ζ, CD3δ, CD3ε, CD8α, and CD8β genes, which were down-regulated in CIA. The synovium was the organ in which the genes were differentially expressed between CIA and control group, and no difference were found in the thy- mus and blood. Further, we determined that the differential expression was affected by adjuvant more than Cll. The dif- ferential expression of genes as revealed by real-time RT-PCR, was in agreement with the microarray data.
Conclusion: This study provides evidence that the genes en-
coding TCRs including CD3ζ, CD3δ, CD3ε, CD8α, and CD8β genes were down-regulated during the initial phase of CIA in the synovium of CIA. In addition, adjuvant played a greater role in the down-regulation of the CD3 complex com- pared to CII. Therefore, the down-regulation of TCR gene ex- pression occurred dominantly by adjuvant could be involved in the pathogenesis of the early stage at CIA.
[Immune Network 2011;11(5):258-267]
INTRODUCTION
Rheumatoid arthritis (RA) is characterized by a chronic in- flammatory process, which primarily involves the synovial membrane and is typically associated with serologic evidence of systemic autoimmunity, culminating in loss of joint function (1). The presence of auto-antibodies, such as rheumatoid fac- tor (RF) and anti-cyclic citrullinated peptide (anti-CCP) anti- bodies, can precede the clinical manifestations of RA by many years (2). Therefore, it is recommended that effective therapy be initiated as soon as autoimmune abnormalities appear (3);
however, there are many unanswered questions regarding the pre-clinical stages of RA. The central questions relate to the factors that serve to initiate, amplify, and mature the immune responses in RA. It is difficult to investigate the molecular fea- tures in patients with RA before the onset of clinical symp- toms, which is possible in animal models.
Collagen-induced arthritis (CIA) has been used to study the basic mechanisms of autoimmune arthritis because of the clin- ical, immunologic, histologic, and genetic similarity to RA (4-6). In this model, native type-II collagen (CII), when pre- sented with an adjuvant, predictably and reproducibly precip- itates a chronic inflammatory arthritis in the joints of genet- ically-susceptible animals. The development of CIA is thought to depend on T cells, and disease susceptibility is linked to the major histocompatibility complex (MHC) (7). CII-specific CD4+T cells have been reported to be fundamental in the ini- tiation and perpetuation of CIA (8,9). Recently, abatacept, which targets T-cell modulation via the co-stimulatory CD80/
CD86:CD28 pathway, exemplifies the rationale and efficacy of using T-cell modulation as a therapeutic approach (10).
Therefore, the abnormality in T cell-related immunity plays a role in the pathogenesis of RA. In addition, the primary mechanism leading to tolerance to self-antigens is the dele- tion of self-reactive T cells in the thymus through the mecha- nism by which T cells with a high affinity for self-peptides undergo the active induction of apoptosis. Autoimmune ar- thritis in various animal models can be attributed to a defect in T cell selection within the thymus (11-13). Since, we ques- tioned where and when T cell immunity dysregulation occurs, we investigated the gene expression of T cell-related mole- cules, in the thymus, peripheral blood and synovium during the initiation phase of CIA using cDNA microarray technology followed by validation using real-time PCR.
MATERIALS AND METHODS Animals
Adult female Lewis rats (7 weeks old) weighing approx- imately 150 g were obtained from Harlan (Indianapolis, IN, USA), housed under standard conditions, and given free ac- cess to food and water. The rats were adapted to the new conditions for at least 7 days before the initiation of the studies. All experiments were conducted in accordance with the animal care guidelines of the National Institutes of Health and the Korean Academy of Medical Sciences. This study was approved by the Eulji University Animal Institutional Review Board.
Rat CIA model
Chicken CII (Sigma-Aldrich, St. Louis, MO, USA) was dis- solved in 0.05 M acetic acid to a final concentration of 4 mg/ml. CII emulsified in incomplete Freundʼs adjuvant (IFA)
was homogenized at a 1:1 ratio using a PowerGen 35 (Fisher Scientific, Pittsburgh, PA, USA). For the induction of CIA, rats, 8 weeks old (n=3 per group), were immunized intradermally at the base of the tail with 0.2 ml of the emul- sion on day 0, followed by one-half volume of each on day 7. Another group of rats were immunized only with and equivalent volume of IFA, only with CII on the same days.
Non-immunized rats were used of control group.
Arthritis was assessed daily, and inflammation was scored, as described by Nanakumar and co-workers (14). In our pre- vious study, the induction ratio of CIA was >86%.
Each experimental condition was reproduced three times (RNA isolation, probe preparation, and independent hybrid- ization), and each replicate contained RNA samples pooled from three animals.
For gene expression analysis, the sample was collected on days 0 (control), 4, and 9. Sample tissues from three rats were collected at each time point. Blood was collected through the postcaval vein from each animal. Synovium was collected from the posterior knee joint. Samples were treated with RNAlater (Ambion, Austin, TX, USA) to prevent RNA degra- dation.
RNA preparation
Total RNA was extracted using Trizol (Invitrogen Life Technologies, Carlsbad, CA, USA) and purified using RNeasy columns (Qiagen, Valencia, CA, USA), according to the man- ufacturerʼs protocol. After processing with DNase digestion and clean-up procedures, the RNA samples were quantified, aliquotted, and stored at -80oC until use. For quality control, RNA purity and integrity were evaluated by denaturing gel electrophoresis, the OD 260/280 ratio, and analyzed on an Agilent 2100 Bioanalyzer (Agilent Technologies, Palo Alto, CA, USA).
Labeling and purification
Total RNA was amplified and purified using the Ambion Illumina RNA amplification kit (Ambion) to yield biotinylated cRNA, according to the manufacturerʼs instructions. Briefly, 550 ng of total RNA was reverse-transcribed to cDNA using a T7 oligo (dT) primer. Second-strand cDNA was synthesized, in vitro-transcribed, and labeled with biotin-NTP. After purifi- cation, the cRNA was quantified using a ND-1000 spectropho- tometer (NanoDrop, Wilmington, DE, USA).
Table I. Primer sequences used in real-time PCR
Gene Forward Reverse
CD8α 5’-GGCCAGGAGGTGAAGCTAAC-3’ 5’-GCTAGGCTTGCTCAGGGTGA-3’
CD8β 5’-CATGGATGTGAAGCCAGAGG-3’ 5’-ATGAAGTGAATCCGGGCTCT-3’
CD3δ 5’-GTGCCAGAACTGTGTGGAGC-3’ 5’-TGGCCTGCAAAGCAGTAGAC-3’
CD3ε 5’-ATGCAGTGGAACGCTTTCTG -3’ 5’-GAGGGCACGTCAGCTCTACG-3’
CD3ζ 5’-GCTGCTTACCTTCAGGACCC-3’ 5’-GCTGAGACCCTGGTAAAGGC-3’
Hybridization and data export
Seven hundred fifty nanograms of labeled cRNA samples were hybridized to each Rat-12 expression bead array for 16
∼18 h at 58oC, according to the manufacturerʼs instructions (Illumina Inc., San Diego, CA, USA). Detection of array sig- nals was carried out using Amersham fluorolink streptavi- din-Cy3 (GE Healthcare Bio-Sciences, Little Chalfont, UK), ac- cording to the bead array manual. Arrays were scanned with an Illumina bead array Reader confocal scanner, according to the manufacturerʼs instructions. Array data export processing and analysis was performed using Illumina BeadStudio.
Raw data preparation and statistical analysis The quality of hybridization and overall chip performance were monitored by visual inspection of internal quality con- trol checks and the raw scanned data. Raw data were ex- tracted using the software provided by the manufacturer (BeadStudio v. 3.3.0). Array data were filtered by a detection p-value<0.05 (similar to signal-to-noise) in at least 50% of the samples. We applied a filtering criterion for data analysis;
a higher signal value was required to obtain a detection p-val- ue<0.05. The selected gene signal value was transformed by logarithm and normalized by the quantile method. Compara- tive analyses were carried out using a |fold|>2. Hierarchical cluster analysis was performed using complete linkage and Euclidean distance as a measure of similarity. All data analy- ses and visualization of differentially-expressed genes were conducted using ArrayAssist® (Stratagene, La Jolla, CA, USA).
Ontology-based analyses were performed using the Panther database (http://www.pantherdb.org).
Reverse transcription and real-time PCR
Reverse transcription (RT) was carried out according to the instructions in the ImProm-IITM reverse transcription system (Promega, Madison, WI, USA). In brief, 1 μg of total RNA was reverse-transcribed in a total volume of 20 μl using an
oligo-dT primer. The RT reaction was performed at 25oC for 5 min, 42oC for 1 hr, and 70oC for 15 min. One μl of cDNA was used as a template for real-time PCR in a 25 μl reaction mixture, including 0.75 U of GoTaq DNA polymerase (Promega), 5μl of 5X buffer, 0.2 mm of dNTP (Promega), 2.5μl of 3000X SYBR Green I (BMA, Rockland, ME, USA), and 10 pM of each primer. Oligonucleotide primers for re- al-time PCR were prepared using Primer 3 software (White- head Institute/MIT Center for Genomes Research, Cambridge, MA; http://www.bioneer.co.kr/cgi-bin/primer/primer3.cgi).
Information and sequences of primers of the steroidogenic enzymes tested in the present study are summarized in Table I. The PCR program used an initial step of 95oC for 5 min for pre-denaturation, followed by denaturation at 94oC, an- nealing, and extension at 72oC using the PTC-200 Chromo 4 real-time system (Bio-Rad Laboratories, Hercules, CA, USA).
The final extension was carried out for 10 min at 72oC.
Beta-actin was included as an internal PCR control. For quan- tification of real-time PCR results, the relative standard curve method was used to obtain quantitative values. Each sample was replicated three-to-four times, and the normalized mean value to beta-actin was used for final comparison.
Real-time PCR data presentation and statistical analysis
Data for mRNA abundance were expressed relative to the control and CIA groups on days 4 and 9. In the figures, data are presented as the mean±standard error. Comparisons be- tween CIA and controls were performed using one-way anal- ysis of variance, followed by the Mann-Whitney U test, using SPSS software (SPSS Inc., Chicago, IL, USA). In all cases, a p<0.05 was considered statistically significant.
Histology
At the end of each experiment, the knee joints were fixed in 4% formalin for 2 days, decalcified in EDTA for 3 weeks, then embedded in paraffin. From the paraffin-embedded tis-
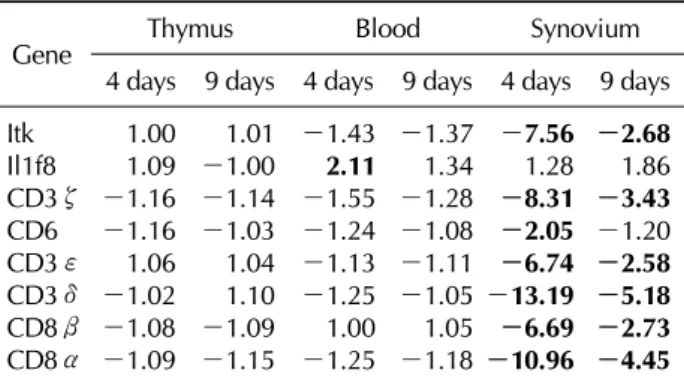
Table II. List of immune-mediated genes that were up- or down-regulated in each organ of CIA compared to control groups
Gene Thymus Blood Synovium
4 days 9 days 4 days 9 days 4 days 9 days Itk 1.00 1.01 -1.43 -1.37 -7.56 -2.68
Il1f8 1.09 -1.00 2.11 1.34 1.28 1.86
CD3ζ -1.16 -1.14 -1.55 -1.28 -8.31 -3.43 CD6 -1.16 -1.03 -1.24 -1.08 -2.05 -1.20 CD3ε 1.06 1.04 -1.13 -1.11 -6.74 -2.58 CD3δ -1.02 1.10 -1.25 -1.05 -13.19 -5.18 CD8β -1.08 -1.09 1.00 1.05 -6.69 -2.73 CD8α -1.09 -1.15 -1.25 -1.18 -10.96 -4.45 The data shown here are the ratio of gene expression of the CIA-to-control group in each organ.
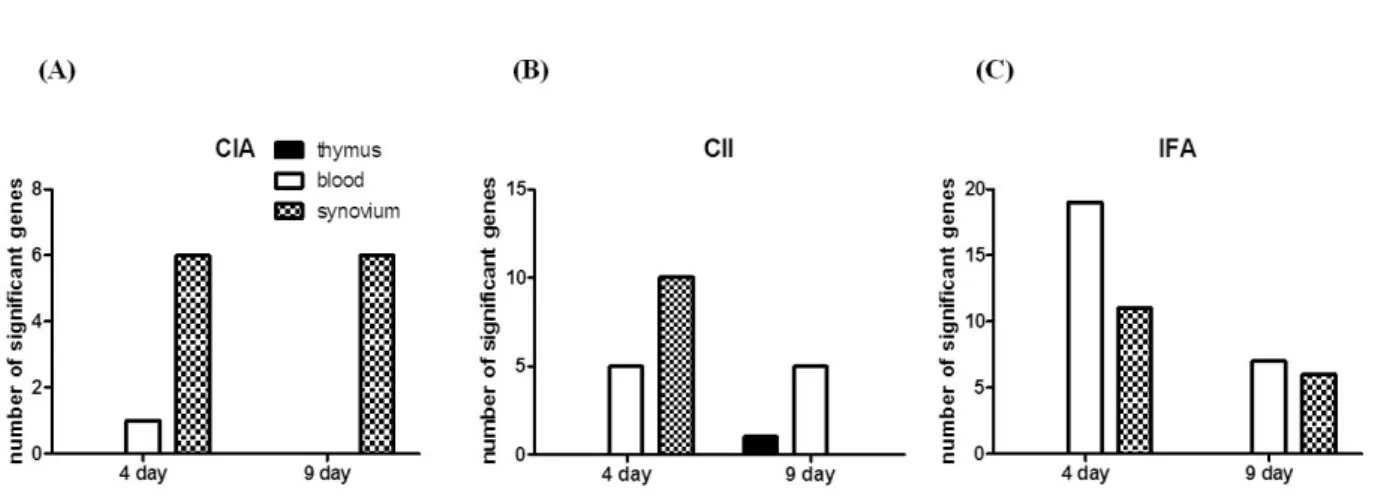
Figure 1. Number of immune-related genes differentially-expressed in the early phase of CIA. RNA samples were collected from the thymus, blood, and synovium of the CIA and control groups on days 4 and 9 after the 1st immunization. A RatRef-12 expression beadchip with 21,910 gene specificities was used to define the gene expression profile in CIA and control rats. Only immune-related genes differentially-expressed between the CIA and control groups are shown here. Most genes differentially-expressed in CIA were shown in the synovium on days 4 and 9 (dotted bar), whereas 1 gene in the blood was shown on day 4 (white bar), and no genes were shown in the thymus (black bar).
sue blocks, 2-μm sections were cut and stained with haema- toxylin-eosin for histologic analysis.
RESULTS
A great number of genes were significantly modulated during the initiation stage of CIA
To define the gene expression profile in the initiation stages of CIA, we used a expression chip with 21,910 gene specificities. First, gene expression was compared between the CIA and control groups on days 4 and 9 after the 1st immunization. We observed 1,243 genes were expressed dif- ferentially in CIA on day 4 than on day 9, which could be attributable to a biological process or molecular function (Fig.
1). Table II shows the list of up- or down-regulated genes according to the organ in which they were differ- entially-expressed. We found that the synovium was the or- gan in which most genes were differentially-expressed, and only one gene, Il1f8, was differentially-expressed in the blood. No gene was differentially-expressed in the thymus.
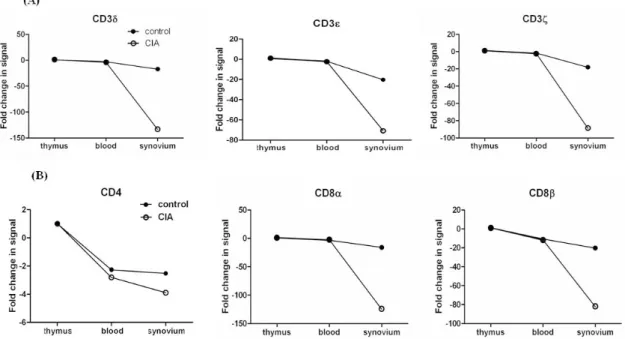
Differential expression of genes encoding T-cell receptors (TCRs) in arthritic synovial tissue of CIA Since we founded on T cell associated genes, we analyzed genes related to TCR/CD3 complex, including CD3δ, CD3ε,
and CD3ζ. Interestingly, most genes encoding TCR were down-regulated in CIA (Fig. 2A). Day 4 showed a greater dif- ference in gene expression than day 9 between CIA and controls. Next, we analyzed which organ showed differ- entially expressed genes. The synovium was the only organ in which the genes were differentially expressed between CIA and control groups, whereas no difference was found in the thymus and blood.
Next, we analyzed gene expressions of CD4 and CD8 which are another T cell surface molecules that play an addi- tional role in T cell recognition (15). The expression of the CD8α and CD8β genes were reduced significantly in CIA, howerer the CD4 gene was expressed similarly between CIA and control groups (Fig. 2B). To validate our microarray find- ings, we performed real-time RT-PCR on the genes of TCR/CD3 and T cell co-receptors using independent animals.
The expression of CD3δ, CD3ε, CD3ζ, CD8α, and CD8β, as revealed by RT-PCR, was in agreement with the microarray data (Fig. 3).
Gene expression profile in rats immunized only with CII or adjuvant
We next determined whether the differential expression of T cell-mediated genes was more affected by CII or adjuvant.
We compared four groups of rats, including rats immunized both with IFA and CII (CIA), rats immunized only with IFA (rIFA), rats immunized only with CII (rCII), and unimmunized rats. Asshown in the previous analysis between the CIA and control groups, gene expression profile showed greater differ- ence on day 4 than day 9 both in rCII and rIFA (Fig. 4).
Figure 2. The ratio of TCR-related gene expression of the CIA-to-control group in each organ in the initiation phase of CIA. TCR-related gene expression was compared between the CIA and control groups. The data shown here are the ratio of gene expression of the CIA-to-control group in each organ. (A) CD3 complex gene expression. CD3δ, CD3ε, and CD3ζ gene expression was down-regulated in the synovium of CIA, with no differences in the thymus and blood. (B) CD4 and CD8 gene expression. CD8α and CD8β gene expression was down-regulated in the synovium of CIA, with no difference in the thymus and blood. No difference in CD4 gene expression existed between the CIA and control groups in the synovium, thymus, or blood.
(A) (B) (C)
(D) (E)
Figure 3. Validation of the CD3 complex and CD8 gene expression in CIA and control groups. RT-PCR was performed using SYBR and a specific primer set for (A) CD3δ, (B) CD3ε, (C) CD3ζ, (D) CD8α, and (E) CD8β. The RNA samples are independent of the samples used for microarray analysis. Data are expressed as the mean±SD. *p<0.05 by the Mann-Whitney U test.
Figure 4. Number of genes differentially-expressed in CIA and rats immunized only with CII or adjuvant. To define the gene expression profile in the initiation stages of CIA, we used a RatRef-12 expression beadchip (Illumina Inc., San Diego, CA, USA) with 21,910 gene specificities, and compared the following 3 groups of rats with the control group: (A) IFA/CII immunized (CIA), (B) CII immunized, and (C) IFA (MDP). Samples were collected from the thymus (black bar), blood (white bar), and synovium (dotted bar).
Table III. List of TCR-mediated genes that were up- or down-regulated in the synovium of CIA compared to control depending on various inducers
Gene
Fold change (treatment/control)
CII IFA CIA
4 day 9 day 4 day 9 day 4 day 9 day CD3δ -1.89 1.53 -21.84 -3.19 -14.84 -5.48 CD3ε -3.17 -1.35 -6.03 -1.86 -7.68 -2.77 CD3ζ -1.61 1.20 -10.59 -2.59 -9.46 -3.72 CD4 -4.13 -1.46 -2.44 -1.88 -1.63 1.02 CD8α -2.46 -1.09 -21.48 -4.03 -11.96 -4.59 CD8β -2.31 -1.06 -9.73 -2.92 -7.60 -2.93 The data shown here are the ratio of gene expression of the immunized rat-to-control group in each organ.
CIA: collagen induced arthritis, CII: native type-II collagen, IFA:
incomplete Freund adjuvant.
Most genes were differentially expressed in the synovium, whereas the thymus showed only one gene differentially-ex- pressed in rCII on day 9.
Interestingly, the synovium of CII showed down-regulation of one CD3 complex gene, CD3ε, whereas the synovium of IFA showed down-regulation of more genes including CD3δ, CD3ε, and CD3ζ on day 4, as shown in CIA (Table III).
Furthermore, the difference of gene expression compared to controls was greater in rIFA than in CIA. In terms of T cell co-receptor, even though both the synovium of rCII and rIFA
showed down-regulation of CD8α and CD8β, a greater dif- ference in gene expression was shown in rIFA compared to rCII or CIA. CD4 gene expression was decreased in rIFA com- pared to rCII, which was not shown in CIA.
In addition, other genes were expressed differentially on rCII or rIFA, which was not differentially expressed in CIA.
The blood of rCII revealed up-regulation of Btk, Tmpo, and Tapbp on day 4, and up-regulation of IL9r and Ciita, and down-regulation of Ctss and Sh2d2a on day 9. The synovium of rCII showed up-regulation of Sqstm1 and down-regulation of Tapbp, Hla-dma, and Nfatc3 (Table IV).
The blood of rIFA showed up-regulation of IL1f8, Adora2a, Tnfrsf1a, and Ifi35, in addition to that showed the genes that showed increased expression in rCII on day 4. The Sh2d2a, Ctse, Gzmk, and Itk were down regulated in the blood of rIFA, and the synovium of rIFA showed down-regulation of Sh2d2a, Ctse, Nfatc3, Sla, and Itk on day 4 (Table V).
Pathologic analysis of synovium in CIA rats and controls
We also examined synovia pathologically at the initiation time, but there were no differences among the four groups, including CIA, rIFA, rCII, and unimmunized. These results in- dicated that there were changes at the molecular level before histologic changes began, including synovial hypertrophy, pannus formation, cartilage destruction, and bone erosion.
Table IV. List of immune-mediated genes that were up- or down-regulated in each organ of rats immunized only with CII compared to control groups
Gene Thymus Blood Synovium
Day 4 Day 9 Day 4 Day 9 Day 4 Day 9 Btk -1.21 -1.21 2.06 -1.29 -1.64 -1.66
Tmpo 1.17 1.77 2.25 1.98 1.47 1.17
Tapbp -1.13 1.05 2.49 1.18 -2.39 -1.09 CD3δ 1.05 1.04 -2.26 -1.05 -1.89 1.53 Sqstm2 1.00 -1.02 -1.08 1.21 2.21 -1.04 Sqstm1 1.20 -1.19 1.78 -1.30 -2.40 1.15 Hla-dma -1.04 -1.43 -1.09 -1.50 -3.05 -1.33
CD4 1.14 1.33 1.19 -1.12 -4.13 -1.46
CD8β 1.23 -1.16 -1.05 1.52 -2.31 -1.06
CD3ε 1.15 1.05 1.11 1.25 -3.17 -1.35
CD8α -1.30 -1.08 -1.46 1.03 -2.46 -1.09
Il9r 1.46 1.55 1.38 2.14 1.17 1.13
Ctss -1.63 -2.15 -1.16 -2.25 1.08 -1.52
Ciita 1.15 1.15 1.69 2.19 1.23 -1.24
Sh2d2a -1.12 -1.28 -1.49 -2.04 -1.33 -1.04 The data shown here are the ratio of gene expression of the immunized rat-to-control group in each organ.
Table V. List of immune-mediated genes that were up- or down-regulated in each organ of rats immunized only with adjuvant compared to control groups
Gene Thymus Blood Synovium
Day 4 Day 9 Day 4 Day 9 Day 4 Day 9 Il1f8 1.42 1.00 2.87 2.21 -1.01 1.02 Adora2a 1.55 1.27 2.49 2.05 1.35 1.51 Btk -1.03 -1.36 2.20 -1.02 -1.62 -1.46 Tnfrsf1a -1.17 1.16 2.70 2.20 1.14 1.43
Tmpo 1.25 1.29 2.30 1.98 -1.02 1.24
Tapbp -1.20 -1.08 2.16 -1.07 -1.12 -1.13 Ifi35 -1.13 -1.03 2.26 1.94 -1.02 1.05 Sqstm1 1.23 1.42 2.00 -1.04 1.60 1.30 Sh2d2a -1.19 -1.02 -2.35 -2.25 -2.15 -1.34 Ctse -1.27 1.00 -2.04 -1.73 -2.61 -1.74 CD8α -1.38 -1.24 -2.20 -1.24 -21.48 -4.03 CD3δ 1.03 1.11 -2.21 -1.31 -21.84 -3.19 Itk -1.05 1.33 -2.70 -2.16 -9.22 -2.26 Gzmk -1.09 1.07 -3.25 1.53 -1.01 -1.00 CD3ζ -1.00 1.08 -2.21 -1.39 -10.59 -2.59 Nfatc3 1.02 1.09 -1.82 -1.30 -3.04 -1.42 CD4 -1.05 1.15 1.58 1.63 -2.44 -1.88 Sla 1.28 1.32 -1.01 1.11 -2.01 -1.46 CD8β 1.07 1.03 -1.04 1.45 -9.73 -2.92 CD3ε 1.09 1.11 -1.41 -1.23 -6.03 -1.86 The data shown here are the ratio of gene expression of the immunized rat-to-control group in each organ.
DISCUSSION
During the 1990s, the widely accepted concept of cytokine networks perpetuating disease, with tumor necrosis factor (TNF)-α assuming a hierarchical role (16), was supported by the success of TNF-α-blocking treatment in RA (17,18).
However, the lack of universal benefit from TNF-α-blocking therapy (19) has focused attention to alternative upstream im- munologic mediators. The central questions relate to the fac- tors that serve to initiate, amplify, and mature the immune responses in RA. Gene expression profiles at different stages of CIA have been reported previously (20). However, it is difficult to determine the causal genes in those studies be- cause too many genes were already expressed when in- flammatory features developed. Thus, we were interested in gene expression profiles at an earlier time point, such as im- mediately after the 1st immunization. Especially, we inves- tigated focused on T cell immunity-related genes because sev- eral observations over the years supported a fundamental role for T cells in RA (21,22). RA synovium contains a rich in- filtrate of activated CD4+ cells and MHC class II molecules (23) with a correlation between the number of synovial T cells and the severity of joint damage (24). In addition, we
considered which organs would be involved in dysregulation of T cell-mediated immunity in RA, because there were sev- eral lines of evidence that thymic abnormalities were asso- ciated with the pathogenesis of RA. The identification of other joint-specific antigens, such as gp-39 in thymic Hassallʼs cor- puscles and medullary epithelial cells, provide new insight in- to the mechanisms of RA pathogenesis and may lead to more specific and physiologic methods of immune-modulation (25). Therefore, we investigated central immune organ, even thought thymus would not be affected by immunization. We determined the genome-wide expression profile of the thy- mus in addition to synovial joints and peripheral blood.
Our original hypothesis was that T cells could escape neg- ative selection because intracellular signal transduction of thy- mocytes was dysregulated. The TCR/CD3 complex is one of the most intricate membrane receptor structures because it consists of six distinct chains (26,27). The clonotypic α and β chains of the TCR are responsible for recognizing antigen embedded in the MHC molecule present on the surface of
antigen-presenting cells (APCs). The remaining chains, collec- tively called the CD3 complex, include the CD3-γ, -δ, -ε, and -ζ chains (26). T cells implicated in chronic in- flammatory diseases, such as RA, respond weakly when stimulated in vitro with mitogen or antigen (28). Decreased expression of the TCR-associated CD3ζ chain has been sug- gested, but the mechanism underlying this hypo-responsive- ness is unclear (29-33). Therefore, we investigated when TCR started to be decreased in the course of CIA development.
We focused on the initiation time before looking at the whole picture through the total period of CIA development.
In our study, TCR down-regulation occurred at an early phase of CIA, and most genes expressed differentially were found in the synovium, not in the thymus and blood.
Synovium tissue contains heterogeneous population of stro- mal cells and immune cells. Especially, there was definitely higher number of lymphocyte infiltrated in the synovium of CIA than control. Therefore, the expression of T cell re- ceptors should be increase in CIA. However, we found the opposite result which is consistent with the result of former studies in which TCR-associated CD3ζ chain is decreased in CIA and RA (31,33). It was leading to the hypothesis that the synovium might play a pathologic role on T cells which re- mains to be clarified.
It has been reported that there is a correlation between the levels of TNF-α produced after anti-CD3 or PHA stimulation and the expression of CD3ζ (34). However, in our study, TNF-α had not been expressed until day 9. Therefore, we could guess that TNF-α was not involved in CD3ζ down-regulation, which remains to be clarified.
Another T cell surface molecules, CD4 and CD8, play a crit- ical role in T cell recognition and activation by binding to their respective class II and I MHC ligands on APCs. In addi- tion, CD4 and CD8 are also involved in post-binding events that lead to CTL activation and subsequent lysis of the target cells (35).
CD8 T cells are part of the T cell pool infiltrating the syno- vium in RA. However, the role of CD8 T cells in the patho- genesis of RA has not been fully delineated. In our study, the gene expression of CD8 receptors also decreased in the CIA group compared to the control group. Therefore, with down-regulation of the CD3 complex and CD8 receptors, T cells would be severely defective in activation.
Next, we questioned which factor would play a greater role in the down-regulation of TCR genes. The synovium from the rats immunized only with CII showed down-regulation of on-
ly one gene, CD3ε, whereas the synovium in the rats immu- nized only with adjuvant showed down-regulation of CD3δ, CD3ε, and CD3ζ, which showed a greater difference of gene expression compared to CII-immunized rats or CIA. T cell co-receptors, CD8α, and CD8β, which were down-regu- lated in CIA, showed a greater difference of gene expression in adjuvant-immunized rats compared to CII-immunized rats or CIA. CD4 gene expression was decreased both in ad- juvant-immunized rats and CII-immunized rats, which was not shown in CIA. Taken together, adjuvant played a greater role in the down-regulation of the CD3 complex and co-receptors.
Therefore, infectious triggers might play an important role in the down-regulation of the TCR gene CIA.
Furthermore, more genes were shown to be expressed dif- ferentially when we immunized rats with CII or adjuvant com- pared to the CIA. Even the blood in the rats immunized with CII only and with adjuvant only revealed another genes which were expressed differentially, including Btk, Tmpo, Tapbp, IL9r, Ciita, Ctss, Sh2d2a, Sqstm1, Tapbp, Hla-dma, Nfatc3, IL1f8, Adora2a, Tnfrsf1a, Ifi35, Ctse, Gzmk, and Itk.
The function of those genes in the pathogenesis of CIA re- mains to be elucidated.
ACKNOWLEDGEMENTS
This work was supported by a grant from the Korea Health 21 R&D Project by Ministry of Health & Welfare (01-PJ3- PG6-01GN09-003).
CONFLICTS OF INTEREST
The author have no financial conflict of interest.
REFERENCES
1. Firestein GS, Zvaifler NJ. Rheumatoid Arthritis: A Disease of Disordered Immunity. New York: Raven Press; 1992.
2. Aho K, Heliövaara M, Maatela J, Tuomi T, Palosuo T:
Rheumatoid factors antedating clinical rheumatoid arthritis.
J Rheumatol 18;1282-1284, 1991.
3. Cush JJ: Early rheumatoid arthritis - is there a window of opportunity? J Rheumatol (Suppl) 80;1-7, 2007.
4. Durie FH, Fava RA, Noelle RJ: Collagen-induced arthritis as a model of rheumatoid arthritis. Clin Immunol Immuno- pathol 73;11-18, 1994.
5. Brunsberg U, Gustafsson K, Jansson L, Michaëlsson E, Ahrlund-Richter L, Pettersson S, Mattsson R, Holmdahl R:
Expression of a transgenic class II Ab gene confers suscept-
ibility to collagen-induced arthritis. Eur J Immunol 24;1698- 1702, 1994.
6. Stuart JM, Townes AS, Kang AH: Nature and specificity of the immune response to collagen in type II collagen-in- duced arthritis in mice. J Clin Invest 69;673-683, 1982.
7. Wooley PH, Luthra HS, Stuart JM, David CS: Type II colla- gen-induced arthritis in mice. I. Major histocompatibility complex (I region) linkage and antibody correlates. J Exp Med 154;688-700, 1981.
8. Myers LK, Rosloniec EF, Cremer MA, Kang AH:
Collagen-induced arthritis, an animal model of autoim- munity. Life Sci 61;1861-1878, 1997.
9. Thornton S, Sowders D, Aronow B, Witte DP, Brunner HI, Giannini EH, Hirsch R: DNA microarray analysis reveals novel gene expression profiles in collagen-induced arthritis. Clin Immunol 105;155-168, 2002.
10. Choy EH: Selective modulation of T-cell co-stimulation: a novel mode of action for the treatment of rheumatoid arthritis. Clin Exp Rheumatol 27;510-518, 2009.
11. Fournier C: Where do T cells stand in rheumatoid arthritis?
Joint Bone Spine 72;527-532, 2005.
12. Mandik-Nayak L, Allen PM: Initiation of an autoimmune re- sponse: insights from a transgenic model of rheumatoid arthritis. Immunol Res 32;5-13, 2005.
13. Sakaguchi N, Takahashi T, Hata H, Nomura T, Tagami T, Yamazaki S, Sakihama T, Matsutani T, Negishi I, Nakatsuru S, Sakaguchi S: Altered thymic T-cell selection due to a mu- tation of the ZAP-70 gene causes autoimmune arthritis in mice. Nature 426;454-460, 2003.
14. Nandakumar KS, Svensson L, Holmdahl R: Collagen type II-specific monoclonal antibody-induced arthritis in mice:
description of the disease and the influence of age, sex, and genes. Am J Pathol 163;1827-1837, 2003.
15. Miceli MC, Parnes JR: The roles of CD4 and CD8 in T cell activation. Semin Immunol 3;133-141, 1991.
16. Feldmann M, Brennan FM, Maini RN: Role of cytokines in rheumatoid arthritis. Annu Rev Immunol 14;397-440, 1996.
17. Maini R, St Clair EW, Breedveld F, Furst D, Kalden J, Weisman M, Smolen J, Emery P, Harriman G, Feldmann M, Lipsky P: Infliximab (chimeric anti-tumour necrosis fac- tor alpha monoclonal antibody) versus placebo in rheuma- toid arthritis patients receiving concomitant methotrexate:
a randomised phase III trial. ATTRACT Study Group.
Lancet 354;1932-1939, 1999.
18. Moreland LW, Baumgartner SW, Schiff MH, Tindall EA, Fleischmann RM, Weaver AL, Ettlinger RE, Cohen S, Koopman WJ, Mohler K, Widmer MB, Blosch CM:
Treatment of rheumatoid arthritis with a recombinant hu- man tumor necrosis factor receptor (p75)-Fc fusion protein.
N Engl J Med 337;141-147, 1997.
19. Lipsky PE, van der Heijde DM, St Clair EW, Furst DE, Breedveld FC, Kalden JR, Smolen JS, Weisman M, Emery P, Feldmann M, Harriman GR, Maini RN; Anti-Tumor Necrosis Factor Trial in Rheumatoid Arthritis with Concom- itant Therapy Study Group: Infliximab and methotrexate in the treatment of rheumatoid arthritis. Anti-Tumor Necrosis Factor Trial in Rheumatoid Arthritis with Concomitant Therapy Study Group. N Engl J Med 343;1594-1602, 2000.
20. Booth G, Newham P, Barlow R, Raines S, Zheng B, Han S: Gene expression profiles at different stages of colla- gen-induced arthritis. Autoimmunity 41;512-521, 2008.
21. Calin A, Elswood J, Klouda PT: Destructive arthritis, rheu- matoid factor, and HLA-DR4. Susceptibility versus severity, a case-control study. Arthritis Rheum 32;1221-1225, 1989.
22. Winchester R: The molecular basis of susceptibility to rheu- matoid arthritis. Adv Immunol 56;389-466, 1994.
23. Van Boxel JA, Paget SA: Predominantly T-cell infiltrate in rheumatoid synovial membranes. N Engl J Med 293;517- 520, 1975.
24. Kraan MC, Smeets TJ, van Loon MJ, Breedveld FC, Dijkmans BA, Tak PP: Differential effects of leflunomide and methotrexate on cytokine production in rheumatoid arthritis. Ann Rheum Dis 63;1056-1061, 2004.
25. Berthelot JM, le Goff B, Maugars Y: Thymic Hassall's cor- puscles, regulatory T-cells, and rheumatoid arthritis. Semin Arthritis Rheum 39;347-355, 2010.
26. Call ME, Wucherpfennig KW: Molecular mechanisms for the assembly of the T cell receptor-CD3 complex. Mol Immunol 40;1295-1305, 2004.
27. Kuhns MS, Davis MM, Garcia KC: Deconstructing the form and function of the TCR/CD3 complex. Immunity 24;133- 139, 2006.
28. Kiessling R, Kono K, Petersson M, Wasserman K:
Immunosuppression in human tumor-host interaction:
role of cytokines and alterations in signal-transducing molecules. Springer Semin Immunopathol 18;227-242, 1996.
29. Finke JH, Zea AH, Stanley J, Longo DL, Mizoguchi H, Tubbs RR, Wiltrout RH, O'Shea JJ, Kudoh S, Klein E, Bukowski RM, Ochoa AC: Loss of T-cell receptor zeta chain and p56lck in T-cells infiltrating human renal cell carcino- ma. Cancer Res 53;5613-5616, 1993.
30. Maurice MM, Lankester AC, Bezemer AC, Geertsma MF, Tak PP, Breedveld FC, van Lier RA, Verweij CL: Defective TCR-mediated signaling in synovial T cells in rheumatoid arthritis. J Immunol 159;2973-2978, 1997.
31. Matsuda M, Ulfgren AK, Lenkei R, Petersson M, Ochoa AC, Lindblad S, Andersson P, Klareskog L, Kiessling R:
Decreased expression of signal-transducing CD3 zeta chains in T cells from the joints and peripheral blood of rheumatoid arthritis patients. Scand J Immunol 47;254-262, 1998.
32. Trimble LA, Lieberman J: Circulating CD8 T lymphocytes in human immunodeficiency virus-infected individuals have impaired function and downmodulate CD3 zeta, the signal- ing chain of the T-cell receptor complex. Blood 91;585-594, 1998.
33. Berg L, Rönnelid J, Klareskog L, Bucht A: Down-regulation of the T cell receptor CD3 zeta chain in rheumatoid arthritis (RA) and its influence on T cell responsiveness. Clin Exp Immunol 120;174-182, 2000.
34. Tartour E, Latour S, Mathiot C, Thiounn N, Mosseri V, Joyeux I, D'Enghien CD, Lee R, Debre B, Fridman WH:
Variable expression of CD3-zeta chain in tumor-infiltrating lymphocytes (TIL) derived from renal-cell carcinoma: rela- tionship with TIL phenotype and function. Int J Cancer
63;205-212, 1995.
35. de Vries JE, Yssel H, Spits H: Interplay between the TCR/CD3 complex and CD4 or CD8 in the activation
of cytotoxic T lymphocytes. Immunol Rev 109;119-141, 1989.