서 론
2011년 통계청이 발표한 자료에 따르면, 한국의 노인인구는 2014년 전체인구의 12.7%를 차지하고 있는데 이는 2000년에 비해 2배 증가 한 것이며, 2018년에는 14.3%로 증가하여 고령사회로 진입할 것으로 예상되고 있다.1) 따라서 노인인구가 사회에 미치는 영향도 증가하고 있으며 노인들의 노쇠화가 심할수록 국가가 부담하는 의료비용은 증 가할 것이다. 이에 한국에서 노인들의 질병을 미리 예측하고 예방하 는 것은 전 국민의 건강과 의료비용 관리 측면에서도 매우 중요하다.2)
보행은 일상적으로 정상생활을 하기 위한 근본적인 요소이며,3-6) 보행은 나이, 성별, 건강상태 등 어떠한 요인과도 관계없이 중요하
다.7-10) 보행을 평가하는 방법 중 보행속도의 측정이 있는데, 이는 임
상적으로나 역학적 연구 방법에서 널리 사용되는 방법이다.8-10) 노인 의 보행속도 감소는 입원, 낙상, 보호시설 입소, 움직임의 장애, 사망 과 같은 유해한 건강결과와 크게 연관되어 있다.8-10) 노인에게 있어서 보행속도는 생존율과 밀접한 관련이 있으며, 노인의 보행속도 감소 는 입원, 낙상, 보호시설 입소, 움직임의 장애, 사망과 같은 유해한 건 강결과와 관련이 있음이 여러 연구들을 통해 밝혀졌다.8-12) 또한 보행
Original Article
한국 지역사회 거주 노인에서 보행속도와 3년 후 사망률의 최적 변별점
홍성호
1, 원장원
1,*, 김병성
1, 최현림
1, 김선영
1, 최성은
2, 홍성훈
11경희대학교병원 가정의학과, 2동국대학교 이과대학 통계학과
The Cut-Off Point of Gait Speed as Predictor of 3 Year Mortality in Korean Community-Dwelling Elderly
Seongho Hong
1, Chang Won Won
1,*, Byung-Sung Kim
1, Hyunrim Choi
1, Sunyoung Kim
1, Sung-Eun Choi
2, Seonghun Hong
11Department of Family Medicine, Kyung Hee University Medical Center; 2Department of Statistics, College of Natural Science, Dongguk University, Seoul, Korea
Background: Gait speed has been recommended as a potentially useful clinical indicator of well-being among older adults. Gait speed is also reportedly a powerful predictor of adverse outcomes including death. The purpose of this study was to investigate the relationship between gait speed and mortality and to determine the gait speed cut-off point predictive of 3-year mortality in older adults Koreans.
Methods: Data were gathered from the 2008 and 2011 Living Profiles of Older People Surveys and included 11,889 community-dwelling elderly Koreans aged 65 years or older. Participants walked at usual gait speed for 2.5 m. The speed was measured twice to determine the peak value. To determine mortality status of each group, participants were grouped by gait speed intervals of 0.1 m/s. Receiver operating characteristic curves were constructed and many different gait speed cut-offs were tested using sensitivity and specificity analysis to predict 3-year mortality.
Results: A cut-off point for gait speed was obtained to predict 3-year mortality. Based on a 0.4 m/s gait speed, 3-year mortality of the slower group (<0.4 m/s) increased by 34.3% from 2008 to 2011 in comparison with the faster group (≥0.4 m/s). After adjusting for age and sex, slower gait speed (<0.4 m/s) was associated with an increase in mortality risk. However, this association was not significantly observed in a fully adjusted model.
Conclusion: The cut-off point of gait speed that predicts 3-year mortality in community-dwelling elderly Koreans is 0.4 m/s.
Keywords: Gait Speed; Cut-Off Point; Mortality; Aging; Aged; Korean
http://dx.doi.org/10.21215/kjfp.2016.6.3.166 pISSN 2233-9019 · eISSN 2233-9116 Korean J Fam Pract. 2016;6(3):166-171KJFP
Korean Journal of Family PracticeReceived March 22, 2016 Accepted March 31, 2016 Corresponding author Chang Won Won
Tel: +82-2-958-8700, Fax: +82-2-958-8699 E-mail: [email protected]
Copyright © 2016 The Korean Academy of Family Medicine
This is an open-access article distributed under the terms of the Creative Commons At- tribution Non-Commercial License (http://creativecommons.org/licenses/by-nc/4.0) which permits unrestricted noncommercial use, distribution, and reproduction in any medium, provided the original work is properly cited.
홍성호 외. 노인에서 사망률 예측인자로서 보행속도의 최적 변별점 Korean Journal of Family Practice
KJFP
Original Article
Korean Journal of Family Practice 속도는 노인의 건강과 신체구조적 문제를 반영한다.13) 느린 보행속도
를 통해 근골격계, 신경계, 순환계를 포함한 우리 몸의 일정 부분에 문제가 있다고 예상할 수 있고,13,14) 그 문제의 원인은 임상적인 질병 이나 노화와 관련되어 있다.15) 또한 느린 보행속도는 신체활동이 활 발하지 않다는 것을 반영하며, 사망률의 증가와도 관련이 있다.16)
이처럼 보행속도는 노인 인구에서 건강의 유용한 임상적 표지자 이고 임상에서 위험인자가 있는 자에게 질병의 발견, 예방, 치료를 시 작할지 결정하게 하는 선별 검사로서 유용성이 증명되어 왔다.16) 보 행속도 측정은 쉽고 비용이 들지 않으며, 타당하고 특별한 건강관련 법에 제한이 없으며 예민한 측정 방법이다.17,18) 보행속도를 측정한 여 러 연구에서, 느린 보행속도가 사망을 포함한 유해한 건강결과들의 독립적 위험인자이며,19,20) 1.0 m/s 미만의 보행속도가 사망의 위험을 증가시킨다고 보고한 바 있다.21)
하지만 현재까지 한국에서 65세 이상의 노인을 대상으로 사망률 과 관련된 보행속도의 변별점을 보고한 논문은 없는 실정이다. 이 연 구의 목적은 한국에 거주하는 65세 이상 노인들을 대상으로 보행속 도와 사망률과의 관계를 평가하고, 3년 후 사망률을 예측하기 위한 변별점을 구하는 것이다.
방 법
1. 연구대상
본 연구는 2008년, 2011년 시행된 대한민국 노인실태조사의 내용 을 바탕으로 하였다. 대한민국 노인실태조사는 노인정책수립에 필 요한 기초자료 및 기본지표의 생산을 목표로 대한민국에 거주하는 나이 만 60세 이상의 노인을 대상으로 3년마다 진행되는 설문조사이 다. 조사방법은 2008년 노인실태조사에 응답한 노인을 대상으로 생존 여부, 향후 거주계획을 확인하고, 교육된 설문조사자가 직접 거주지 로 방문하여 일반특성, 건강상태, 생활상태 설문조사를 실시하였다.
대상자 수는 2008년, 2011년 대한민국 노인실태조사를 실시한 15,148명 중 2008년에 나이 만 65세 미만(3,061명)과 낙상한 자(182명) 및 2011년에 사망 여부를 알 수 없는 참가자(16명)를 제외한 11,889명 이었다. 본 연구는 경희대학교병원 임상시험심사위원회에 의해 승인 되었다(IRB No. 20150348).
2. 변수설명
1) 인구사회적 특성 및 변수
연구대상자 11,889명을 사망과 비사망군으로 이분화하였다. 두 집 단의 인구사회적 특성으로는 나이, 성별, 체질량지수(body mass in- dex, BMI), 배우자 유무, 교육수준, 근무 유무, 생활지역, 수입수준, 흡
연, 음주, 운동 정도를 포함하였다. 그리고 일상생활, 보행에 영향을 줄 것으로 생각되는 변수로는 악력, instrumental Korean Activities of Daily Living scale (i-KADL) 점수, Mini-Mental State Examination (MMSE) 점수, 질병(우울증상, comorbidity 수, 요실금, 시력장애, 청력 장애, 무릎통증 유무, 골절 유무, 과거 1년 이내 낙상 경험), 수면(수면 제 복용 유무, 숙면 정도, 수면시간), 보행속도를 포함하였다.
2) 보행속도
보행속도는 2.5 m (8 ft) 거리15,22)를 도움 없이 일상생활에 걷는 방식 대로 걸었을 때 걸리는 시간을 측정하는 방식으로 두 번 시행하여 측정하였다. 대상자들은 시작지점에 두 발로 서있다가 출발하면 시 간 측정을 시작하고, 종료지점을 멈추지 않고 지나가면 측정자가 종 료지점을 지나갈 때 걸린 시간을 측정하였다. 두 번 시행하여 측정 한 시간을 2.5 m (8 ft) 거리와 함께 속도를 계산하였고, 이중 최고값 을 반영하였다.
3. 통계적 분석
사망 여부에 따라 사망과 비사망군 집단을 이분화하여 두 집단에 기본적 특성에 대하여 평가한 후, 각 특징의 변수 특성에 따라 연속 형 변수인 경우 independent t-test를, 범주형 변수인 경우 chi-square test, Fisher’s exact test를 이용하여 두 집단의 차이점을 비교하였다. 또 한 보행속도에 따라 사망률의 receiver operating characteristic (ROC) 분석을 하였다. 보행속도를 0.1 m/s로 집단을 나누어 각 집단의 사망 여부에 따라 ROC 곡선을 구하고 민감도와 특이도가 둘 다 높은 최 적 변별점(cut point)를 분석하여 각 보행속도의 민감도와 특이도를 계산하였다. 이를 바탕으로 ROC 곡선을 이용하여 사망률을 예측하 기 위한 보행속도의 예측력을 평가하였다. 단변량분석에서 유의하 게 차이를 보였던 변수들을 보정하기 위해 다중회귀분석을 이용하 였고 변수선택을 위해 Enter를 이용하였다. 통계적 분석은 PASW Statistics ver. 18.0 (IBM Co., Armonk, NY, USA)을 사용하였다. 모든 통 계 분석은 P<0.05를 통계적으로 유의한 것으로 판단하였다.
결 과
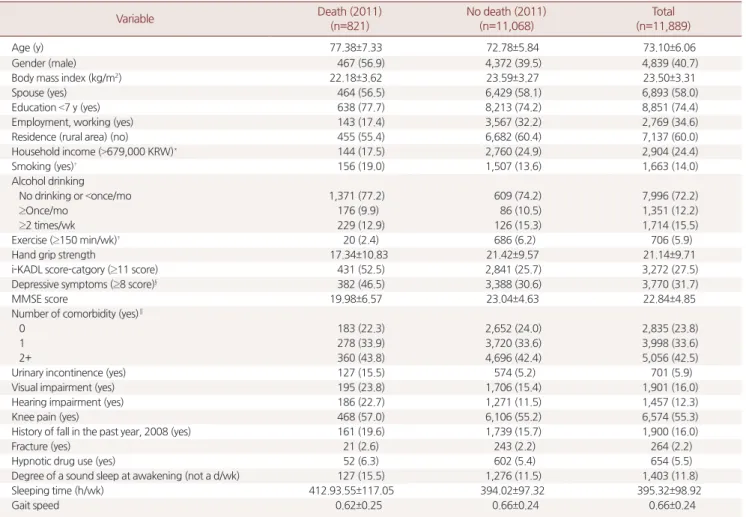
Table 1은 연구대상자의 일반적인 특징을 나타냈다. 전체 대상 11,889명 중 2011년 사망군은 821명, 비사망군은 11,068명이었다. 두 군의 평균나이는 사망군은 77.38세, 비사망군은 72.78세였다. 남자의 비율은 사망군과 비사망군 각각 56.9%, 39.5%로 확인되었다. BMI는 사망군은 22.18 kg/m2, 비사망군은 23.59 kg/m2였다. 일주일 동안 150 분 이상 운동을 하는 참가자의 비율은 사망군에서 2.4%, 비사망군
Seongho Hong, et al. Gait Speed Cut-Off Point as a Predictor of Mortality
Korean Journal of Family Practice
KJFP
에서 6.2%로 차이를 보였다. 그리고 배우자의 유무, 교육 정도, 생활 지역, 음주, comorbidity의 수, 무릎통증 유무, 골절 유무, 수면제 복 용 유무를 제외하고 모든 항목에서 통계적으로 유의하게 차이를 보 였다.
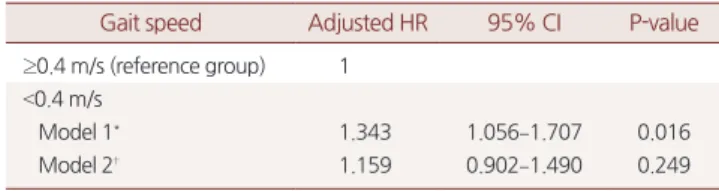
2008년에 측정한 보행속도를 0.1 m/s 단위로 분류하여 각 보행속 도에 따른 사망군과 비사망군의 수로 사망군의 수를 파악하였다. 보 행속도의 사망률을 예측하기 위한 예측력은 0.4 m/s에서 곡선 아래 면적(area under the curve)이 0.56으로 가장 높았고(Figure 1), 민감도 39.96%, 특이도 69.44%로 관찰되었다(Table 2). 최적 변별점 0.4 m/s를 기준으로 일상생활의 위험도를 확인한 결과, 연령과 성별을 보정했 을 때 hazard ratio (HR)가 1.343으로 의미 있는 결과를 보였다(Table 3). 연령과 성별에 두 집단 간 유의하게 차이를 보이는 변수들(BMI, 교육 정도, 근무환경, 거주지역, 수입수준, 흡연, 운동 정도, 악력, 일
Table 1. Baseline characteristics of subjects in 2008 (n=11,889)
Variable Death (2011)
(n=821)
No death (2011) (n=11,068)
Total (n=11,889)
Age (y) 77.38±7.33 72.78±5.84 73.10±6.06
Gender (male) 467 (56.9) 4,372 (39.5) 4,839 (40.7)
Body mass index (kg/m2) 22.18±3.62 23.59±3.27 23.50±3.31
Spouse (yes) 464 (56.5) 6,429 (58.1) 6,893 (58.0)
Education <7 y (yes) 638 (77.7) 8,213 (74.2) 8,851 (74.4)
Employment, working (yes) 143 (17.4) 3,567 (32.2) 2,769 (34.6)
Residence (rural area) (no) 455 (55.4) 6,682 (60.4) 7,137 (60.0)
Household income (>679,000 KRW)* 144 (17.5) 2,760 (24.9) 2,904 (24.4)
Smoking (yes)† 156 (19.0) 1,507 (13.6) 1,663 (14.0)
Alcohol drinking
No drinking or <once/mo 1,371 (77.2) 609 (74.2) 7,996 (72.2)
≥Once/mo 176 (9.9) 86 (10.5) 1,351 (12.2)
≥2 times/wk 229 (12.9) 126 (15.3) 1,714 (15.5)
Exercise (≥150 min/wk)‡ 20 (2.4) 686 (6.2) 706 (5.9)
Hand grip strength 17.34±10.83 21.42±9.57 21.14±9.71
i-KADL score-catgory (≥11 score) 431 (52.5) 2,841 (25.7) 3,272 (27.5)
Depressive symptoms (≥8 score)§ 382 (46.5) 3,388 (30.6) 3,770 (31.7)
MMSE score 19.98±6.57 23.04±4.63 22.84±4.85
Number of comorbidity (yes)∥
0 183 (22.3) 2,652 (24.0) 2,835 (23.8)
1 278 (33.9) 3,720 (33.6) 3,998 (33.6)
2+ 360 (43.8) 4,696 (42.4) 5,056 (42.5)
Urinary incontinence (yes) 127 (15.5) 574 (5.2) 701 (5.9)
Visual impairment (yes) 195 (23.8) 1,706 (15.4) 1,901 (16.0)
Hearing impairment (yes) 186 (22.7) 1,271 (11.5) 1,457 (12.3)
Knee pain (yes) 468 (57.0) 6,106 (55.2) 6,574 (55.3)
History of fall in the past year, 2008 (yes) 161 (19.6) 1,739 (15.7) 1,900 (16.0)
Fracture (yes) 21 (2.6) 243 (2.2) 264 (2.2)
Hypnotic drug use (yes) 52 (6.3) 602 (5.4) 654 (5.5)
Degree of a sound sleep at awakening (not a d/wk) 127 (15.5) 1,276 (11.5) 1,403 (11.8)
Sleeping time (h/wk) 412.93.55±117.05 394.02±97.32 395.32±98.92
Gait speed 0.62±0.25 0.66±0.24 0.66±0.24
Values are presented as mean±standard deviation or number (%). The results of all χ2 tests and analysis of variance were significant (P<0.05), except for that of spouse (P=0.379), alcohol drinking (P=0.317), number of comorbidity (P=0.529), knee pain (P=0.307), fracture (P=0.919) and hypnotic drug use (P=0.278).
KRW, Korean Won; i-KADL, instrumental Korean Activities of Daily Living scale; MMSE, Mini-Mental State Examination.
*Equivalent upper three quartile of total monthly household income. †Current smoker. ‡150 minutes per week or more. §Depressive symptoms: short form of Geriatric Depression Scale. ∥Number of comorbid conditions is 2 or over (hypertension, stroke, hyperlipidemia, coronary heart disease, diabetes mellitus, arthritis, osteoporosis, back pain, fracture, pulmonary emphysema or chronic bronchitis, thyroid disease, liver disease, chronic renal failure, and cancer).
0 20 40 60 80 100
80
60
40
20
Sensitivity
100-Specificity 0
100
Figure 1. Receiver operating characteristic curve of gait speed and area under curve predicting 3 year mortality.
홍성호 외. 노인에서 사망률 예측인자로서 보행속도의 최적 변별점 Korean Journal of Family Practice
KJFP
상생활기능 정도, 우울증상 정도, 인지기능 장애, 요실금, 시력 및 청 력 장애, 과거 1년 이내 낙상 경험, 숙면 정도, 수면시간)을 모두 보정 했을 때 HR은 1.159로 의미 있는 결과가 나오지 않았다(Table 3).
고 찰
노년인구가 증가함에 따라 입원, 낙상, 보호시설 입소, 움직임의 장애, 사망과 같은 노쇠와 연관된 의학적 문제들을 예측하기 위한 선별검사 개발에 대한 중요성이 강조되고 있다. 그 중 널리 시행되는 있는 노인 포괄평가(comprehensive geriatric assessment)는 시간 및 비 용의 소모가 큰 단점으로 외래에서 간단히 시행하는 데에는 어려움 이 있었다. 최근 들어 보행속도는 노인에게 일어날 수 있는 여러 문제 들을 예측하는 데 쓰이는 간단하며, 비용이 적게 들고, 믿을만한 선 별 표지자로 증명되어 왔으며,23) 따라서 유해한 결과들과 연관된 보 행속도의 변별점을 구하는 것이 보다 중요해지고 있다.24,25)
한국 지역사회 거주 노인을 대상으로 보행속도와 3년 후 사망률 예측을 위한 보행속도의 변별점을 구하고자 한 본 연구에서 대상자 의 전체 평균 보행속도는 0.66 m/s로 조사되었다. 이는 유럽인을 대상 으로 한 Toots 등16)의 결과인 0.58 m/s, 대만 노인을 대상으로 한 Li- ang 등21)의 0.75 m/s, 서양인을 대상으로 한 Perera 등26)에서 제시한 0.89–1.12 m/s와는 다소 차이를 보여주는 결과이다. 이처럼 각 연구 별로 평균 보행속도의 차이를 보이는 원인은 연구대상자들의 선정 이 제각각 다르기 때문일 것이다.
지금까지 유럽, 북미 및 남미를 포함하는 서구 국가 노인들에 있어 서 보행속도와 사망률에 관한 상관관계들을 연구한 연구들이 많이 있어왔으며 이 연구들에 대한 체계적 고찰 또한 이루어져 왔
다.8,11,12,13,16) 보행속도와 사망률 및 유해한 결과들과 관계가 있다고 여
기는 보행속도의 기준은 National Health and Nutrition Examination Survey (NHANES)를 대상으로 한 사망률을 예측할 수 있는 보행속 도의 최적 변별점은 4 m를 기준으로 측정 시 0.8 m/s임을 확인할 수 있었다.25) 본 연구 결과 중 대한민국 노인의 평균 보행속도가 다른 인 종 및 서양인들과 비교하였을 때 다른 점을 통해 대한민국 노인의 보 행속도에 대한 새로운 기준이 필요함을 짐작할 수 있다.
본 연구에서 3년 후 사망률을 예측하기 위한 보행속도의 최적 변
별점을 구한 결과, 0.4 m/s의 보행속도를 기준으로 더 빨리 걷는 그룹 (≥0.4 m/s)과 비교하였을 때 느린 그룹(<0.4 m/s)은 2008년에서 2011년 까지 3년 동안의 사망률이 약 34.3% 증가하였다. 이러한 결과는 연령 과 성별 보정 시 유의한 값을 보였으나, 다른 변수를 추가했을 때 유 의성이 소실되었으며, 이러한 결과는 보행속도로 사망률을 예측할 때, 추가된 변수가 더 중요하게 되어 의미 있는 결과가 나타나지 않을 수 있다. 또한 사망률과 보행속도와의 관계에서 상관없는 변수로 작 용할 가능성이 있음을 보여준다.
본 연구는 몇 가지 제한점을 가지고 있다. 첫째, 보행속도 측정에 서 대부분의 이전 연구들에서는 보편적으로 4 m를 기준으로 가속 단계를 포함하지 않고 측정한 반면,27) 본 연구는 2.5 m를 기준으로 출발점부터 보행속도를 측정하여 가속되는 단계를 포함하여 측정 하였다. 따라서 가속단계를 포함하지 않고 4 m를 기준으로 측정하 였을 때보다 더 느리게 측정될 가능성이 있고, 이전 연구들과 비교 분석하기에 제한점이 있을 수 있다. 그러나 이전 연구에서 2.5 m (8 ft) 보행속도를 4 m 보행속도로 변환할 수 있는 공식은다음과 같다.22,28)
2.5 m 보행속도 ≤1.0 m/s일 때, 4-m gait speed=0.01+(2.5 m gait speed)(1.052)
2.5 m 보행속도 >1.0 m/s일 때, 4-m gait speed=0.481+(2.5 m gait speed)(0.581)
본 연구에서 대상자들의 평균 보행속도를 위의 공식으로 변환해 보면 0.7 m/s로 확인되어 큰 차이를 보이지 않음을 알 수 있었고, 또 아직까지 보행속도 측정방법에 대한 국제적 합의는 없는 상태이
다.22,28) 이전 연구들에서 대상자들이 노인임을 가정할 때 집에서의
생활이 주 생활 영역이고 집이라는 제한된 공간에서의 생활이기 때 문에 보행속도 측정거리를 2.5 m로 측정하는 것이 더 의미 있다고 판 단한 연구도 있다.16,27,29)
둘째, 노인실태조사의 대부분이 설문조사로 이루어져 사망 정보 를 정확한 의료기록이나 사망자료가 아닌 보호자의 진술에 의존하 Table 2. Gait speed cut-off point to predict 3 year mortality and sensi-
tivity and specificity of cut-off point
Gait speed cut-off point 0.4 m/s
Sensitivity 39.96 (35.50–44.50)
Specificity 69.44 (68.40–70.40)
Values are presented as percentage (95% confidence interval).
Table 3. HR (95% CI) for associations between gait speed cut-off point and 3 year mortality
Gait speed Adjusted HR 95% CI P-value
≥0.4 m/s (reference group) 1
<0.4 m/s
Model 1* 1.343 1.056–1.707 0.016
Model 2† 1.159 0.902–1.490 0.249
HR, hazard ratio; CI, confidence interval.
*Adjustment of age and gender. †Adjustment of age, gender, body mass index (kg/m2), education, employment, residence, household income, smoking, hand grip, instrumental Korean Activities of Daily Living scale, Mini-Mental State Ex- amination, depression, incontinence, history of fall in the past year (2008), visual impairment, hearing impairment, sleep characteristics, gait speed.
Seongho Hong, et al. Gait Speed Cut-Off Point as a Predictor of Mortality
Korean Journal of Family Practice
KJFP
여 조사하였기 때문에 연구결과의 정확성을 떨어뜨리는 요소가 될 수 있다. 그러나 연구대상자의 사망 여부에 대한 정보는 보호자가 답 변을 하더라도 비뚤림이 거의 없는 변수이기 때문에 문제가 되지 않 는다. 그리고 운동 정도, 음주, 담배 등 일부 변수들 역시 대상자들의 생각에 의해 답해지므로 이로 인한 비뚤림이 발생했을 가능성이 있 을 수 있다. 하지만 전문적으로 교육된 조사원이 직접 방문하여 시 행하였기 때문에 이러한 비뚤림은 최소화되었을 것이다. 셋째, 지역 사회 거주 노인을 대상으로 한정하였기 때문에 요양병원이나 요양 원, 그리고 병원 입원자들을 포함시키지 않았다는 제한점이 있다. 그 럼에도 불구하고 본 연구는 전국의 노인을 대표하는 지역사회 거주 노인을 대상으로 시행한 대규모 종단적(longitudinal) 연구라는 점과, 기존의 다른 연구들에서 분석하지 않았던 변수들을 보정하여 통계 분석을 진행하였다는 강점이 있다. 그리고 한국에 거주하는 노인에 대해 보행속도와 사망률과의 관련성 및 사망률 예측을 위한 최적 변 별점을 구한 논문으로 의미가 있으며 아시아에 거주하는 노인들에 게서 보행속도가 사망률의 예측인자로 사용할 수 있음에 도움이 될 것으로 기대한다.
요 약
연구배경:
보행속도는 노인의 건강 지표로 사용되어 왔으며, 사망을 포함한 유해한 건강결과들의 독립적 위험인자이다. 본 연구의 목적 은 한국에 거주하는 65세 이상 노인들을 대상으로 보행속도와 사망 률과의 관계를 평가하고, 3년 후 사망률을 예측하기 위한 변별점을 구하는 것이다.방법:
2008년, 2011년 시행된 대한민국 노인실태조사를 바탕으로 한 국 지역사회에 거주하는 65세 이상 노인 11,889명을 대상으로 시행 하였다. 2.5 m를 평상시 보행속도로 걷고 이를 두 번 측정하여 그 중 최고값을 반영하였다. 보행속도를 0.1 m/s로 집단을 나누어 각 집단 의 사망 여부에 따라 receiver operating characteristic (ROC) 곡선을 구 하고 민감도와 특이도가 둘 다 높은 최적 변별점(cut point)을 분석하 였다. 이를 바탕으로 ROC 곡선을 이용하여 3년 후 사망률을 예측하 기 위한 보행속도의 변별점을 평가하였다.결과:
3년 후 사망률을 예측하기 위한 보행속도의 최적 변별점을 구 한 결과, 0.4 m/s의 보행속도를 기준으로 더 빨리 걷는 그룹(≥0.4 m/s) 과 비교하였을 때, 느린 그룹(<0.4 m/s)은 2008년에서 2011년까지 3년 동안의 사망률이 약 34.3% 증가하였다. 이러한 결과는 연령과 성별 보정 시 유의한 값을 보였으나, 다른 변수를 추가했을 때 의미 있는 결과를 보이지 않았다.결론:
한국 지역사회 거주 노인에서 보행속도와 3년 후 사망률의 최 적 변별점은 0.4 m/s인 것으로 확인하였다.중심단어:
보행속도; 변별점; 사망률; 노령화; 노인; 한국REFERENCES
1. Korean Statistical Information Service [Internet]. Daejeon: KOSIS; 2011 [cited 2011 Dec 7]. Available from: http://kosis.kr.
2. Son JH, Kim SY, Won CW, Choi HR, Kim BS, Park MS. Physical frailty pre- dicts medical expenses in community-dwelling, elderly patients: three-year prospective findings from living profiles of older people surveys in Korea.
Eur Geriatr Med 2015; 6: 412-6.
3. Graham JE, Ostir GV, Fisher SR, Ottenbacher KJ. Assessing walking speed in clinical research: a systematic review. J Eval Clin Pract 2008; 14: 552-62.
4. Kaufman KR, Hughes C, Morrey BF, Morrey M, An KN. Gait characteristics of patients with knee osteoarthritis. J Biomech 2001; 34: 907-15.
5. Pirpiris M, Wilkinson AJ, Rodda J, Nguyen TC, Baker RJ, Nattrass GR, et al.
Walking speed in children and young adults with neuromuscular disease:
comparison between two assessment methods. J Pediatr Orthop 2003; 23:
302-7.
6. Wang AW, Gilbey HJ, Ackland TR. Perioperative exercise programs improve early return of ambulatory function after total hip arthroplasty: a random- ized, controlled trial. Am J Phys Med Rehabil 2002; 81: 801-6.
7. Baer G, Smith M. The recovery of walking ability and subclassification of stroke. Physiother Res Int 2001; 6: 135-44.
8. Cesari M, Kritchevsky SB, Penninx BW, Nicklas BJ, Simonsick EM, Newman AB, et al. Prognostic value of usual gait speed in well-functioning older peo- ple–results from the health, aging and body composition study. J Am Geri- atr Soc 2005; 53: 1675-80.
9. de Rekeneire N, Visser M, Peila R, Nevitt MC, Cauley JA, Tylavsky FA, et al.
Is a fall just a fall: correlates of falling in healthy older persons. The health, aging and body composition study. J Am Geriatr Soc 2003; 51: 841-6.
10. Kressig RW, Wolf SL, Sattin RW, O’Grady M, Greenspan A, Curns A, et al.
Associations of demographic, functional, and behavioral characteristics with activity-related fear of falling among older adults transitioning to frail- ty. J Am Geriatr Soc 2001; 49: 1456-62.
11. Cesari M, Kritchevsky SB, Newman AB, Simonsick EM, Harris TB, Penninx BW, et al; Health, Aging and Body Composition Study. Added value of physical performance measures in predicting adverse health-related events:
results from the health, aging and body composition study. J Am Geriatr Soc 2009; 57: 251-9.
12. Woo J, Ho SC, Yu AL. Walking speed and stride length predicts 36 months dependency, mortality, and institutionalization in Chinese aged 70 and old- er. J Am Geriatr Soc 1999; 47: 1257-60.
13. Abellan van Kan G, Rolland Y, Andrieu S, Bauer J, Beauchet O, Bonnefoy M, et al. Gait speed at usual pace as a predictor of adverse outcomes in commu- nity-dwelling older people an International Academy on Nutrition and Ag- ing (IANA) Task Force. J Nutr Health Aging 2009; 13: 881-9.
14. Studenski S, Perera S, Patel K, Rosano C, Faulkner K, Inzitari M, et al. Gait speed and survival in older adults. JAMA 2011; 305: 50-8.
홍성호 외. 노인에서 사망률 예측인자로서 보행속도의 최적 변별점 Korean Journal of Family Practice
KJFP
15. Studenski S. Bradypedia: is gait speed ready for clinical use? J Nutr Health Aging 2009; 13: 878-80.
16. Toots A, Rosendahl E, Lundin-Olsson L, Nordström P, Gustafson Y, Litt- brand H. Usual gait speed independently predicts mortality in very old peo- ple: a population-based study. J Am Med Dir Assoc 2013; 14: 529.e1-6.
17. Arnadottir SA, Mercer VS. Effects of footwear on measurements of balance and gait in women between the ages of 65 and 93 years. Phys Ther 2000; 80:
17-27.
18. Tyson SF, DeSouza LH. Reliability and validity of functional balance tests post stroke. Clin Rehabil 2004; 18: 916-23.
19. Abellan van Kan G, Rolland Y, Houles M, Gillette-Guyonnet S, Soto M, Vel- las B. The assessment of frailty in older adults. Clin Geriatr Med 2010; 26:
275-86.
20. Cruz-Jentoft AJ, Baeyens JP, Bauer JM, Boirie Y, Cederholm T, Landi F, et al;
European Working Group on Sarcopenia in Older People. Sarcopenia: Eu- ropean consensus on definition and diagnosis: report of the European working group on sarcopenia in older people. Age Ageing 2010; 39: 412-23.
21. Liang CK, Chou MY, Peng LN, Liao MC, Chu CL, Lin YT, et al. Gait speed and risk assessment for falls among men aged 80 years and older: a prospec- tive cohort study in Taiwan. Eur Geriatr Med 2014; 5: 298-302.
22. Guralnik JM, Ferrucci L, Pieper CF, Leveille SG, Markides KS, Ostir GV, et al. Lower extremity function and subsequent disability: consistency across studies, predictive models, and value of gait speed alone compared with the
short physical performance battery. J Gerontol A Biol Sci Med Sci 2000; 55:
M221-31.
23. Cesari M, Onder G, Zamboni V, Manini T, Shorr RI, Russo A, et al. Physical function and self-rated health status as predictors of mortality: results from longitudinal analysis in the ilSIRENTE study. BMC Geriatr 2008; 8: 34.
24. Taekema DG, Gussekloo J, Westendorp RG, de Craen AJ, Maier AB. Predict- ing survival in oldest old people. Am J Med 2012; 125: 1188-1194.e1.
25. Cheung CL, Lam KS, Cheung BM. Evaluation of cutpoints for low lean mass and slow gait speed in predicting death in the national health and nu- trition examination survey 1999-2004. J Gerontol A Biol Sci Med Sci 2016;
71: 90-5.
26. Perera S, Patel KV, Rosano C, Rubin SM, Satterfield S, Harris T, et al. Gait speed predicts incident disability: a pooled analysis. J Gerontol A Biol Sci Med Sci 2016; 71: 63-71.
27. Bohannon RW. Comfortable and maximum walking speed of adults aged 20-79 years: reference values and determinants. Age Ageing 1997; 26: 15-9.
28. Fried LP, Borhani NO, Enright P, Furberg CD, Gardin JM, Kronmal RA, et al. The Cardiovascular health study: design and rationale. Ann Epidemiol 1991; 1: 263-76.
29. Guralnik JM, Ferrucci L, Simonsick EM, Salive ME, Wallace RB. Lower-ex- tremity function in persons over the age of 70 years as a predictor of subse- quent disability. N Engl J Med 1995; 332: 556-61.