서 론
비만은 전세계적으로 문제가 되고 있으며, 세계보건기구(
World Health Organization
,WHO
)에서2017
년에 비만의 심각성에 대해 발 표하였다. 그리고 비만 인구 또한1975
년에 비해2016
년에19
억 명, 과체중인구 또한6
억5
천만 명 이상이 될 정도로 거의3
배 정도 증가하였다.1,2) 지난 수십 년간 한국은 빠른 사회경제학적 성장을 이루 면서, 생활 습관이 변하였으며 그 결과로 비만 및 제
2
형 당뇨병의 증가 및 심혈관계 질환 등 만성질환이 증가하였다.3) 전문가들은 이 러한 만성질환 증가의 주요 원인으로 대사증후군이 있음을 확인하 였으며, 우리나라에서 대사증후군은 지난 수십 년 동안 빠르게 증 가하였고 이러한 대사증후군을 예방하는 것은 만성질환 관리에 중Received July 5, 2019 Revised February 28, 2020 Accepted May 21, 2020
Corresponding author Kyung Won Shim Tel: +82-2-6986-3090, Fax: +82-2-6986-3096 E-mail: [email protected]
ORCID: http://orcid.org/0000-0001-8289-9301
Copyright © 2020 The Korean Academy of Family Medicine
This is an open-access article distributed under the terms of the Creative Commons At- tribution Non-Commercial License (http://creativecommons.org/licenses/by-nc/4.0) which permits unrestricted noncommercial use, distribution, and reproduction in any medium, provided the original work is properly cited.
Original Article
https://doi.org/10.21215/kjfp.2020.10.4.284 eISSN 2233-9116
Korean J Fam Pract. 2020;10(4):284-291
Korean Journal of Family Practice
KJFP
한국 성인 남녀에서 주관적 체형 인식과 대사증후군과의 연관성:
2015–2016년 국민건강영양조사 자료 이용
김리연
1, 심경원
2,*, 이홍수
1, 이상화
1, 최지윤
11이화여자대학교 의과대학 이대목동병원 가정의학과, 2이화여자대학교 의과대학 이대서울병원 가정의학과
Association between Body Weight Perception and Metabolic Syndrome in Korean Adults: The Korea National Health and Nutrition Examination Survey 2015–2016
Lee Yeon Kim1, Kyung Won Shim2,*, Hong Soo Lee1, Sang Wha Lee1, Ji Yoon Choi1
1Department of Family Medicine, Ewha Womans University Mokdong Hospital, Ewha Womans University School of Medicine; 2Department of Family Medicine, Ewha Womans University Seoul Hospital, Ewha Womans University School of Medicine, Seoul, Korea
Background: Obesity has become a concern globally. The incidence of metabolic syndrome has increased rapidly in Korea over the past decades.
Previous studies have reported obesity as a major cause of metabolic syndrome. Body mass index (BMI) and body weight perception have been widely used as indirect predictors of the risk of metabolic syndrome. Therefore, we aimed to evaluate subjective body weight perception and the risk of metabolic syndrome in adults over 20 years of age and confirm the gap between body weight perception and the objective measure of BMI.
Methods: This study was conducted aming 9,842 Korean adults over 20 years of age using data from the VI-3 (2015) and VII-1 (2016) Korea National Health and Nutrition Survey. The BMI criteria were set according to the WHO Asia Pacific Standard criteria. Perceived body weight status was measured according to the question, “How would you describe your body shape?”. The patients were grouped as “obese,” “slightly obese,” “right weight,” and “under weight” according to the original responses (“very obese,” “slightly obese,” “normal,” “slightly thin,” and “very thin”). Data analysis was performed using chi-square test, analysis of variance, and logistic regression.
Results: Among the participants, the risk of metabolic syndrome was progressively higher with the body weight perception as obese. Additionally, the risk of metabolic syndrome was higher in those with a higher BMI than in those with subjective body weight perception.
Conclusion: In this Korean population, increased risk of metabolic syndrome showed higher associated with higher BMI than with body weight perception.
Keywords: Body Mass Index; Obesity; Body Weight Perception; Metabolic Syndrome
김리연 외. 주관적 체형 인식과 대사증후군과의 연관성 Korean Journal of Family Practice
KJFP
요함을 확인하였다.4-6)
체중에 대한 인식은 심리적, 행동적, 생물학적 결과와 관련이 있 다. 정상적인 체중을 가진 개인에서, 정확한 체중 인식은 지속적으 로 건강에 유익한 결과를 보여주지만, 과체중이나 비만인 경우에는 정확한 체중 인식이 되지 않는 경우가 많다.7,8) 많은 선행연구에서 비 만이 대사증후군의 주요 원인임이 밝혀졌으며, 체질량지수(
body mass index
,BMI
)를 대사증후군의 위험도를 평가하는 간접적인 예 측인자로 널리 이용했다. 그러나 이 지표는 인종적 차이나 생활 양 식 요소에 따라 다를 수 있어 이를 보완할 수 있는 추가 예측 변수 로 체중에 대한 인식을 사용하였다.9-11)대사증후군과 비만의 상관관계는 이전 선행 연구에서 연구된 바 있으나, 개인의 체형 인식과 대사증후군 발병 관계는 연구된 내용이 적으며, 주로 체형 인식에 대한 연구는 성인이 아닌 청소년에 국한되 어 연구된 내용이 많아 성인으로 일반화하기에는 어려움이 있었다.
그리고 개인의 잘못된 체형 인식을 반영하는 개인의 체형 인식 정도 와 비만을 측정하는 대표적인 수치인
BMI
와의 관계에 대해 연관성 을 연구한 내용은 있으나 이를 질병의 발병에 대해 대입한 내용은 많지 않았다.이번 연구의 목적은
20
세 이상의 성인을 대상으로 개인의 주관적 체형 인식 정도와 대사증후군의 위험도를 평가하고, 나아가서BMI
라는 객관적인 척도를 이용하여 주관적 체형 인식과의 간극을 확인 하여 대사증후군의 위험도의 변화를 확인하는 것이다.방 법
1. 연구 대상
국민건강영양조사(
Korea National Health and Nutrition Examination Survey
,KNHANES
) 제6
기3
차 년도, 제7
기1
차년도 자료를 가중치 비율1
:1
로 통합하여 사용하였다.2015–2016
년 총2
개년도의 검진조 사, 건강설문조사를 모두 참여한 인원 중 만20
세 이상 인구를 대상 으로 하였고, 분석 변수 중 결측 데이터가 있는 자를 제외한9
,842
명 을 대상으로 하였다.2. 연구 방법
1) 인구사회학적 변수 측정
건강 설문조사를 통해 얻은 인구통계자료, 흡연, 음주, 병력 등의 자료를 이용하였고, 검진조사를 통해 얻어진 신장, 체중, 신체질량 지수, 허리둘레와 수축기 혈압, 이완기 혈압, 총콜레스테롤, 중성지 방, 고밀도 지단백콜레스테롤(
high-density lipoprotein cholesterol
,HDL-C
), 저밀도 지단백콜레스테롤, 공복혈당을 연구에 사용하였다. 혈액검사는
12
시간 공복상태에서 혈청을 채혈하였고Hitachi Automatic Analyzer 7600
(Hitachi
,Tokyo
,Japan
) 기구를 이용하였고 사용된 시약은Pureauto S GLU
(Sekisui
,Osaka
,Japan
)와Cholesterol N high-density lipoprotein
(Sekisui
),Cholesterol N low-density lipoprotein
(Sekisui
)였다.2) 체질량지수 측정 및 주관적 체형 인식 분류 기준
BMI
는 측정한 체중(kg
)을 신장(m
)의 제곱으로 나눈 값(kg
/m
2)으 로 산출하였다. 그리고 이 값을 세계보건기구 아시아태평양 지역 기 준과 대한비만학회 비만 기준12,13)에 따라underweight
(저체중,BMI
<18
.5 kg
/m
2),right weight
(정상 체중,BMI 18
.5–22
.9 kg
/m
2),slightly obese
(과체중,BMI 23
.0–24
.9 kg
/m
2),obese
(비만,BMI ≥25
.0 kg
/m
2) 으로 나누어 층화하였다.주관적 체형 인식은 국민건강영양조사에서 분류한 매우 마른편, 약간 마른편을 마른편으로 간주하였고, 보통, 약간 비만, 매우 비만 으로 나누어 분석하였다.
3) 대사증후군의 진단 기준
본 연구에서는 수정된
NCEP-ATP III
14)에서 제시하고 있는 대사증 후군의 진단 기준을 기본으로 하여 복부 비만, 공복혈당장애, 고중 성지방혈증, 저HDL
콜레스테롤혈증, 고혈압 중3
가지 이상 만족하 는 경우로 정의하였다. 구체적인 기준은 다음과 같다.(
1
) 허리 둘레: 남자≥90 cm
, 여자≥85 cm
(2
) 고혈압: 혈압≥130
/85 mmHg
또는 약물치료 중 (3
) 고중성지방혈증:TG ≥150 mg
/dL
또는 약물치료 중 (4
) 공복혈당장애: 공복 혈당≥100 mg
/dL
또는 약물치료 중 (5
) 저HDL
콜레스테롤혈증:HDL-C
남자<40 mg
/dL
, 여자<50 mg
/dL
또는 약물치료 중4) 분석 방법 및 통계 처리
대상자 특성을 확인하기 위해 대사증후군에 따른 범주형 변수의 빈도와 가중 백분율을 제시하고
Rao–Scott
보정을 적용한 카이제곱 검정(chi-square test
)을 실시하였으며, 연속형 변수의 평균과 표준오 차를 제시하고 분산분석(ANOVA
)을 실시하였다. 주관적 체형 인식 과BMI
분류 간 교차 빈도와 가중 백분율을 확인하고Rao–Scott
보 정을 적용한 카이제곱 검정(chi-square test
)을 실시하였다. 주관적 체 형 인식과 대사증후군 간 연관성을 확인하기 위해 로지스틱 회귀분 석(logistic regression
)을 실시하고, 상대 위험도로서 오즈비(odds ratio
,OR
) 및95
% 신뢰구간(confidence interval
,CI
)을 산출하였다. 대상자 특성 변수를 보정하였다. 모든 분석은IBM SPSS Statistics ver
.23
.0
Original Article
Korean Journal of Family Practice
Lee Yeon Kim, et al. Body Weight Perception and Metabolic Syndrome in Korean Adults
Korean Journal of Family Practice
KJFP
Table 1. Characteristics of study population
Variable Metabolic syndrome
Total P-value
Yes No
Total 3,255 (29.0) 6,587 (71.0) 9,842 (100.0)
Age (y) 55.23±0.37 43.20±0.27 46.70±0.28 <0.001
Sex <0.001
Male 1,569 (56.1) 2,694 (46.9) 4,263 (49.6)
Female 1,686 (43.9) 3,893 (53.1) 5,579 (50.4)
Marital status <0.001
Married 3,055 (90.1) 5,309 (72.9) 8,364 (77.9)
Unmarried 200 (9.9) 1,278 (27.1) 1,478 (22.1)
Household income <0.001
1st quantile 898 (23.4) 895 (11.5) 1,793 (15.0)
2nd quantile 869 (25.1) 1,537 (22.0) 2,406 (22.9)
3rd quantile 757 (25.4) 1,988 (32.1) 2,745 (30.2)
4th quantile 731 (26.1) 2,167 (34.3) 2,898 (31.9)
Education <0.001
≤Elementary school 1,150 (27.7) 957 (9.8) 2,107 (15.0)
Middle school 438 (12.4) 612 (7.7) 1,050 (9.0)
High school 897 (30.8) 2,283 (38.2) 3,180 (36.0)
Above college 770 (29.2) 2,735 (44.4) 3,505 (40.0)
Job <0.001
Yes 1,798 (61.4) 4,140 (65.7) 5,938 (64.5)
No 1,457 (38.6) 2,447 (34.3) 3,904 (35.5)
Smoking <0.001
Current 642 (24.9) 1,088 (20.0) 1,730 (21.4)
Former 820 (26.3) 1,333 (20.1) 2,153 (21.9)
No 1,793 (48.7) 4,166 (59.9) 5,959 (56.7)
Drinking <0.001
No 1,121 (29.6) 1,617 (20.5) 2,738 (23.1)
<1/mo 506 (14.3) 1,279 (19.0) 1,785 (17.6)
1/mo 275 (8.6) 716 (11.6) 991 (10.7)
2–4/mo 576 (19.4) 1,636 (27.6) 2,212 (25.2)
2–3/wk 490 (18.0) 949 (15.4) 1,439 (16.2)
≥4/wk 287 (10.0) 390 (5.9) 677 (7.1)
Exercise <0.001
Yes 263 (8.8) 702 (11.8) 965 (10.9)
No 2,992 (91.2) 5,885 (88.2) 8,877 (89.1)
Body mass index (kg/m2) <0.001
Underweight (<18.5) 14 (0.4) 353 (5.8) 367 (4.2)
Right weight (18.5–22.9) 481 (13.2) 3,229 (48.1) 3,710 (37.9)
Slightly obese (23.0–24.9) 695 (20.0) 1,637 (24.6) 2,332 (23.3)
Obese (≥25.0) 2,065 (66.4) 1,368 (21.5) 3,433 (34.6)
Body weight perception <0.001
Underweight 261 (6.9) 1,269 (19.2) 1,530 (15.7)
Right weight 969 (27.2) 3,024 (45.3) 3,993 (40.1)
Slightly obese 1,473 (48.0) 1,966 (30.2) 3,439 (35.4)
Obese 552 (17.9) 328 (5.2) 880 (8.9)
Body weight misperception <0.001
Under-estimation 2,128 (65.4) 2,862 (43.6) 4,990 (49.9)
Right-estimation 1,068 (32.9) 3,219 (48.8) 4,287 (44.2)
Over-estimation 59 (1.6) 506 (7.6) 565 (5.9)
Hypertension <0.001
Yes 2,554 (75.6) 1,574 (20.9) 4,128 (36.8)
No 701 (24.4) 5,013 (79.1) 5,714 (63.2)
김리연 외. 주관적 체형 인식과 대사증후군과의 연관성 Korean Journal of Family Practice
KJFP
(
IBM Corp
.,Armonk
,NY
,USA
)을 사용하였고 유의확률0
.05
를 기 준으로 통계적 유의성을 판단하였다.결 과
1. 연구 대상자의 일반적 특성
Table 1
은 연구 대상자의 기본적 특성을 나타내었다. 총9
,842
명을 대상으로 하였으며, 대사증후군의 경우3
,255
명(29
.0
%)이었고, 정상 의 경우6
,587
명(71
.0
%)으로 분류되었다.BMI
(kg
/m
2)의 차이는 대 사증후군 집단의 경우underweight
(<18
.5
)14
명,right weight
(18
.5–
22
.9
)481
명,overweight
(23
.0–24
.9
)695
명,obese
(≥25
.0
)2
,065
명으로obese
집단이 가장 높았으며, 정상군의 경우underweight
(<18
.5
)353
명,right weight
(18
.5–22
.9
)3
,229
명,overweight
(23
.0–24
.9
)1
,637
명,obese
(≥25
.0
)1
,368
명으로 정상 체중군이 가장 높았다.주관적 체형 인식의 차이는 대사증후군 집단의 경우
underweight 261
명,right weight 969
명,slightly obese 1
,473
명,obese 552
명으로slightly obese
군이 가장 높았고, 정상군의 경우underweight 1
,269
명,right weight 3
,024
명,slightly obese 1
,966
명,obese 328
명으로right
weight
군이 가장 높았다. 잘못된 체형 인식 정도에서는 대사증후군집단의 경우
under-estimation 2
,128
명,right-estimation 1
,068
명,over- estimation 59
명으로under-estimation
군이 높았고, 정상군의 경우under-estimation 2
,862
명,right-estimation 3
,219
명,over-estimation 506
명으로right-estimation
군이 높은 것으로 나타났다. 세 가지 변수는 두 군 간에 유의한 차이를 보였다. 그 외의 다른 변수들에서도 두 군 간에는 유의한 차이를 보였다(P<0
.001
).2. 전체 대상자에서 주관적 체형 인식 정도와 BMI 분류 간의 교차분석
전체 대상자를 대상으로 하여 개인의 주관적 체형 인식 정도를
BMI
에 따라 분류하였을 때, 개인이 객관적인 기준인BMI
에 비해 저 체중이라고 인식하는 경우는 전체9
,842
명 중4
,990
명으로50
.7
%에 해당하는 수치이다(P<0
.001
) (Table 2
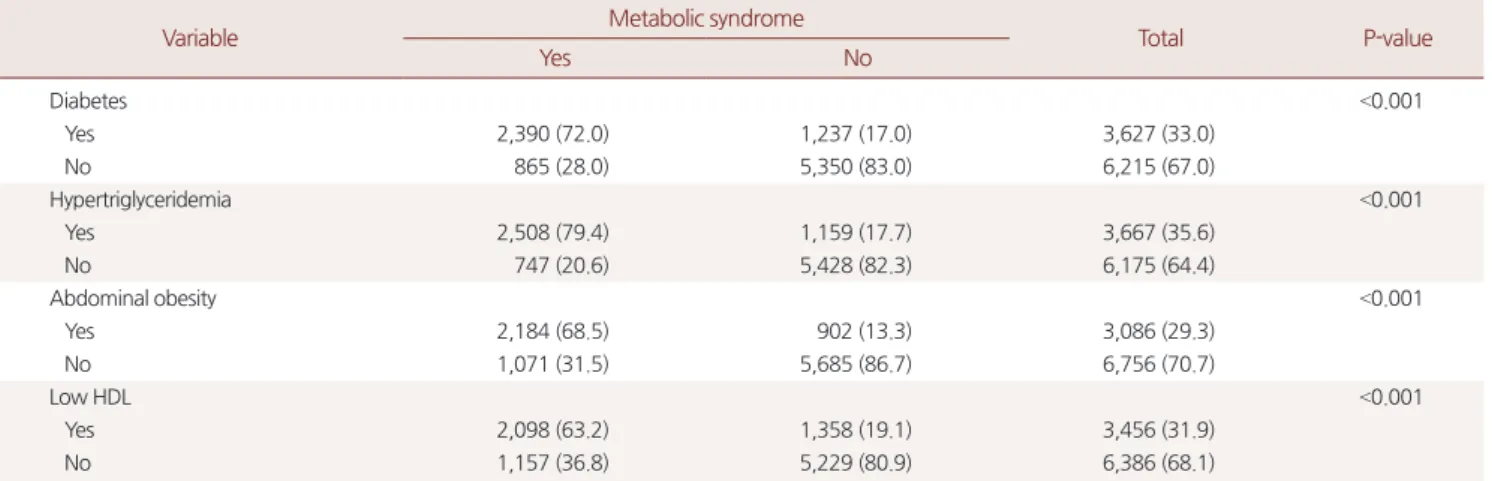
).Table 1. Continued
Variable Metabolic syndrome
Total P-value
Yes No
Diabetes <0.001
Yes 2,390 (72.0) 1,237 (17.0) 3,627 (33.0)
No 865 (28.0) 5,350 (83.0) 6,215 (67.0)
Hypertriglyceridemia <0.001
Yes 2,508 (79.4) 1,159 (17.7) 3,667 (35.6)
No 747 (20.6) 5,428 (82.3) 6,175 (64.4)
Abdominal obesity <0.001
Yes 2,184 (68.5) 902 (13.3) 3,086 (29.3)
No 1,071 (31.5) 5,685 (86.7) 6,756 (70.7)
Low HDL <0.001
Yes 2,098 (63.2) 1,358 (19.1) 3,456 (31.9)
No 1,157 (36.8) 5,229 (80.9) 6,386 (68.1)
Values are presented as unweighted number (weighted %) for categorical variable or mean±standard error for continuous variable.
HDL, high-density lipoprotein.
P values are from Rao–Scott χ2 test or ANOVA.
Table 2. Distribution of body weight perception within each BMI based weight status
Variable Body weight perception
Underweight Right weight Slightly obese Obese Total P-value
BMI <0.001
Underweight (<18.5) 311 (3.2) 53 (0.5) 2 (0.0) 1 (0.0) 367 (3.7)
Right weight (18.5–22.9) 1,043 (10.6) 2,209 (22.4) 444 (4.5) 14 (0.1) 3,710 (37.7)
Slightly obese (23.0–24.9) 136 (1.4) 1,192 (12.1) 953 (9.7) 51 (0.5) 2,332 (23.7)
Obese (≥25.0) 40 (0.4) 539 (5.5) 2,040 (20.7) 814 (8.3) 3,433 (34.9)
Total 1,530 (15.5) 3,993 (40.6) 3,439 (34.9) 880 (8.9) 9,842 (100.0)
Values are presented as unweighted number (weighted %) for categorical variable.
BMI, body mass index.
P values are from Pearson’s chi-squared test.
Lee Yeon Kim, et al. Body Weight Perception and Metabolic Syndrome in Korean Adults
Korean Journal of Family Practice
KJFP
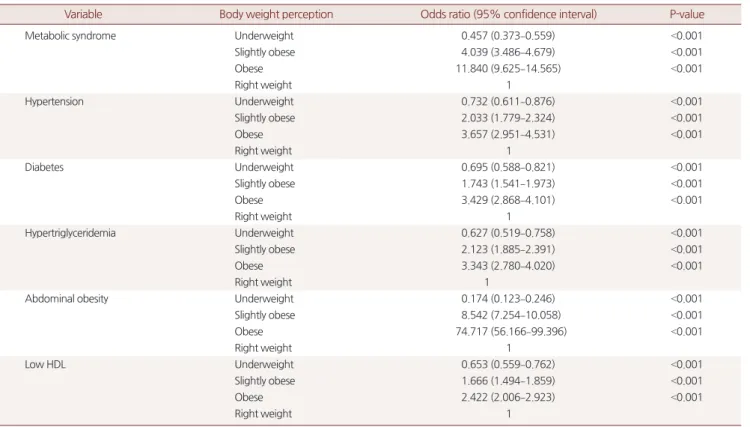
3. 주관적 체형 인식과 대사증후군의 연관성
주관적 체형 인식과 대사증후군 간 연관성을 확인하기 위해 체형 을 정상으로 인지하는 군을 비교군으로 하여 주관적 체형 인식이 과체중(
slightly obese
), 비만(obese
)으로 인지하는 군에 대한 로지스틱 회귀분석을 실시하고, 교차비 및95
% 신뢰구간을 산출하였다. 대상 자 특성에 대해age
(year
),sex
,marital status
,household income
,education
,job
,smoking
,drinking
,exercise
항목 변수를 보정하였다.정상인 군에 비해 주관적 체형 인식을 과체중(
OR
,4
.039
;95
%CI
,3
.486–4
.679
), 비만(OR
,11
.840
;95
%CI
,9
.625–14
.565
)으로 인지하는 군은 대사증후군일 위험이 유의하게 높았다. 대사증후군의 세부 영 역 변수에서도 주관적 체형 인식을 과체중, 비만으로 인지하는 군 에서 위험도가 유의하게 높게 나타났다(Table 3
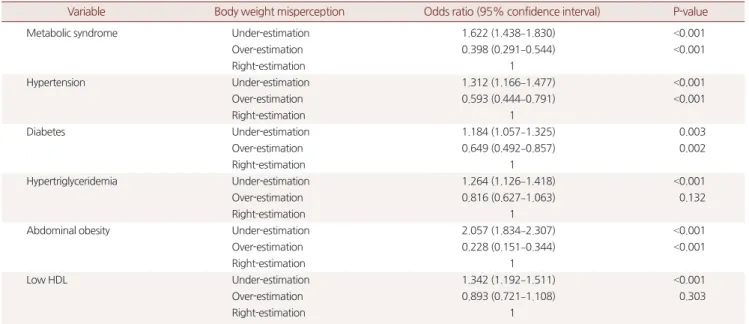
).Table 4
에서는 잘못된 주관적 체형 인식과 대사증후군 위험도와의 연관성을 확인하였으며, 주관적 체형 인식과 실제
BMI
로 확인된 값이 같은 경우를 비교군으로 하여 분석하였다. 주관적 체형 인식 에서 개인이 객관적인BMI
수치보다 비만하지 않다고 인지하는 군 (under-estimation
)에서 대사증후군일 위험이 유의하게 높았다(OR
,1
.622
;95
%CI
,1
.438–1
.830
). 대사증후군의 세부 영역 변수에서도 동 일하게under-estimation
군에서 위험도가 유의하게 높게 나타났다(
Table 4
).Table 5
에서는 잘못된 주관적 체형 인식과 대사증후군 위험도를성별과 연령으로 구분하여 이에 대한 연관성을 확인하였다. 성별로 구분하였을 때 남성과 여성 모두에서
under-estimation
군에서 대사 증후군일 위험이 유의하게 높았으며, 여성군에서 더 높게 나타났다 (OR
,1
.885
;95
%CI
,1
.604–2
.216
). 연령별로 구분하여 분석하였을 때,40
대 이상에서under-estimation
군에서 대사증후군일 위험이 유 의하게 높았으며,60
세 이상에서 가장 높게 나타났다(OR
,1
.822
;95
%CI
,1
.547–2
.145
) (Table 5
).고 찰
본 연구에서는 주관적 체형 인식 지표와 비만 지표로 사용되는
BMI
수치와 대사증후군의 연관성을 알아보았다. 연구에서 주관적 으로 체형이 비만하다고 인식할수록 대사증후군 위험도가 증가하 며, 대사증후군의 세부 영역 변수인 고혈압, 고혈당, 고중성지방혈 증, 복부 비만, 저HDL
콜레스테롤혈증 위험도 또한 증가하는 것을 보여주었다. 이 지표는 유의한 상관관계가 있는 것으로 나타났다.대사증후군으로 만성질환의 위험을 예측함에 있어서,
BMI
만 사Table 3. Association between body weight perception and metabolic syndrome
Variable Body weight perception Odds ratio (95% confidence interval) P-value
Metabolic syndrome Underweight 0.457 (0.373–0.559) <0.001
Slightly obese 4.039 (3.486–4.679) <0.001
Obese 11.840 (9.625–14.565) <0.001
Right weight 1
Hypertension Underweight 0.732 (0.611–0.876) <0.001
Slightly obese 2.033 (1.779–2.324) <0.001
Obese 3.657 (2.951–4.531) <0.001
Right weight 1
Diabetes Underweight 0.695 (0.588–0.821) <0.001
Slightly obese 1.743 (1.541–1.973) <0.001
Obese 3.429 (2.868–4.101) <0.001
Right weight 1
Hypertriglyceridemia Underweight 0.627 (0.519–0.758) <0.001
Slightly obese 2.123 (1.885–2.391) <0.001
Obese 3.343 (2.780–4.020) <0.001
Right weight 1
Abdominal obesity Underweight 0.174 (0.123–0.246) <0.001
Slightly obese 8.542 (7.254–10.058) <0.001
Obese 74.717 (56.166–99.396) <0.001
Right weight 1
Low HDL Underweight 0.653 (0.559–0.762) <0.001
Slightly obese 1.666 (1.494–1.859) <0.001
Obese 2.422 (2.006–2.923) <0.001
Right weight 1
HDL, high-density lipoprotein.
Adjusted for age (year), sex, marital status, household income, education, job, smoking, drinking, exercise.
김리연 외. 주관적 체형 인식과 대사증후군과의 연관성 Korean Journal of Family Practice
KJFP
용하면 오차가 생길 수 있는데, 이는 키와 체중만을 이용하여 계산 되었기 때문이다.
2004
년Janssen
등15)의 연구에 의하면 같은BMI
를 가지고 있더라도, 신체의 근육량이나 지방량과 같은 신체 구성 요인 에 따라 대사증후군의 위험도는 달라질 수 있다고 발표하였다. 그리고
2008
년 호주의 사람들을 대상으로 한Atlantis
등16)의 연구에 의 하면 체형이 비만이라고 인식할수록 권장하는 운동시간과 건강에 좋은 음식을 먹는 확률이 낮음을 발표하였다.본 연구에서 주관적 체형 인식으로 생각하는 자신의 비만도보다 Table 4. Association between body weight misperception and metabolic syndrome
Variable Body weight misperception Odds ratio (95% confidence interval) P-value
Metabolic syndrome Under-estimation 1.622 (1.438–1.830) <0.001
Over-estimation 0.398 (0.291–0.544) <0.001
Right-estimation 1
Hypertension Under-estimation 1.312 (1.166–1.477) <0.001
Over-estimation 0.593 (0.444–0.791) <0.001
Right-estimation 1
Diabetes Under-estimation 1.184 (1.057–1.325) 0.003
Over-estimation 0.649 (0.492–0.857) 0.002
Right-estimation 1
Hypertriglyceridemia Under-estimation 1.264 (1.126–1.418) <0.001
Over-estimation 0.816 (0.627–1.063) 0.132
Right-estimation 1
Abdominal obesity Under-estimation 2.057 (1.834–2.307) <0.001
Over-estimation 0.228 (0.151–0.344) <0.001
Right-estimation 1
Low HDL Under-estimation 1.342 (1.192–1.511) <0.001
Over-estimation 0.893 (0.721–1.108) 0.303
Right-estimation 1
HDL, high-density lipoprotein.
Adjusted for age (year), sex, marital status, household income, education, job, smoking, drinking, exercise.
Table 5. Association between body shape misperception and metabolic syndrome on age, sex sub-group analysis
Variable Subject Body shape misperception Odds ratio (95% confidence interval) P-value
Metabolic syndrome Sex
Male Under-estimation 1.289 (1.087–1.529) 0.004
Over-estimation 0.278 (0.106–0.732) 0.010
Right-estimation 1
Female Under-estimation 1.885 (1.604–2.216) <0.001
Over-estimation 0.509 (0.363–0.713) <0.001
Right-estimation 1
Age (y)
20–29 Under-estimation 1.489 (0.762–2.908) 0.244
Over-estimation 0.182 (0.039–0.856) 0.031
Right-estimation 1
30–39 Under-estimation 1.192 (0.799–1.779) 0.390
Over-estimation 0.223 (0.079–0.633) 0.005
Right-estimation 1
40–49 Under-estimation 1.706 (1.320–2.206) <0.001
Over-estimation 0.572 (0.283–1.154) 0.119
Right-estimation 1
50–59 Under-estimation 1.498 (1.196–1.878) <0.001
Over-estimation 0.479 (0.248–0.922) 0.028
Right-estimation 1
≥60 Under-estimation 1.822 (1.547–2.145) <0.001
Over-estimation 0.583 (0.337–1.009) 0.054
Right-estimation 1
Adjusted for age (not in age sub-groups), sex (not in sex sub-groups), marital status, household income, education, job, smoking, drinking, exercise.
Lee Yeon Kim, et al. Body Weight Perception and Metabolic Syndrome in Korean Adults
Korean Journal of Family Practice
KJFP
객관적으로
BMI
로 측정한 비만도가 더 높은 사람에게서 대사증후 군 위험도가 더 높은 것으로 나타났는데, 이는 개인이 비만하지 않 다고 생각함으로써 생활 습관 개선, 신체활동을 하지 않음을 유추 할 수 있다. 실제 신체 이미지를 고려한 주관적 체형 인식은BMI
와 함께 이를 보완해줄 수 있는 지표로 사용할 수 있다. 다른 관점에서 개인이 체구에 비해 과체중으로 인식하는 경우, 건강에 좋지 않은 식습관과 충분하지 못한 신체 활동을 한다는 것으로 생각할 수 있 기 때문에 동일한BMI
와 체구를 가진 다른 사람에 비해 만성질환 을 예방하는 활동을 덜 할 것으로 예측할 수 있다. 그러므로 이러한 생활 습관을 반영하는 간접적인 지표가 될 수 있다.16-18)최근 일부 청소년과 청년을 대상으로 한 연구에서 잘못된 체형 인식을 가지고 있는 사람이 체중 증가, 우울 감정, 심혈관계 문제를 가지고 있는 경우가 많고, 이는 체중 상태가 과체중, 비만이라고 판 단하는 사람들에서 부정적인 심리적 과정에 더 취약 할 수 있다고 제안하였다.19-25) 이러한 작용은 체형에 대한 인식이 과체중, 비만인 경우 금식, 자기 유도 구토, 설사제, 이뇨제 복용과 같은 무질서한 체중 조절 행동(
disordered weight control behavior
)의 더 큰 사용과 관 련될 수 있다고 보고하였으며, 정상 체중이나 과체중, 비만으로 체 형을 인식하는 군에서 가장 두드러진다고 보고하였다.24)본 연구는 국민건강영양조사를 이용하여 조사하였고, 우리나라 의 대표성을 띄는 국민건강영양조사의 큰 표본을 이용하였기 때문 에 일반적인 대한민국 성인에 적용하여 볼 수 있다. 그러나
2015–
2016
년 국민건강영양조사를 이용한 단면적 연구로 면접 방법과 자 기 기입식 문진표에 의한 정보의 부정확성과 손실 가능성 및 회상 오류가 생길 수 있다는 점이 있다. 그리고 본 연구에서는 잘못된 체 중 조절법이나 체중 조절 방식에 대한 체중 변화는 고려하지 못했 다. 본 연구에서는 주관적 체형 인식에 대한 값을 피실험자의 답에 의해 측정하였다. “체격을 어떻게 인식하는가?”라는 질문에 대해 이 에 대한 반응은 연구자들에 의해 측정된 것이 아니므로, 과학적인 측정이라고는 할 수 없다. 넷째, 본 연구의 대상은20
세 이상의 성인 모두를 대상으로 하여, 대사증후군의 주요 관리 대상인 중년층 외 에 노년층도 대상으로 하여 비만을 측정함에 있어 노인에서의 체중 감소 등이 고려되지 않았다.본 연구를 통해 개인의 주관적 체형 인식이 비만하다고 생각할수 록 대사증후군의 위험도가 높아짐을 확인하였으며 비만을 객관적 으로 확인하는
BMI
보다 주관적으로 생각하는 체형 인식이 덜 비만 하다고 생각되는 경우 또한 체형 인식이 올바르거나 객관적인BMI
보다 더 비만하다고 인식하는 경우에 비해 대사증후군의 위험도가 더 높은 것을 확인하였다. 이것은 나이와 성별로 나눈 연구에서도 동일하게 나타났다. 이러한 내용을 종합해 보았을 때, 체형을 인식하였을 때 비만하다고 생각하는 경우 대사증후군의 위험도가 높아 지므로 생활 습관 개선이 필요하며, 체질량지수가 높음에도 비만하 지 않다고 생각하는 군에 대해서는 적극적인 생활 습관 개입이 필 요할 것으로 보인다. 특히
40
세 이상에서 더욱 위험도가 증가하기 때문에 중년 이후 생활 습관 개선과 본인의 정확한 체형 인식이 중 요할 것으로 생각된다. 또한 비만 관리 방법에 대해서는 최근 연구 에서 주관적 체형 인식이 비만하다고 느끼는 군에서 우울감을 느끼 고 무질서한 체중 조절 행동을 보일 수 있으므로 이를 고려한 추가 연구가 필요할 것으로 보인다.요 약
연구배경: 비만은 전세계적으로 문제가 되고 있으며, 지난 수십 년 간 대사증후군은 한국에서 빠르게 증가하였다. 많은 선행연구에서 비만이 대사증후군의 주요 원인임이 밝혀졌으며, 체질량지수(
body mass index
,BMI
), 체형 인식을 대사증후군의 위험도를 평가하는 간 접적인 예측인자로 널리 이용했다. 그리고 주로 체형 인식에 대한 연 구는 성인이 아닌 청소년에 국한되어 연구된 내용이 많아 성인으로 일반화하기에는 어려움이 있었다. 따라서20
세 이상의 성인을 대상 으로 개인의 주관적 체형 인식 정도와 대사증후군의 위험도를 평가 하고, 나아가서BMI
라는 객관적인 척도를 이용하여 주관적 체형 인 식과의 간극을 확인하여 대사증후군의 위험도의 변화를 확인하고 자 한다.방법: 본 연구는 국민건강영양조사 제
6
기3
차년도(2015
년), 제7
기1
차년도(2016
년) 자료를 적용하여20
세 이상의 한국 성인9
,842
명을 대상으로 하였다. 체질량지수 기준은 세계보건기구 아시아태평양 지역 기준과 대한비만학회 비만 기준을 따랐으며, 주관적 체형 인식 에 대한 분류는 국민건강영양조사에서 분류한 매우 마른편, 약간 마른편을 마른편으로 간주하였고, 보통, 약간 비만, 매우 비만으로 나누어 분석하였다. 분석 프로그램은SPSS 23
.0
을 사용하였고 카이 제곱 검정, 분산분석, 로지스틱 회귀분석을 실시하였다.결과: 주관적 체형 인식이 과체중(
OR
,4
.039
;95
%CI
,3
.486–4
.679
), 비만(OR
,11
.840
;95
%CI
,9
.625–14
.565
)에 해당하는 군에서 정상인 군에 비해 대사증후군 위험도가 증가하였으며, 객관적인BMI
지표 보다 주관적 체형 인식에서 덜 비만하다고 생각하는 군이 체형 인 식이 올바른 군에 비해 대사증후군의 위험도가 증가하는 것으로 나 타났다(OR
,1
.622
;95
%CI
,1
.438–1
.830
).결론: 한국 성인에서 객관적인
BMI
지표가 주관적인 체형 인식보다 높은 경우 대사증후군의 위험도가 증가한다.김리연 외. 주관적 체형 인식과 대사증후군과의 연관성 Korean Journal of Family Practice
KJFP
중심단어: 대사증후군; 체질량지수; 비만; 체형 인식 CONFLICT OF INTEREST
No potential conflict of interest relevant to this article was reported
. ORCIDLee Yeon Kim
,https
://orcid
.org
/0000-0003-0319-9441 Kyung Won Shim
,https
://orcid
.org
/0000-0001-8289-9301 Hong Soo Lee
,https
://orcid
.org
/0000-0002-8831-3946 Sang Wha Lee
,https
://orcid
.org
/0000-0002-7451-9978 Ji Yoon Choi
,https
://orcid
.org
/0000-0002-4850-2638
REFERENCES
1. World Health Organization. Obesity and overweight [Internet]. Geneva:
World Health Organization; 2018 [cited 2018 Sep 3]. Available from: http://
www.who.int/news-room/fact-sheets/detail/obesity-and-overweight.
2. Medscape. Obesity to overtake smoking as leading cause of death [Internet].
New York: Medscape; 2004 [cited 2018 Sep 3]. Available from: https://www.
medscape.com/viewarticle/474966.
3. Yoon KH, Lee JH, Kim JW, Cho JH, Choi YH, Ko SH, et al. Epidemic obesity and type 2 diabetes in Asia. Lancet 2006; 368: 1681-8.
4. Isomaa B, Almgren P, Tuomi T, Forsén B, Lahti K, Nissén M, et al. Cardiovas- cular morbidity and mortality associated with the metabolic syndrome. Di- abetes Care 2001; 24: 683-9.
5. Kahn R, Buse J, Ferrannini E, Stern M. The metabolic syndrome: time for a critical appraisal: joint statement from the American Diabetes Association and the European Association for the Study of Diabetes. Diabetes Care 2005; 28: 2289-304.
6. Lim S, Shin H, Song JH, Kwak SH, Kang SM, Yoon WJ, et al. Increasing prev- alence of metabolic syndrome in Korea: the Korean National Health and Nutrition Examination Survey for 1998-2007. Diabetes Care 2011; 34:
1323-8.
7. Al Mamun A, Cramb S, McDermott BM, O'Callaghan M, Najman JM, Wil- liams GM. Adolescents' perceived weight associated with depression in young adulthood: a longitudinal study. Obesity (Silver Spring) 2007; 15:
3097-105.
8. Liechty JM, Lee MJ. Body size estimation and other psychosocial risk factors for obesity onset among US adolescents: findings from a longitudinal popu- lation level study. Int J Obes (Lond) 2015; 39: 601-7.
9. Flegal KM, Carroll MD, Kuczmarski RJ, Johnson CL. Overweight and obe- sity in the United States: prevalence and trends, 1960-1994. Int J Obes Relat Metab Disord 1998; 22: 39-47.
10. Ervin RB. Prevalence of metabolic syndrome among adults 20 years of age and over, by sex, age, race and ethnicity, and body mass index: United States, 2003-2006. Natl Health Stat Report 2009; 13: 1-8.
11. Yoon SH, Han KT, Kim SJ, Sohn TY, Jeon B, Kim W, et al. Combined effect of body mass index and body size perception on metabolic syndrome in South Korea: results of the fifth Korea National Health and Nutrition Ex- amination Surveys (2010-2012). BMC Public Health 2015; 15: 554.
12. WHO Expert Consultation. Appropriate body-mass index for Asian popu- lations and its implications for policy and intervention strategies. Lancet 2004; 363: 157-63.
13. Korean Society for the Study of Obesity. Guideline for the management of obesity 2018. Seoul: Korean Society for the Study of Obesity; 2018.
14. Alberti KG, Eckel RH, Grundy SM, Zimmet PZ, Cleeman JI, Donato KA, et al. Harmonizing the metabolic syndrome: a joint interim statement of the International Diabetes Federation Task Force on Epidemiology and Preven- tion; National Heart, Lung, and Blood Institute; American Heart Associa- tion; World Heart Federation; International Atherosclerosis Society; and In- ternational Association for the Study of Obesity. Circulation 2009; 120:
1640-5.
15. Janssen I, Katzmarzyk PT, Ross R. Waist circumference and not body mass index explains obesity-related health risk. Am J Clin Nutr 2004; 79: 379-84.
16. Atlantis E, Barnes EH, Ball K. Weight status and perception barriers to healthy physical activity and diet behavior. Int J Obes (Lond) 2008; 32: 343- 52.
17. Stice E, Shaw HE. Role of body dissatisfaction in the onset and maintenance of eating pathology: a synthesis of research findings. J Psychosom Res 2002;
53: 985-93.
18. Sakamaki R, Amamoto R, Mochida Y, Shinfuku N, Toyama K. A compara- tive study of food habits and body shape perception of university students in Japan and Korea. Nutr J 2005; 4: 31.
19. Sonneville KR, Thurston IB, Milliren CE, Kamody RC, Gooding HC, Rich- mond TK. Helpful or harmful? Prospective association between weight misperception and weight gain among overweight and obese adolescents and young adults. Int J Obes (Lond) 2016; 40: 328-32.
20. Daly M, Robinson E, Sutin AR. Does knowing hurt? Perceiving oneself as overweight predicts future physical health and well-being. Psychol Sci 2017;
28: 872-81.
21. Rancourt D, Thurston IB, Sonneville KR, Milliren CE, Richmond TK. Lon- gitudinal impact of weight misperception and intent to change weight on body mass index of adolescents and young adults with overweight or obesi- ty. Eat Behav 2017; 27: 7-13.
22. Thurston IB, Sonneville KR, Milliren CE, Kamody RC, Gooding HC, Rich- mond TK. Cross-sectional and prospective examination of weight misper- ception and depressive symptoms among youth with overweight and obesi- ty. Prev Sci 2017; 18: 152-63.
23. Unger ES, Kawachi I, Milliren CE, Sonneville KR, Thurston IB, Gooding HC, et al. Protective misperception? Prospective study of weight self-per- ception and blood pressure in adolescents with overweight and obesity. J Adolesc Health 2017; 60: 680-7.
24. Haynes A, Kersbergen I, Sutin A, Daly M, Robinson E. A systematic review of the relationship between weight status perceptions and weight loss at- tempts, strategies, behaviours and outcomes. Obes Rev 2018; 19: 347-63.
25. Kim Y, Austin SB, Subramanian SV, Kawachi I. The cardiometabolic burden of self-perceived obesity: a multilevel analysis of a nationally representative sample of Korean adults. Sci Rep 2018; 8: 7901.