Susceptibility-Weighted Imaging as a Distinctive Imaging Technique for
Providing Complementary Information for Precise
Diagnosis of Neurologic Disorder
신경계 질환에 관한 정확한 진단을 위해 다양한 보완 정보를 제공하는 독특한 영상 기법으로서의 자기화율 강조 영상
Byeong-Uk Jeon, MD
1, In Kyu Yu, MD
1* , Tae Kun Kim, MD
1, Ha Youn Kim, MD
1, Seungbae Hwang, MD
21Department of Radiology, Eulji University Hospital, Daejeon, Korea
2Department of Radiology, Chonbuk National University Hospital, Jeonju, Korea
Various sequences have been developed for MRI to aid in the radiologic diagnosis. Among the various MR sequences, susceptibility-weighted imaging (SWI) is a high-spatial-resolution, three- dimensional gradient-echo MR sequence, which is very sensitive in detecting deoxyhemoglo- bin, ferritin, hemosiderin, and bone minerals through local magnetic field distortion. In this re- gard, SWI has been used for the diagnosis and treatment of various neurologic disorders, and the improved image quality has enabled to acquire more useful information for radiologists.
Here, we explain the principle of various signals on SWI arising in neurological disorders and provide a retrospective review of many cases of clinically or pathologically proven disease or components with distinctive imaging features of various neurological diseases. Additionally, we outline a short and condensed overview of principles of SWI in relation to neurological dis- orders and describe various cases with characteristic imaging features on SWI. There are many different types diseases involving the brain parenchyma, and they have distinct SWI features.
SWI is an effective imaging tool that provides complementary information for the diagnosis of various diseases.
Index terms Magnetic Resonance Imaging; Brain; Diagnostic Imaging
Received March 24, 2020 Revised June 17, 2020 Accepted July 11, 2020
*Corresponding author In Kyu Yu, MD
Department of Radiology, Eulji University Hospital, 95 Dunsanseo-ro, Seo-gu, Daejeon 35233, Korea.
Tel 82-42-611-3562 Fax 82-42-611-3590 E-mail midosyu@eulji.ac.kr This is an Open Access article distributed under the terms of the Creative Commons Attribu- tion Non-Commercial License (https://creativecommons.org/
licenses/by-nc/4.0) which permits unrestricted non-commercial use, distribution, and reproduc- tion in any medium, provided the original work is properly cited.
ORCID iDs Byeong-Uk Jeon https://
orcid.org/0000-0002-4812-9191 In Kyu Yu
https://
orcid.org/0000-0003-1587-2840 Tae Kun Kim
https://
orcid.org/0000-0001-8841-1549 Ha Youn Kim
https://
orcid.org/0000-0002-7139-8410 Seungbae Hwang
https://
orcid.org/0000-0002-2420-3182
INTRODUCTION
Susceptibility-weighted imaging (SWI) is a high-spatial resolution 3D gradient-echo mag- netic resonance (MR) sequence. This imaging sequence emphasizes paramagnetic, diamag- netic and ferromagnetic qualities and is very responsive to the detection of deoxyhemoglo- bin, ferritin, hemosiderin and bone minerals by distorted local magnetic field (1, 2). The SWI sequence is a further development of the gradient-echo sequence, which is an image gener- ated by the pulse with the flip angle, and reflects the heterogeneity of the surrounding mag- netic field. Hemoglobin, deoxyhemoglobin, iron, etc. are the substances that break down the homogeneity of the local magnetic field, which are frequently seen in neurological diseases.
In this regard, SWI has been used for the diagnosis and treatment of various neurologic dis- orders, and the improved image quality has enabled it to provide more useful information to radiologists. In this paper, we will describe about brief information on various neurological disorders and explain the role of SWI sequence in providing additional imaging information for accurate diagnosis.
CONTENTS
INCREASED DEOXYHEMOGLOBIN
SWI can provide a lot of information about the detailed structure of cerebral venous sys- tems and can occur in signal defecit of cortical veins due to magnetic field differences with surrounding structures depending on the concentration of deoxyhemoglobin present in the vein (3). In the normal physiological condition, the deoxyhemoglobin level is measured about 50%, which is observed as dark signal intensity in SWI. In addition, the oxygen supplied to the brain is cut off during brain death, causing the deoxyhemoglobin level to rise further, which can be observed with the engorgement of the cortical veins with dark signal intensity (4, 5).
Despite of cortical vein with dark signal can observe in these normal or special conditions, we will take a closer look at some of the disease with the engorged cortical veins with signal deficit.
MIGRAINE
Symptoms of migraines usually include unilateral debilitating headaches associated with photophobia, phonophobia, nausea and vomiting (6). To comprehend the pathogenesis of migraine, it is important to be aware of change in cerebral perfusion when symptoms occur (7). SWI showed prominent hypointense signals of venous vasculature within the perfusion disorder area (Fig. 1). Decoupling the supply and demand of oxygen in hypoperfused cere- bral lesion can lead to a relatively increase in deoxyhemoglobin levels in capillaries and veins and a decrease in oxyhemoglobin (8). Karaarslan et al. (7) reported that the area with more noticeable veins on SWI was consistent with the abnormal area on the perfusion MR.
MOYAMOYA DISEASE
Moyamoya disease (MMD) is a rare cerebrovascular disease, causing gradual vascular ste- nosis of the distal part of the bilateral internal carotid arteries, with formation of a marked reticular compensatory collateral artery called “moyamoya vessels” (9, 10). The disease can
induce cerebral ischemia in children, and causes intracerebral hemorrhage of abnormal blood vessels in adults (11). In MDD patients, multiple deep medullary veins (DMVs) were de- tected lateral side of the lateral ventricles (12). SWI has been recognized as a imaging tool to identify to flow of deep vein in acute or chronic ischemia (Fig. 2) and to indicate increased ox- ygen extraction in focal ischemia (2). Horie et al. (12) reported that the increase in a number of dilated DMVs, known as “brush signs”, could predict the severity of MMD.
MEDULLARY VENOUS ENGORGEMENT IN UNILATERAL MCA OCCLUSION
Middle cerebral artery (MCA) is a branched vessel, originating from lateral aspect of the Circle of Willis, and it is the most commonly pathologically affected vessel in the brain. MCA occlusion is most often caused by embolism or a combination of thrombosis and atheroscle- rosis. Unilaterally dilated medullary veins observed on SWI has been reported in many pa- tients diagnosed with acute ischemic stroke (Fig. 3) (13). The predominant presence of hy- pointense veins on SWI is explained by the hypothesis that there is a mismatch between oxygen supply and demand in hypoperfusion tissues, which is thought to be due to the rela- tive increased in deoxyhemoglobin to oxyhemoglobin ratio (8). Payabvash et al. (14) reported that significant correlations between prominent hypointensed thick medullary veins on SWI with arterial occlusion and large infarct volume in acute ischemic stroke.
ACUTE THROMBOSIS ARTERIAL THROMBOSIS
Thrombosis in cerebral vessels is one of the most common cause for acute cerebral infarc- tion. In patients with cerebral infarction, recanalization of occluded cerebral arteries by rapid
A B C
Fig. 1. Migraine.
A-C. The diffusion-weighted image (A) and apparent diffusion coefficient map (B) show non-specific findings in the brain parenchyma. The susceptibility-weighted image (C) shows more diffuse prominent venous structures (dark signal) in the left hemisphere than in the right hemi- sphere, suggesting elevated deoxyhemoglobin levels.
thrombus removal within 6 hours can increase brain tissue reperfusion and save the isch- emic penumbra, which is important for improving patient’s prognosis (15). Intravascular thrombus is seen as a hypointense susceptibility vessel sign (SVS) which has a imaging fea- tures as a thickened and dark signal intense intravascular artifact (Fig. 4). SVS indicates an increase in deoxyhemoglobin due to a local accumulation in red blood cells (RBCs), which is manifested by the trapping of RBCs in occluded blood vessels (16-18).
VENOUS SYSTEM THROMBOSIS
Thrombosis that occurs in the cerebral venous system is a serious cerebrovascular disease that can cause serious brain injury, such as venous infarction and parenchymal bleeding (19).
Cerebral vein thrombosis (CVT) occurs primarily in the venous sinus, which has been report- ed to be associated with cortical or deep cerebral venous thrombosis (20). Due to the high Fig. 2. Moyamoya disease.
A-D. Magnetic resonance angiographic images (A, C) show near-total occlusion or segmental severe steno- sis at the right proximal middle cerebral artery (arrows). Susceptibility-weighted images (B, D) show promi- nent linear dark signal intensity (medullary vein) in both frontoparietal white matter (arrows).
A
C
B
D
sensitivity to the susceptible effects of SWI in the acute phase of thrombosis and cortical CVT, SWI provides an additional diagnostic clue for blood clot detection with conventional MR sequences and magnetic resonance venography (21). Thickened and prominent cerebral cortical veins with hypointensity on SWI, accompanied by hyperintense of nearby brain pa- renchyma can be diagnosed as presence of CVT with venous hypertension (Fig. 5) (22). In ad- dition, hypointense thrombus is visible in T2-weighted images caused by flow voids in the presence of dural sinus thrombosis. When MRI images are obtained using gadolinium-con- taining contrast media, thrombi appear as filling defects in contrast-enhanced venous sinus- es (empty delta sign) (Fig. 6) (23).
A
C
B
D
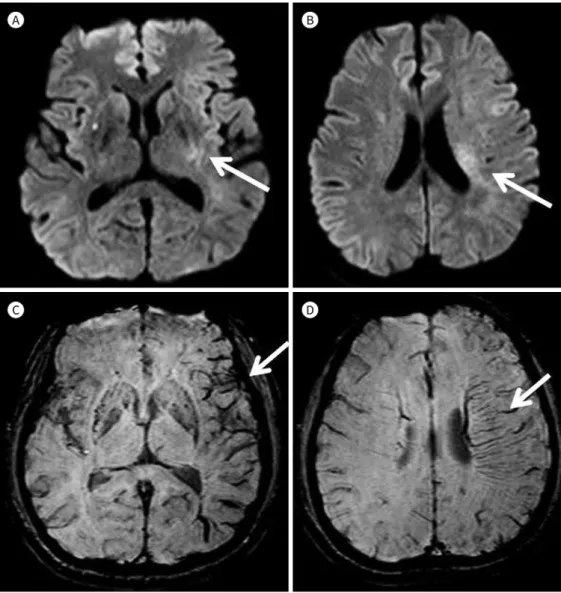
Fig. 3. Medullary venous engorgement in unilateral middle cerebral artery occlusion.
A-D. Initial diffusion-weighted images (A, B) show focal, small, patchy, and increased signal intensity in the left posterior internal capsule and posterior frontal paraventricular white matter area (arrows). Susceptibili- ty-weighted images (C, D) show localized prominently visible deep medullary veins in the left frontoparietal white matter area (arrows).
ACUTE HEMORRHAGE DIFFUSE AXONAL INJURY
Diffuse axon injury (DAI) refers to axons and small blood vessel injuries caused by sudden
A
C
B
D Fig. 4. Arterial thrombosis.
A, B. The diffusion-weighted (A) and fluid-attenuated inversion recovery (B) images show high signal inten- sity in the right frontoparietotemporal cortex white matter area (arrows). It suggests acute infarction in the right internal carotid arterial territory.
C. SWI shows focal thickened linear dark SWI signal intensity (arrow) in the right proximal M1 of middle ce- rebral artery.
D. Computed tomography angiography shows total occlusion in the right proximal internal carotid artery, (arrow) with poorly visible right internal carotid artery, middle cerebral artery, right anterior cerebral artery, and distal run-off.
SWI = susceptibility-weighted imaging
acceleration or deceleration of the head by external impacts and is one of the main causes of expire and post-accident sequelae (24). In patients with apparent hemorrhage have worse prognosis than without hemorrhage (24). The histological classification of DAI by the distri- bution of anatomical damages was first proposed by Adams in 1989. In grade I, there is axo- nal injuries in the white matter of the cerebrum, cerebellum and brainstem; in grade 2, there is localized injuries appear in the corpus callosum as well; and in grade 3, it shows localized injuries at the dorsolateral or rostral part of the brain stem (25). Image findings on post-DAI
A
C D
B Fig. 5. Venous system thrombosis.
A-D. The susceptibility-weighted images (A-C) show multifocal curvilinear dark signal intensity in both infe- rior cerebellar folias, with multiple engorged superficial and deep cerebral veins in both posterior cerebellar hemispheres, (arrows) both superficial cerebral cortical veins, both high frontoparietal cortical veins, and deep medullary and internal cerebral veins. It suggests multifocal cerebellar superficial and deep cerebral venous thrombosis. Initial diffusion-weighted image (D) shows focal, small, patchy, high signal intensity in the right corpus callosal splenium, (arrow) suggesting a focal venous infarct.
hemorrhage in SWI clearly showed the size and extent of the focal hemorrhagic point. Vari- ous sized spot-like or nodular, patchy low signal foci are seen scattered in the predilection site (Fig. 7) (26).
REVERSIBLE CEREBRAL VASOCONSTRICTION SYNDROME WITH SAH
Reversible cerebral vasoconstriction syndrome (RCVS) can cause severe headaches that can accompany acute neurological symptoms, which are accompanied by segmental contraction of the cerebral artery, which shows resolution within 3 months (27). Thunder-clap headaches occur for less than one minute, accompanied by small localized convexity subarachnoid hem- orrhage (22–34%) and intracranial hemorrhage (6–20%) (28, 29). Brain MR findings in RCVS patients are normally seen, but diffuse vasocontractions are observed in cerebral angiography (27). In fluid attenuated inversion recovery images, it can be used to identify the presence of subarachnoid hemorrhage or cerebral edema, and SWI also helps to identify the presence of convexity subarachnoid hemorrhage and intracranial hemorrhage (Fig. 8) (30).
A
C
B
D Fig. 6. Venous system thrombosis.
A, B. Susceptibility-weighted images show multifocal thickened dark signal intensity in the superior sagittal sinus and thickened high vertex cortical veins (arrows).
C. T1-weighted imaging shows a focal empty delta sign in the high frontal superior sagittal sinus (arrow). It suggests dural sinus thrombosis.
D. Magnetic resonance venography shows the invisible normal superior sagittal sinus (arrows).
FERROMAGNETIC & PARAMAGNETIC COMPOUNDS CEREBRAL AMYLOID ANGIOPATHY
CAA is well known for appearing as amyloid protein precipitates in small arteries (31). Al- though CAA and systemic amyloidosis are less relevant, it is linked to aging, dementia and Alzheimer disease (31). In SWI, multiple dark signal foci distributed in cortical-subcortical area (Fig. 9). This image finding is thought to be caused by two reasons: paramagnetic (hemo- siderin deposition) and ferromagnetic (ferritin) compounds. Weakened vascular walls result- ing in impaired elasticity by the accumulation of β-amyloid protein in elastic lamina of vessel walls become vulnerable to shock, which causes micro-hemorrhage (32). Studies have also re- ported that excessive iron increases amyloid and β-amyloid protein condensation and thus cause neurotoxicity. The accumulation of protein can be considered to have occurred signal void in the SWI sequence due to ferromagnetic artifact (33).
A
D
B
E
C
F Fig. 7. Diffuse axonal injury.
A-F. The fluid-attenuated inversion recovery (A) and T2-weighted (B) images show multifocal intermediate or high signal intensity, surround- ing edema in both anteroinferior and high frontoparietal anterior temporal white matter cortex areas and in the body and splenium of the corpus callosum area. The susceptibility-weighted images (C-F) show multifocal dark and some curvilinear signal intensity in the anteroinferi- or high frontoparietal white matter cortex area (arrows).
VASCULAR MALFORMATION BRAIN CAPILLARY TELANGIECTASIA
Brain capillary telangiectasia (BCT) is mostly found incidentally during cerebral MR scans.
It is generally considered benign entities that are non-symptomatic and no longer implicit in patient further evaluation. Telangiectasia is a commonly small lesion, usually found in pons in size from a few mm to a few cm, but is not well represented in conventional MR sequences (34). In SWI sequences, BCT is well observed by focal dark signal foci (Fig. 10). It can explain by decreased blood velocity in ectatic vein of a BCT, resulting in increasing the deoxyhemo-
A B
C
D Fig. 8. Reversible cerebral vasoconstriction syndrome.
A-D. The susceptibility-weighted image shows multifocal dark signal intensity due to cerebral vasoconstric- tion in both frontoparietal convexities and localized dark signal intensity (arrows) (A, B) and high fluid-at- tenuated inversion recovery signal intensity (C) in the right frontal convexity. It suggests acute subarachnoid hemorrhage. Computed tomography angiography (D) shows multifocal mild or moderate stenosis in both middle cerebral arteries (arrows).
globin concentration by decrease of oxygen saturation of hemoglobin, causing the observed susceptibility effect (35).
DEVELOPMENTAL VENOUS ANOMALY
Developmental venous anomaly (DVA), also known as cerebral venous angioma, is the most commonly found vascular malformation of cerebral veins. DVA is mostly discovered in- cidentally, and although it is not yet clear as to the cause of the outbreak, it is thought to oc- cur due to arrested development of venous structures (36). The SWI sequence can be much more sensitive to detection of malformation of venous structures than conventional T2 con- trast enhancement images (Fig. 11). The signal intensity of the vein is observed darkly in
A
C
B
D Fig. 9. Cerebral amyloid angiopathy.
A-D. The susceptibility-weighted images show multifocal dark signal intensity in both cerebellar hemi- spheres, both basal ganglia, right thalamus, and both cerebral cortex white matter areas. The patient was diagnosed with Alzheimer dementia approximately 10 years ago.
SWI, but with varying signal intensities according to blood flow in venous structures, as rela- tively higher flow may reduce the amount of deoxyhemoglobin (37).
OTHERS DUAL RIM SIGN
Dual rim sign refers to two concentric rims appears in the pyogenic brain abscess, sur- rounding the abscess cavity. Outer one of dual rim sign is hypointense, and the inner one rel- atively more hyperintense (Fig. 12) (38). The paramagentic free radicals, metabolic products of macrophages have been suggested as forming the hypointense outer rim, and the hyper- intense inner rim is formed by granulation tissues between the necrotic center and fibrocol-
A
D
B C
E Fig. 10. Brain capillary telangiectasia.
A, B. MR T2-weighted (A) and T1-weighted (B) images show no definite abnormal signal intensity in the pontine area.
C-E. The susceptibility-weighted image (C) shows focal small dark signal intensity (arrow), and post-contrast-enhanced MR images (D, E) show a weak-irregular enhancing lesion in the right posterior pons area (arrows). Capillary telangiectasias is mostly located in the brainstem, particularly in the pons area.
MR = magnetic resonance
lagenous capsule (38, 39).
CONCLUSION
The use of MR in sensitization diagnosis for various lesions has increased, with the recent development of various MR sequences by rapid technological development. Among the vari- ous kinds of MR sequences, the SWI provides additional radiologic clue to the radiologist’s diagnosis about various vascular diseases, hemorrhage, and infectious/inflammatory disease
A
C
B
D Fig. 11. Developmental venous anomaly.
A-D. The magnetic resonance FLAIR (A) and susceptibility-weighted (B, C) images show focal, small, lobu- lated, central high signal intensity, internal septated, marginal dark signal lesion (arrows) with blooming ar- tifact (arrowheads) in the right frontal paraventricular white matter area. It appears to be the accompanying cavernous malformation. Another finding on FLAIR image (A) is focal, small, high signal intensity adjacent to the developmental venous anomaly, with an enhancing vascular structure (arrow) (D).
FLAIR = fluid attenuated inversion recovery
lesions. It is thought to be improved of the quality of SWI sequence, it will be necessary to be aware the characteristic radiologic findings for radiologists to make accurate diagnosis and provide proper treatment to the clinician.
Author Contributions
Conceptualization, J.B., Y.I.K.; data curation, all authors; investigation, J.B., Y.I.K.; methodology, all authors; project administration, J.B.; resources, all authors; supervision, Y.I.K.; visualization, all au- thors; writing—original draft, J.B., Y.I.K.; and writing—review & editing, J.B., Y.I.K.
Conflicts of Interest
The authors have no potential conflicts of interest to disclose.
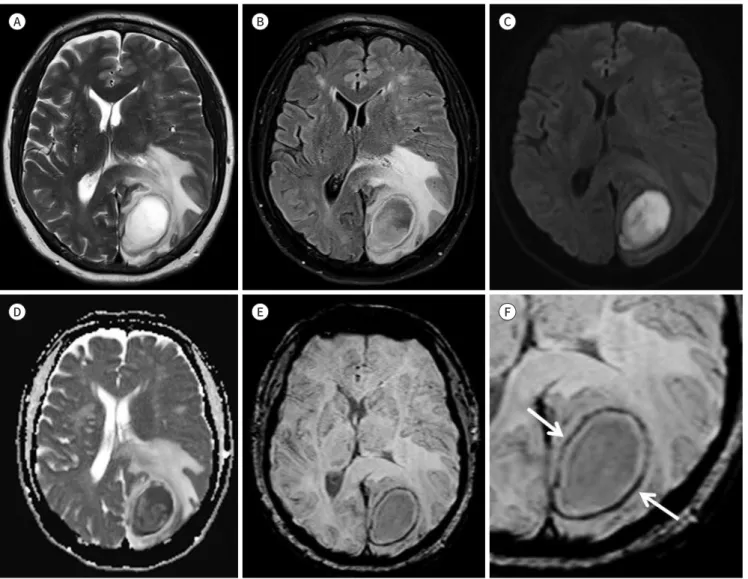
Fig. 12. Dual rim sign.
A-F. The T2-weighted (A) and fluid-attenuated inversion recovery (B) images show localized, relatively smooth marginated, central cavitary le- sion [high diffusion-weighted imaging signal intensity (C), with diffusion restriction on apparent diffusion coefficient maps (D)], with marginal wall enhancement in the left occipital white matter and some cortex areas. And there are outer dark susceptibility-weighted imaging (E, F) signal rim (arrows), with slightly uneven thickened enhancing capsule (maximal thickness: approximately 5 mm in the anteromedial portion), surrounding moderate edema, and mass effect. The patient underwent tumor resection and was diagnosed with a brain abscess.
A
D
B
E
C
F
REFERENCES
1. Haacke EM, Xu Y, Cheng YC, Reichenbach JR. Susceptibility weighted imaging (SWI). Magn Reson Med 2004;
52:612-618
2. Tong KA, Ashwal S, Obenaus A, Nickerson JP, Kido D, Haacke EM. Susceptibility-weighted MR imaging: a review of clinical applications in children. AJNR Am J Neuroradiol 2008;29:9-17
3. Ogawa S, Lee TM, Kay AR, Tank DW. Brain magnetic resonance imaging with contrast dependent on blood oxygenation. Proc Natl Acad Sci U S A 1990;87:9868-9872
4. Sedlacik J, Löbel U, Kocak M, Loeffler RB, Reichenbach JR, Broniscer A, et al. Attenuation of cerebral ve- nous contrast in susceptibility-weighted imaging of spontaneously breathing pediatric patients sedated with propofol. AJNR Am J Neuroradiol 2010;31:901-906
5. Sohn CH, Lee HP, Park JB, Chang HW, Kim E, Kim E, et al. Imaging findings of brain death on 3-tesla MRI.
Korean J Radiol 2012;13:541-549
6. International Classification of Headache Disorders. Headache Classification Subcommittee of the Interna- tional Headache Society. 2nd ed. Cephalalgia 2004; 24(suppl 1):9-160
7. Karaarslan E, Ulus S, Kürtüncü M. Susceptibility-weighted imaging in migraine with aura. AJNR Am J Neu- roradiol 2011;32:E5-E7
8. Mittal S, Wu Z, Neelavalli J, Haacke EM. Susceptibility-weighted imaging: technical aspects and clinical ap- plications, part 2. AJNR Am J Neuroradiol 2009;30:232-252
9. Suzuki J, Takaku A. Cerebrovascular “moyamoya” disease. Disease showing abnormal net-like vessels in base of brain. Arch Neurol 1969;20:288-299
10. Suzuki J, Kodama N. Moyamoya disease--a review. Stroke 1983;14:104-109
11. Kuroda S, Houkin K. Moyamoya disease: current concepts and future perspectives. Lancet Neurol 2008;
7:1056-1066
12. Horie N, Morikawa M, Nozaki A, Hayashi K, Suyama K, Nagata I. “Brush Sign” on susceptibility-weighted MR imaging indicates the severity of moyamoya disease. AJNR Am J Neuroradiol 2011;32:1697-1702
13. Mucke J, Möhlenbruch M, Kickingereder P, Kieslich PJ, Bäumer P, Gumbinger C, et al. Asymmetry of deep medullary veins on susceptibility weighted MRI in patients with acute MCA stroke is associated with poor outcome. PLoS One 2015;10:e0120801
14. Payabvash S, Benson JC, Taleb S, Rykken JB, Hoffman B, Oswood MC, et al. Prominent cortical and med- ullary veins on susceptibility-weighted images of acute ischaemic stroke. Br J Radiol 2016;89:20160714 15. Furlan A, Higashida R, Wechsler L, Gent M, Rowley H, Kase C, et al. Intra-arterial prourokinase for acute
ischemic stroke. The PROACT II study: a randomized controlled trial. Prolyse in acute cerebral thrombo- embolism. JAMA 1999;282:2003-2011
16. Cho KH, Kim JS, Kwon SU, Cho AH, Kang DW. Significance of susceptibility vessel sign on T2*-weighted gradient echo imaging for identification of stroke subtypes. Stroke 2005;36:2379-2383
17. Allibert R, Billon Grand C, Vuillier F, Cattin F, Muzard E, Biondi A, et al. Advantages of susceptibility-weighted magnetic resonance sequences in the visualization of intravascular thrombi in acute ischemic stroke. Int J Stroke 2014;9:980-984
18. Flacke S, Urbach H, Keller E, Träber F, Hartmann A, Textor J, et al. Middle cerebral artery (MCA) susceptibili- ty sign at susceptibility-based perfusion MR imaging: clinical importance and comparison with hyperdense MCA sign at CT. Radiology 2000;215:476-482
19. Stam J. Thrombosis of the cerebral veins and sinuses. N Engl J Med 2005;352:1791-1798
20. Ferro JM, Canhão P, Stam J, Bousser MG, Barinagarrementeria F; ISCVT Investigators. Prognosis of cerebral vein and dural sinus thrombosis: results of the International Study on Cerebral Vein and Dural Sinus Thrombosis (ISCVT). Stroke 2004;35:664-670
21. Idbaih A, Boukobza M, Crassard I, Porcher R, Bousser MG, Chabriat H. MRI of clot in cerebral venous throm- bosis: high diagnostic value of susceptibility-weighted images. Stroke 2006;37:991-995
22. Tsui YK, Tsai FY, Hasso AN, Greensite F, Nguyen BV. Susceptibility-weighted imaging for differential diagno- sis of cerebral vascular pathology: a pictorial review. J Neurol Sci 2009;287:7-16
23. Provenzale JM, Kranz PG. Dural sinus thrombosis: sources of error in image interpretation. AJR Am J Roent- genol 2011;196:23-31
24. Paterakis K, Karantanas AH, Komnos A, Volikas Z. Outcome of patients with diffuse axonal injury: the sig-
nificance and prognostic value of MRI in the acute phase. J Trauma 2000;49:1071-1075
25. Adams JH, Doyle D, Ford I, Gennarelli TA, Graham DI, McLellan DR. Diffuse axonal injury in head injury: def- inition, diagnosis and grading. Histopathology 1989;15:49-59
26. Tao JJ, Zhang WJ, Wang D, Jiang CJ, Wang H, Li W, et al. Susceptibility weighted imaging in the evaluation of hemorrhagic diffuse axonal injury. Neural Regen Res 2015;10:1879-1881
27. Ducros A. Reversible cerebral vasoconstriction syndrome. Lancet Neurol 2012;11:906-917
28. Ducros A, Boukobza M, Porcher R, Sarov M, Valade D, Bousser MG. The clinical and radiological spectrum of reversible cerebral vasoconstriction syndrome. A prospective series of 67 patients. Brain 2007;130:3091- 3101
29. Singhal AB, Hajj-Ali RA, Topcuoglu MA, Fok J, Bena J, Yang D, et al. Reversible cerebral vasoconstriction syndromes: analysis of 139 cases. Arch Neurol 2011;68:1005-1012
30. Miller TR, Shivashankar R, Mossa-Basha M, Gandhi D. Reversible cerebral vasoconstriction syndrome, part 2: diagnostic work-up, imaging evaluation, and differential diagnosis. AJNR Am J Neuroradiol 2015;36:
1580-1588
31. Haacke EM, DelProposto ZS, Chaturvedi S, Sehgal V, Tenzer M, Neelavalli J, et al. Imaging cerebral amyloid angiopathy with susceptibility-weighted imaging. AJNR Am J Neuroradiol 2007;28:316-317
32. Walker DA, Broderick DF, Kotsenas AL, Rubino FA. Routine use of gradient-echo MRI to screen for cerebral amyloid angiopathy in elderly patients. AJR Am J Roentgenol 2004;182:1547-1550
33. Mantyh PW, Ghilardi JR, Rogers S, DeMaster E, Allen CJ, Stimson ER, et al. Aluminum, iron, and zinc ions promote aggregation of physiological concentrations of beta-amyloid peptide. J Neurochem 1993;61:
1171-1174
34. Kim TH, Lee JH. Application of iron related magnetic resonance imaging in the neurological disorders. Ann Clin Neurophysiol 2014;16:1-7
35. El-Koussy M, Schroth G, Gralla J, Brekenfeld C, Andres RH, Jung S, et al. Susceptibility-weighted MR imag- ing for diagnosis of capillary telangiectasia of the brain. AJNR Am J Neuroradiol 2012;33:715-720
36. Boukobza M, Enjolras O, Guichard JP, Gelbert F, Herbreteau D, Reizine D, et al. Cerebral developmental ve- nous anomalies associated with head and neck venous malformations. AJNR Am J Neuroradiol 1996;17:
987-994
37. Fushimi Y, Miki Y, Togashi K, Kikuta K, Hashimoto N, Fukuyama H. A developmental venous anomaly pre- senting atypical findings on susceptibility-weighted imaging. AJNR Am J Neuroradiol 2008;29:E56 38. Toh CH, Wei KC, Chang CN, Hsu PW, Wong HF, Ng SH, et al. Differentiation of pyogenic brain abscesses
from necrotic glioblastomas with use of susceptibility-weighted imaging. AJNR Am J Neuroradiol 2012;33:
1534-1538
39. Robinson RJ, Bhuta S. Susceptibility-weighted imaging of the brain: current utility and potential applica- tions. J Neuroimaging 2011;21:e189-e204
신경계 질환에 관한 정확한 진단을 위해 다양한 보완 정보를 제공하는 독특한 영상 기법으로서의 자기화율 강조 영상
전병욱
1· 유인규
1* · 김태건
1· 김하연
1· 황승배
2자기공명영상 기술의 개발에 따라 다양한 종류의 시퀀스가 개발되어 방사선 진단에 큰 도움 이 되었다. 다양한 자기공명영상 시퀀스 중에서 자기화율 강조 영상은 고 공간 분해능 3차원 경사 에코 시퀀스를 발전시킨 것으로 국소 자기장 왜곡에 의한 디옥시헤모글로빈, 페리틴, 헤모시데린 및 골, 광물 검출에 매우 민감하다. 이러한 영상 특징으로 인해 자기화율 강조 영 상은 다양한 신경 장애의 진단과 치료에 사용되어 왔으며, 영상 화질이 향상되어 방사선 전 문의에게 보다 유용한 정보를 제공할 수 있게 되었다. 다양한 신경 장애에서 발생할 수 있는 자기화율 강조 영상에 나타날 수 있는 다양한 신호의 원리를 설명하고, 독특한 영상의학적 특징을 가진 질환 혹은 물질에 대해 임상적 또는 병리학적으로 진단된 환자들에 관하여 각각 의 질병에 맞추어 조사하였다. 또한 자기화율 강조 영상에서 각각의 신경 장애에서 보일 수 있는 영상의학적 특징에 대해 질환의 전반적인 정보를 함께 요약하여 정리하였다. 뇌 실질 및 주변 조직에 생기는 다양한 신경계 질환들은 자기화율 강조 영상에서 뚜렷하게 구분되는 다양한 영상학적 특징을 보인다. 이에 의해 자기화율 강조 영상은 다양한 보조적 정보를 통 해 적절한 진단에 도움을 준다.
1을지대학교병원 영상의학과, 2전북대학교병원 영상의학과