Relationship between Coronary Artery Calcium Score by
Multidetector Computed Tomography and Plaque Components by Virtual Histology Intravascular Ultrasound
The aim of this study was to evaluate the relationship between coronary artery calcium score (CACS) assessed by multidetector computed tomography (MDCT) and plaque components assessed by virtual histology-intravascular ultrasound (VH-IVUS) in 172 coronary artery disease (CAD) patients with 250 coronary lesions. CACS was assessed according to Agatston scoring method by MDCT and patients were divided into four groups: Group I (CACS = 0 [n = 52]); Group II (CACS = 1-100 [n = 99]); Group III (CACS = 101-400 [n = 84]); and Group IV (CACS > 400 [n = 15]). Total atheroma volume was greatest in Group IV (152 ± 132 µL vs 171 ± 114 µL vs 195 ± 149 µL vs 321±182 µL, P <
0.001). The absolute dense calcium (DC) and necrotic core (NC) volumes were greatest, and relative DC volume was greatest in Group IV (5.5 ± 6.6 µL vs 11.0 ± 10.3 µL vs 15.6 ± 13.6 µL vs 36.6 ± 18.2 µL, P < 0.001, and 14.8 ± 18.2 µL vs 19.5 ± 18.9 µL vs 22.5 ± 19.1 µL vs 41.7 ± 27.9 µL, P < 0.001, and 6.4 ± 5.3% vs 11.0 ± 6.2% vs 14.0 ± 6.5% vs 20.0 ± 7.8%, P < 0.001, respectively). The absolute plaque and DC and NC volumes and the relative DC volume correlated positively with calcium score. CAD patients with high calcium score have more vulnerable plaque components (greater DC and NC-containing plaques) than those with low calcium score.
Key Words: Coronary Disease; Multidetector Computed Tomography; Coronary Artery Calcium Score; Plaque; Intravascular Ultrasound
Yun Ha Choi1, Young Joon Hong1, In Hyae Park2, Myung Ho Jeong1, Khurshid Ahmed1, Seung Hwan Hwang1, Min Goo Lee1, Keun-Ho Park1,
Doo Sun Sim1, Ju Han Kim1, Youngkeun Ahn1, Jeong Gwan Cho1, Jong Chun Park1 and Jung Chaee Kang1
1The Heart Center, Chonnam National University Hospital, Gwangju; 2College of Nursing, Chonnam National University, Gwangju, Korea
Received: 28 February 2011 Accepted: 11 May 2011 Address for Correspondence:
Young Joon Hong, MD
Department of Cardiology, The Heart Center, Chonnam National University Hospital, 671 Jebong-ro, Dong-gu, Gwangju 501-757, Korea
Tel: +82.62-220-6978, Fax: +82.62-223-3105 E-mail: [email protected]
This study was supported by a grant of the Korea Healthcare Technology R&D project (A084869), Ministry for Health, Welfare & Family Affairs, Republic of Korea.
DOI: 10.3346/jkms.2011.26.8.1052 • J Korean Med Sci 2011; 26: 1052-1060
INTRODUCTION
Coronary artery calcium is correlated closely with atheroscle- rotic plaque formation and has recently been developed as a marker of coronary atherosclerosis (1, 2). Also coronary calci- um score can predict total mortality and degree of coronary ar- tery disease risk according to Framingham criteria (3). Several studies have demonstrated a relation between the degree of cor- onary artery calcium and the severity of atherosclerosis and clin- ical events (4-8), and have shown that coronary artery calcium score (CACS) was associated with plaque burden and morphol- ogy (9-11). However, sparse data are available about the relation between CACS and plaque components.
Therefore, the aim of the present study was to evaluate the relation between CACS assessed by multidetector computed tomography (MDCT) and plaque components assessed by vir- tual histology-intravascular ultrasound (VH-IVUS) in patients with coronary artery disease (CAD).
MATERIALS AND METHODS Patient population
This study was a retrospective, single-center study. From Janu- ary 2007 to November 2009, a total of 172 CAD patients with 250 coronary lesions who underwent MDCT and VH-IVUS at Chon- nam National University Hospital were enrolled in this study.
Laboratory analysis
The blood samples were centrifuged, and serum was collected and stored at -70°C until the assay was performed. Absolute cre- atine kinase-myocardial band levels were determined by radio- immunoassay (Dade Behring Inc., Miami, FL, USA). Cardiac- specific troponin I levels were measured by a paramagnetic par- ticle, chemiluminescent immunoenzymatic assay (Beckman, Coulter Inc., Fullerton, CA, USA). The serum levels of total cho- lesterol, triglyceride, low-density lipoprotein cholesterol, and high-density lipoprotein cholesterol were measured by standard enzymatic methods. High-sensitivity C-reactive protein was an-
alyzed turbidimetrically with sheep antibodies against human C-reactive protein; this has been validated against the Dade-Beh- ring method (12).
Coronary angiographic analysis
Coronary angiogram was analyzed with validated QCA system (Phillips H5000 or Allura DCI program, Philips Medical Systems, Eindhoven, the Netherlands) (13). With the outer diameter of the contrast-filled catheter as the calibration standard, the min- imal lumen diameter and reference diameter were measured in diastolic frames from orthogonal projections.
Cardiac MDCT analysis
In the absence of contraindications (contraindication to intrave- nous contrast agents [contrast allergy] or elevated serum creati- nine [> 1.3 mg/dL] or atrial fibrillation or frequent ventricular ectopy [> 10 extra systoles per minute], or a heart rate > 90 beats per minute), all patients with a resting heart rate of > 70 bpm re- ceived 50-100 mg of metoprolol orally 1-2 hr before scan. Blood pressure and pulse were rechecked immediately prior to per- forming the prodedure. CT examinations were performed with a two-phase, contrast-enhanced, electrocardiogram-gated, MDCT scanner (Sensation Cardiac 64, Siemens, Forcheim, Germany) set at a 0.75-mm section thickness with a gantry rotation time of 330 msec and a kernel value of B25f. The scan delay was de- termined using the bolus tracking technique: when a threshold of 120 Hounsfield Units (HU) was reached in the ascending aor- ta at the level of origin of the coronary arteries, a delay of 5 sec- onds was applied before the scan was initiated.
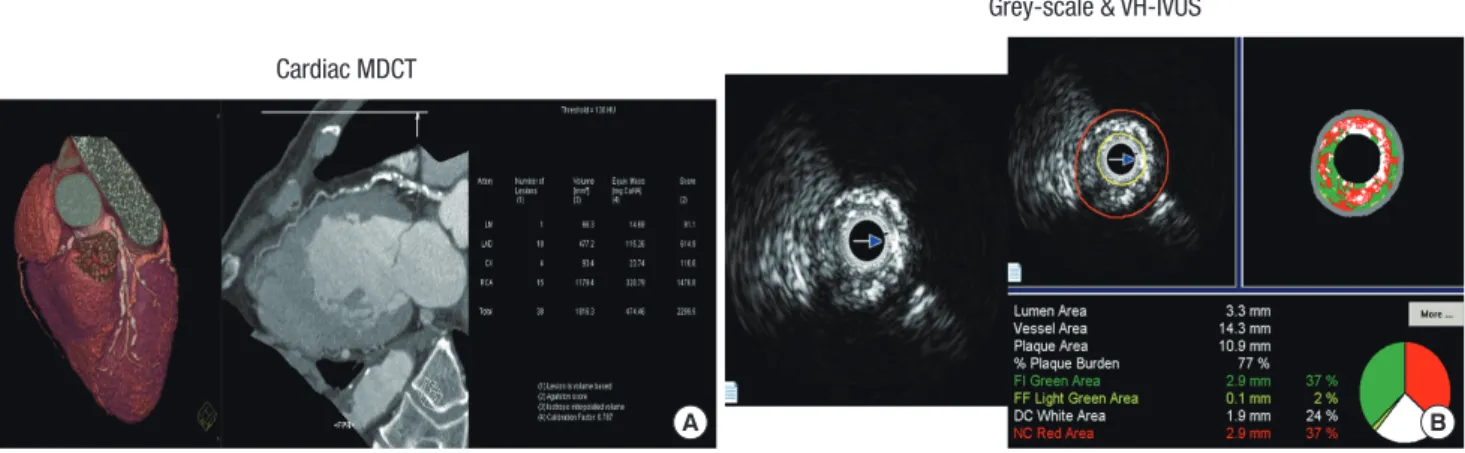
CACS were determined on a workstation (CaScore, Siemens, Germany) with software for coronary artery calcification accord- ing to the Agatston method as previously described (14). We clas- sified the CACS as follows: Group I (calcium score = 0), Group II (calcium score = 1-100), Group III (calcium score = 101-400), Group IV (calcium score > 400) (Fig. 1A).
IVUS imaging and analysis
All pre-intervention grey-scale and VH-IVUS examinations were performed after intracoronary administration of 300 µg nitro- glycerin. A 20-MHz, 2.9F IVUS imaging catheter (Eagle Eye, Vol- cano Corp, Rancho Cordova, CA, USA) was advanced > 10 mm beyond the lesion; and automated pullback was performed to a point > 10 mm proximal to the lesion at a speed of 0.5 mm/sec.
Grey-scale IVUS and VH-IVUS data were analyzed by 2 inde- pendent observers. The levels of reproducibility for external elas- tic membrane, lumen, and plaque plus media cross-sectional areas using the Spearman rank-order correlation coefficients were 0.95, 0.97, and 0.97, respectively. Similarly, for plaque com- ponents by VH-IVUS, reproducibility for the fibrous, fibro-fatty, dense calcium, and necrotic core volume measurements using the Spearman rank-order correlation coefficients were 0.95, 0.92, 0.93, and 0.93, respectively.
Quantitative volumetric grey-scale and VH-IVUS analyses were performed across the entire lesion segment, and cross-sec- tional analysis was performed at the minimum lumen area sites and at the largest necrotic core sites. Conventional quantitative volumetric grey-scale IVUS analysis was performed according to the American College of Cardiology Clinical Expert Consen- sus Document on Standards for Acquisition, Measurement and Reporting of Intravascular Ultrasound Studies (15). Measure- ments were made by every 1-mm interval for the region of in- terest, which was defined as the segment between distal to prox- imal reference sites that were the most normal looking within 5 mm proximal and distal to the lesion. Volumetric data were gen- erated by the software using Simpson’s method. External elastic membrane and lumen cross-sectional areas were measured.
Plaque plus media cross-sectional area was calculated as exter- nal elastic membrane minus lumen cross-sectional area; and plaque burden was calculated as plaque plus media divided by external elastic membrane cross-sectional area. Total atheroma volume was calculated by summation of atheroma area from each measured image as: TAV = ∑ (external elastic membrane
A B
Cardiac MDCT
Grey-scale & VH-IVUS
Fig. 1. The examples of coronary artery calcium detected by cardiac multidetector computed tomography (MDCT) (A) and plaque components assessed by virtual histology-in- travascular ultrasound (VH-IVUS) (B).
area-lumen area). The percent atheroma volume was determin- ed using the formula: PAV = 100 × (∑ [external elastic membrane area-lumen area]/∑ [external elastic membrane area]). VH-IVUS analysis classified the color-coded tissue into four major com- ponents: green (fibrous), yellow-green (fibro-fatty), white (dense calcium), and red (necrotic core) (16). VH-IVUS analysis was reported in absolute amounts and as a percentage of plaque area or volume (Fig. 1B). Thin-cap fibroatheroma was defined as a necrotic core ≥ 10% of plaque area in at least 3 consecutive frames without overlying fibrous tissue in the presence of ≥ 40%
least 3 plaque burden.
Statistical analysis
The statistical package for social sciences (SPSS) for Windows, version 15.0 (Chicago, IL, USA) was used for all analyses. Con- tinuous variables were presented as the mean value ± SD; com- parisons were conducted by ANOVA. Discrete variables were presented as percentages and frequencies; comparisons were conducted by chi-square test, where appropriate. Pearson’s cor- relation was used to evaluate the correlation between VH-IVUS
parameters and CACS. A P value < 0.05 was considered statisti- cally significant.
Ethics statement
The protocol was approved by the institutional review board of Chonnam National University Hospital (2010-06-112). Informed consent form was exempted because this study was a retrospec- tive enrollment by review of hospital records.
RESULTS
Baseline characteristics
The baseline characteristics are summarized in Table 1. Group IV was oldest, and hypertension was observed most frequently in Group IV. The neutrophil count and hemoglobin level were lowest in Group IV. The high-density lipoprotein-cholesterol level was lowest in Group IV.
Coronary angiographic findings
Coronary angiographic findings are summarized in Table 2.
Table 1. Baseline characteristics
Parameters Coronary artery salcium score (No. of patients)
0 (n = 27) 1-100 (n = 58) 101-400 (n = 51) > 400 (n = 36) P
Age (yr) 55 ± 11 60 ± 10 65 ± 10 66 ± 7 < 0.001
Male gender (%) 15 (56%) 41 (71%) 29 (57%) 20 (56%) 0.328
Clinical presentation (%)
Non-ST segment elevation myocardial infarction Stable angina pectoris
Unstable angina pectoris
0 (0%) 7 (26%) 20 (74%)
2 (3%) 19 (33%) 37 (64%)
1 (2%) 23 (45%) 27 (53%)
0 (0%) 14 (39%) 22 (61%)
0.475
Diabetes mellitus (%) 2 (7%) 13 (22%) 15 (29%) 11 (31%) 0.119
Hypertension (%) 13 (48%) 27 (47%) 32 (63%) 29 (81%) 0.007
Dyslipidemia (%) 10 (37%) 29 (50%) 21 (41%) 20 (56%) 0.388
Smoker (%) 12 (44%) 27 (47%) 19 (37%) 12 (33%) 0.564
Family history of coronary artery disease (%) 1 (4%) 3 (5%) 0 (0%) 1 (3%) 0.450
Ejection fraction (%) 69 ± 6 67 ± 6 65 ± 6 65 ± 7 0.049
White blood cells (103/µL) 7.8 ± 2.5 7.4 ± 1.9 7.5 ± 2.2 6.9 ± 2.5 0.440
Neutrophil (103/µL) 3.8 ± 1.3 3.5 ± 1.0 3.9 ± 1.5 3.1 ± 1.0 0.015
Hemoglobin (g/dL) 13.8 ± 1.4 13.7 ± 1.6 13.2 ± 1.5 12.9 ± 1.5 0.030
Platelet count (103/µL) 251 ± 54 220 ± 45 231 ± 57 221 ± 54 0.059
Glucose (mg/dL) 122 ± 34 123 ± 27 137 ± 45 137 ± 38 0.101
Creatine kinase-MB (U/dL) 4.3 ± 1.7 5.6 ± 4.3 6.7 ± 10.2 12.0 ± 43.8 0.429
Troponin-I (ng/mL) 0.04 ± 0.68 0.56 ± 1.70 0.61 ± 3.44 0.15 ± 0.78 0.564
Creatinine (mg/dL) 0.8 ± 0.2 0.9 ± 0.2 0.8 ± 0.2 0.9 ± 0.2 0.200
Fibrinogen (mg/dL) 267 ± 77 268 ± 76 283 ± 58 277 ± 76 0.673
hs-CRP (mg/dL) 0.60 ± 1.59 0.21 ± 0.43 0.33 ± 0.92 0.28 ± 0.73 0.314
NT-pro-BNP (pg/mL) 88 ± 86 129 ± 199 165 ± 223 171 ± 424 0.553
Total cholesterol (mg/dL) 181 ± 44 194 ± 38 186 ± 41 186 ± 43 0.509
Triglyceride (mg/dL) 102 ± 83 130 ± 83 114 ± 79 131 ± 109 0.429
LDL cholesterol (mg/dL) 117 ± 41 128 ± 31 120 ± 35 122 ± 35 0.513
HDL cholesterol (mg/dL) 51 ± 12 46 ± 8 49 ± 13 44 ± 8 0.033
Apoprotein A1 (mg/dL) 130 ± 18 129 ± 20 128 ± 23 127 ± 22 0.932
Apoprotein B (mg/dL) 91 ± 29 98 ± 21 92 ± 23 99 ± 33 0.454
Apoprotein B/A1 0.70 ± 0.25 0.77 ± 0.21 0.74 ± 0.24 0.78 ± 0.25 0.533
Lipoprotein (a) (mg/dL) 26 ± 25 24 ± 24 27 ± 23 26 ± 20 0.914
Data are presented as the No. (%) of patients or mean ± SD. hs-CRP, high-sensitivity C-reactive protein; NT-pro-BNP, N-terminal pro-B type natriuretic peptide; LDL, low-den- sity lipoprotein; HDL, high-density lipoprotein.
There were no significant differences in the target vessel, lesion location, and QCA data among four groups.
Grey-scale and VH-IVUS findings
Grey-scale IVUS findings are summarized in Table 3. At the prox- imal reference, plaque burden was greatest in Group IV. At the
distal reference, lumen cross-sectional area was smallest and plaque burden was greatest in Group IV. At the minimum lumen site, lumen cross-sectional area was smallest and plaque burden was tended to be greatest, and IVUS lesion was longest in Group IV. At the largest necrotic core site, plaque plus media cross-sec- tional area was greatest in Group IV. The calcium arc was great- Table 2. Coronary angiographic findings
Parameters Coronary artery calcium score (No. of lesions)
0 (n = 52) 1-100 (n = 99) 101-400 (n = 84) > 400 (n = 15) P
Target coronary artery (%) Left main
Left anterior descending Left circumflex Right
5 (10%) 27 (52%) 7 (13%) 13 (25%)
7 (7%) 62 (63%) 17 (17%) 13 (13%)
12 (14%) 55 (65%) 9 (11%) 8 (10%)
0 (0%) 10 (67%) 2 (13%) 3 (20%)
0.204
Lesion location (%) Proximal Middle Distal
30 (58%) 15 (29%) 7 (13%)
50 (51%) 38 (38%) 11 (11%)
45 (54%) 29 (34%) 10 (12%)
8 (53%) 5 (33%) 2 (13%)
0.965
Reference diameter (mm) 3.45 ± 0.58 3.23 ± 0.44 3.27 ± 0.47 3.29 ± 0.55 0.076
MLD (mm) 1.22 ± 0.63 1.06 ± 0.48 1.15 ± 0.51 0.90 ± 0.33 0.101
Percent diameter stenosis (%) 65 ± 16 67 ± 13 65 ± 13 73 ± 7 0.140
Data are presented as the No. (%) of patients or mean ± SD. MLD, minimal luminal diameter.
Table 3. Grey-scale intravascular ultrasound findings
Parameters Coronary artery calcium score (No. of lesions)
0 (n = 52) 1-100 (n = 99) 101-400 (n = 84) > 400 (n = 15) P
Proximal reference EEM CSA (mm2) Lumen CSA (mm2) P&M CSA (mm2) Plaque burden (%)
19.0 ± 5.3 11.9 ± 3.6 7.1 ± 2.5 37 ± 7
17.9 ± 5.9 10.5 ± 3.3 7.5 ± 3.2 41 ± 7
20.4 ± 5.8 11.7 ± 3.6 8.7 ± 3.1 42 ± 7
19.3 ± 4.5 10.8 ± 2.4 8.4 ± 2.2 44 ± 3
0.052 0.035 0.012
< 0.001 Distal reference
EEM CSA (mm2) Lumen CSA (mm2) P&M CSA (mm2) Plaque burden (%)
15.1 ± 5.3 9.6 ± 3.6 5.4 ± 2.6 36 ± 7
12.9 ± 5.0 8.1 ± 2.9 4.8 ± 2.5 36 ± 6
14.9 ± 6.6 8.9 ± 3.5 6.0 ± 3.6 39 ± 8
13.1 ± 5.6 7.5 ± 3.1 5.5 ± 2.9 41 ± 9
0.059 0.029 0.056 0.027 MLA site
EEM CSA (mm2) Lumen CSA (mm2) P&M CSA (mm2) Plaque burden (%)
16.2 ± 4.9 5.8 ± 3.5 10.3 ± 4.1 64 ± 14
14.0 ± 4.9 4.5 ± 2.1 9.4 ± 3.7 67 ± 8
16.3 ± 6.5 5.5 ± 3.0 10.8 ± 4.2 66 ± 11
15.1 ± 4.6 4.0 ± 0.9 11.1 ± 4.2 72 ± 6
0.018 0.005 0.107 0.055 Largest NC site
EEM CSA (mm2) Lumen CSA (mm2) P&M CSA (mm2) Plaque burden (%)
17.5 ± 5.1 7.0 ± 4.1 10.5 ± 3.6 61 ± 15
15.9 ± 5.5 5.6 ± 2.6 10.2 ± 3.9 64 ± 11
18.9 ± 6.2 7.1 ± 3.4 11.8 ± 3.8 63 ± 9
18.7 ± 5.0 5.8 ± 2.3 12.9 ± 3.8 69 ± 7
0.004 0.009 0.007 0.093
IVUS lesion length (mm) 18 ± 14 22 ± 12 23 ± 16 34 ± 18 0.002
Calcium arc (°) 10.6 ± 20.1 68.8 ± 36.9 140.5 ± 50.1 227.1 ± 39.8 < 0.001
Calcium length (mm) 0.4 ± 0.7 2.4 ± 1.4 5.0 ± 1.7 7.4 ± 2.3 < 0.001
Calcium location (%) Superficial Deep Mixed
6 (12) 5 (10) 1 (2)
58 (59) 22 (22) 12 (12)
55 (66) 7 (8) 22 (26)
12 (80) 0 (0) 3 (20)
< 0.001
Volumetric analysis EEM volume (µL) Lumen volume (µL) TAV (µL) PAV (%)
289 ± 226 137 ± 105 152 ± 132 50.5 ± 10.1
310 ± 201 139 ± 96 171 ± 114
54.2 ± 7.4
356 ± 256 161 ± 111 195 ± 149 53.9 ± 5.9
531 ± 290 211 ± 113 321 ± 182 60.0 ± 5.3
0.003 0.052
< 0.001
< 0.001 Data are presented as the No. (%) of patients or mean ± SD. EEM, external elastic membrane; CSA, cross-sectional area; P&M, plaque plus media; MLA, minimum lumen area;
NC, necrotic core; IVUS, intravascular ultrasound; TAV, total atheroma volume; PAV, percent atheroma volume.
est and calcium length was longest in Group IV and most of the calcium was observed at superficial location in Group IV. By vol- umetric analysis, external elastic membrane volume and total atheroma volume and percent atheroma volume were greatest in Group IV.
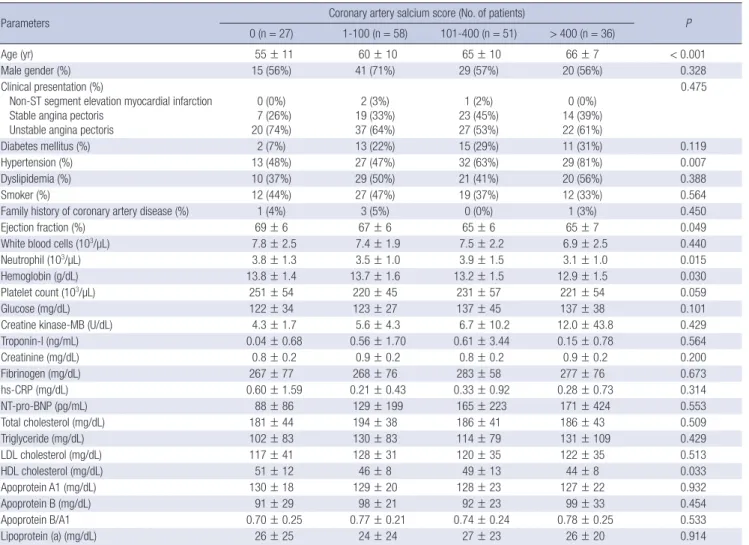
VH-IVUS findings are summarized in Table 4. At the proximal reference, absolute dense calcium and necrotic core areas were greatest in Group IV. At the distal reference, absolute dense cal- cium and necrotic core areas were greater in Group III and IV than Group I and II. At the minimum lumen area site, absolute dense calcium area was greatest in Group IV (Fig. 2A). At the largest necrotic core site, absolute dense calcium and necrotic core areas were greatest in Group IV. At the proximal reference, relative dense calcium and necrotic core areas were greatest in Group IV. At the minimum lumen area site, relative dense calci- um area was greatest, and in contrast relative fibrous area was smallest in Group IV (Fig. 2B). At the largest necrotic core site, relative dense calcium area was greatest, and in contrast relative fibrous area was smallest in Group IV. By volumetric analysis, absolute fibrous and fibro-fatty and dense calcium and necrotic
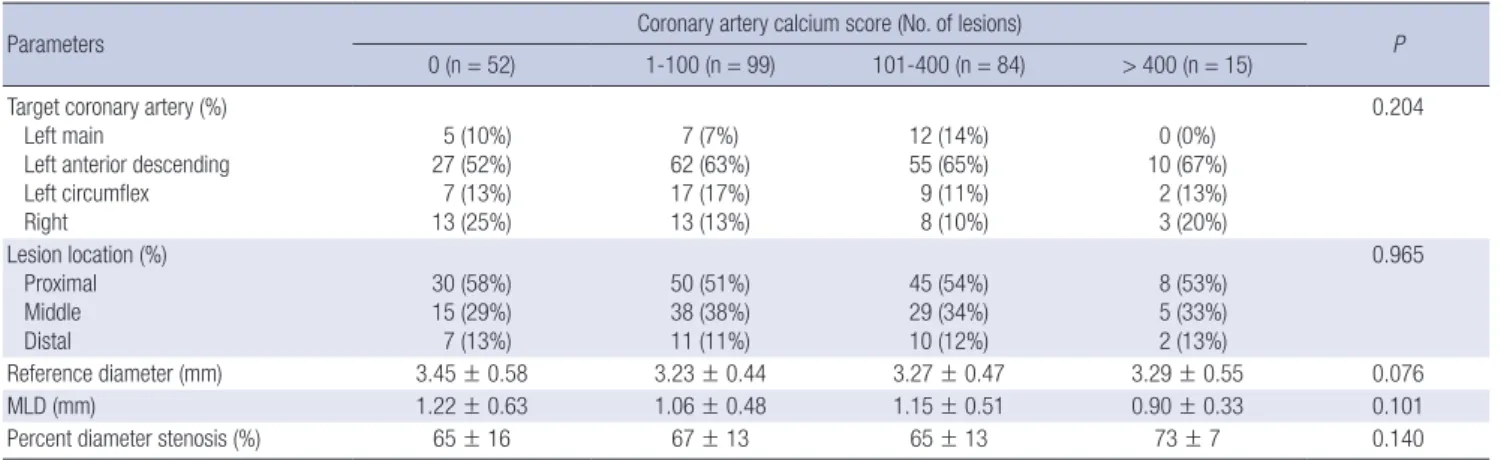
core volumes were greatest in Group IV (Fig. 3A). Relative dense calcium and necrotic core volumes were greatest, and in con- trast relative fibrous volume was smallest in Group IV (Fig. 3B).
Also thin-cap fibroatheromas were observed more frequently in Group IV (10% vs 12% vs 8% vs 33%, P = 0.046, respectively).
Correlations between VH-IVUS parameters and CACS The absolute plaque and dense calcium and necrotic core vol- umes and the relative dense calcium volume correlated positive- ly with CACS (r = 0.470, P < 0.001, r = 0.318, P < 0.001, r = 0.313, P < 0.001, respectively), in contrast the relative fibrous volume correlated negatively with CACS (r = -0.328, P < 0.001).
DISCUSSION
The present study demonstrated that 1) CAD patients with high CACS was oldest, and hypertension was observed most frequent- ly, and had the lowest high-density lipoprotein-cholesterol lev- el; 2) the absolute and relative dense calcium area were great- est, and in contrast relative fibrous area was smallest at the min- Table 4. Virtual histology intravascular ultrasound findings
Parameters Coronary artery calcium score (No. of lesions)
0 (n = 52) 1-100 (n = 99) 101-400 (n = 84) > 400 (n = 15) P
Absolute plaque components Proximal reference (mm2) FT area
FF area DC area NC area
1.88 ± 1.47 0.43 ± 0.45 0.16 ± 0.20 0.37 ± 0.49
2.25 ± 1.86 0.48 ± 0.57 0.34 ± 0.42 0.51 ± 0.52
2.75 ± 1.64 0.69 ± 0.73 0.41 ± 0.47 0.70 ± 0.70
2.54 ± 1.50 0.32 ± 0.21 0.71 ± 0.47 0.73 ± 0.31
0.036 0.027
< 0.001 0.009 Distal reference (mm2)
FT area FF area DC area NC area
1.01 ± 1.37 0.24 ± 0.34 0.10 ± 0.29 0.21 ± 0.48
0.89 ± 1.22 0.21 ± 0.45 0.11 ± 0.26 0.16 ± 0.32
1.48 ± 1.88 0.38 ± 0.67 0.23 ± 0.35 0.37 ± 0.50
1.32 ± 1.39 0.42 ± 0.60 0.22 ± 0.36 0.29 ± 0.54
0.064 0.116 0.025 0.011 Largest NC site (mm2)
FT area FF area DC area NC area
4.10 ± 2.34 0.61 ± 0.61 0.52 ± 0.42 1.69 ± 1.38
3.56 ± 2.14 0.59 ± 0.72 0.91 ± 0.62 1.86 ± 1.21
4.33 ± 5.60 0.77 ± 0.88 1.34 ± 0.74 2.24 ± 0.96
4.29 ± 2.69 0.77 ± 0.63 1.83 ± 0.91 2.45 ± 0.71
0.537 0.373
< 0.001 0.012 Relative plaque components
Proximal reference (%) FT area
FF area DC area NC area
64.2 ± 16.3 16.4 ± 12.1 5.1 ± 6.4 10.1 ± 8.3
60.8 ± 19.3 12.2 ± 10.6 8.3 ± 8.5 13.4 ± 9.7
61.0 ± 15.2 15.0 ± 10.9 7.7 ± 7.0 13.7 ± 10.2
56.1 ± 13.6 7.7 ± 4.5 17.8 ± 11.4
18.3 ± 6.6
0.435 0.021
< 0.001 0.026 Distal reference (%)
FT area FF area DC area NC area
58.9 ± 26.2 14.8 ± 15.4 4.1 ± 6.3 8.6 ± 9.0
54.2 ± 30.9 12.0 ± 12.3 4.2 ± 7.2 7.9 ± 8.9
50.7 ± 28.1 12.8 ± 14.8 6.8 ± 10.2 11.5 ± 11.7
48.9 ± 31.0 13.9 ± 10.7 6.9 ± 8.1 7.2 ± 9.2
0.399 0.691 0.100 0.091 Largest necrotic core site (%)
FT area FF area DC area NC area
58.8 ± 12.2
9.4 ± 8.7 8.4 ± 6.8 23.4 ± 13.1
50.8 ± 13.3 7.8 ± 8.6 14.3 ± 8.9 27.1 ± 11.3
45.5 ± 11.4 8.4 ± 7.7 17.1 ± 8.7 28.9 ± 10.0
43.3 ± 12.5 7.9 ± 5.5 20.9 ± 9.9 27.7 ± 7.2
< 0.001 0.712
< 0.001 0.051
Thin-cap fibroatheroma (%) 5 (10) 12 (12) 7 (8) 5 (33) 0.046
Data are presented as the No. (%) of patients or mean ± SD. EEM, external elastic membrane; CSA, cross-sectional area; P&M, plaque plus media; MLA, minimum lumen area;
FT, fibrous; FF, fibro-fatty; DC, dense calcium; NC, necrotic core.
imum lumen area site in patients with highest CACS; 3) the ab- solute fibrous and fibro-fatty and dense calcium and necrotic core volumes were greatest, and relative dense calcium and ne- crotic core volumes were greatest, and in contrast relative fibrous volume was smallest in patients with highest CACS; 4) the abso- lute plaque and dense calcium and necrotic core volumes and the relative dense calcium volume positively correlated with cal- cium scores, in contrast the relative fibrous volume negatively correlated with CACS.
CACS can be quantified using MDCT and calcification scores can be related to the extent and severity of atherosclerotic dis- ease and can improve the prediction of CAD risk. Several stud- ies demonstrated relations between the coronary calcification and the severity of coronary artery disease and clinical events.
Ho et al. (17) reported that as CACS increased, there was a cor- responding increase in frequency of MDCT obstructive disease and a CACS > 400 was associated with increased risk of signifi- cantly obstructive stenosis. Also this study has shown that in- creasing age, male gender, and the presence of hypertension and hyperlipidemia are significantly associated with higher CACS.
Church et al. (18) reported that CACS can identify individuals at increased risk for coronary heart disease events who otherwise would be considered low-risk based on clinical assessment and CACS of zero is associated with very low risk for coronary heart
mm2%
FT FF DC NC
FT FF DC NC
6
5
4
3
2
1
0
80 70 60 50 40 30 20 10 0
4.35
62.7 3.73
58.4 P = 0.392
P < 0.001
P = 0.132
P = 0.153
P < 0.001
P < 0.001
P = 0.122
P = 0.091 3.72
49.8 4.15
48.9
0.86
13 0.66
9.3 1.02
11.6 0.86
9.5
0.41
6.4 0.65
11.1 1.05
15.6 1.17
18.4
1.3
17.9 1.3
21.1 1.62
23 1.66
23.1
Group I Group II Group III Group IV
Group I Group II Group III Group IV
A
B Fig. 2. Absolute (A) and relative (B) plaque components at the minimum lumen area sites. Absolute dense calcium and relative dense calcium (%) areas were greatest in Group IV; in contrast, relative fibrous (%) area was smallest in Group IV.
disease in the short to intermediate term regardless of the num- ber of risk factors present.
Previous IVUS studies have shown that CACS was associated with plaque burden and morphology. Nicholls et al. (19) report- ed that high calcium index patients had a greater atheroma vol- ume. In the present study, total atheroma volume and percent atheroma volume were greatest in CAD patients with highest CACS. Okabe et al. (20) reported that mean plaque burden, cal- cified length, and arc of calcium increased significantly, while minimum lumen area decreased with increasing CACS. Also multivariate analysis showed a calcified length and an arc of cal- cium were significant predictors for CACS. In the present study, calcium-arc was greatest and calcium length was longest in CAD patients with highest CACS.
Vulnerable plaque in coronary artery can progress to plaque rupture and thrombosis, and have a strong potential to induce acute coronary syndrome. Also inflammation and necrotic core size play a greater role in the progression of atherosclerosis in diabetic subjects in sudden coronary death (21). In the present study, dense calcium and necrotic core components were great- est in lesions with highest calcium score compared to those with lower calcium score. Some investigators believe that calcium sta- bilizes the plaque, while others believe that it increases the shear stress and hence the risk of rupture. Almost all patients with re-
µL%
FT FF DC NC
FT FF DC NC
120
100
80
60
40
20
0
80 70 60 50 40 30 20 10 0
55.9
64.9 58.2
59 P = 0.043
P < 0.001
P = 0.002
P = 0.247
P < 0.001
P < 0.001
P < 0.001
P = 0.010 63.6
53.4 102.2
48.9
10.1
13.6 10.8
11 14.3
12.6 25.5
10.6
5.5
6.4 11
11 15.6
14 36.6
20
14.8
15.2 19.5
19.1 22.5
20.2 41.7
20.7
Group I Group II Group III Group IV
Group I Group II Group III Group IV
A
B Fig. 3. Absolute (A) and relative (B) plaque components by volumetric analysis. Absolute and relative dense calcium (%) and necrotic core (%) volumes were greatest in Group IV; in contrast, relative fibrous (%) volume was smallest in Group IV.
cent acute coronary syndromes have measurable coronary cal- cium because of pre-existing moderate-to-advanced coronary artery disease. In these same individuals, flow-obstructing cor- onary lesions are not necessarily linked to calcium (22). How- ever, several studies indicate that extensive coronary calcium by CT is related to increased incidences of myocardial infarction, obstructive coronary disease and death (23-25). Also our obser- vations indicate that with increasing CACS the likelihood of thin- cap fibroatheroma also increases.
Few data are available about the relation between coronary calcium score and plaque components. Fujii et al. (26) reported that ruptured plaques are associated with a larger number of calcium deposits within an arc of < 90°, and Ehara et al. (27) re- ported that IVUS allows the identification of vulnerable plaques in coronary arteries, not only by identifying a fibro-fatty plaque and positive remodeling, but also by identifying a spotty pattern of calcification. Also this study has shown that the length of cal- cium deposits detected by IVUS within the culprit lesion seg- ment was found to be positively correlated with the largest arc.
Harada et al. (28) reported that MDCT is a promising approach for noninvasive detection of different types of coronary plaque and may therefore contribute to coronary risk stratification. How- ever, the ability of MDCT to determine the volume of individual plaque components is limited. Moreover the edge of a calcified
plaque appears to have a lower density than the internal region on MDCT. As a result of these effects, MDCT is prone to overes- timate the volume of both low attenuated and calcified plaque.
On the other hand, Carrascosa et al. (29) reported that MDCT can provide important information concerning the composition of atherosclerotic plaques in addition to detecting luminal ob- struction. Galonska et al. (30) reported that coronary atheroscle- rotic plaques can be reliably identified and classified as either calcified or non-calcified by 16-slice MDCT in postmortem stud- ies and might not be too far from being able to detect vulnera- ble plaques with CT technology. The result of the present study shows the association between CACS and vulnerable plaque components in patients with CAD. Therefore, cardiac MDCT can be used as a useful tool to detect not only significant athero- sclerosis but also vulnerable plaque components non-invasive- ly in patients with CAD.
There are several limitations to be mentioned. First, the pres- ent study was a retrospective single center study, so was subject- ed to limitations inherent in this type of clinical investigation.
Second, IVUS and VH-IVUS imaging were performed at the dis- cretion of the individual operators leading to potential selection bias. Third, there was a limitation using 20 MHz IVUS because this low frequency IVUS has a limitation to detect the plaque in detail, especially in the near field. Fourth, heavily calcified
plaques may have induced an artifact regarding the codification of plaques by VH-IVUS resulting in an increase in necrotic core content.
In conclusion, it is suggested that CAD patients with high cal- cium score have more vulnerable plaque components (greater dense calcium and necrotic core-containing plaques) than those with low calcium score.
REFERENCES
1. Javadrashid R, Salehi A, Tarzamni MK, Aslanabadi N, Pak N. Diagnostic efficacy of coronary calcium score in the assessment of significant coro- nary artery stenosis. Kardiol Pol 2010; 68: 285-91.
2. Kitamura A, Kobayashi T, Ueda K, Okada T, Awata N, Sato S, Shimamoto T. Evaluation of coronary artery calcification by multi-detector row com- puted tomography for the detection of coronary artery stenosis in Japa- nese patients. J Epidemiol 2005; 15: 187-93.
3. Shaw LJ, Raggi P, Schisterman E, Berman DS, Callister TQ. Prognostic value of cardiac risk factors and coronary artery calcium screening for all-cause mortality. Radiology 2003; 228: 826-33.
4. Thompson GR, Partridge J. Coronary calcification score: the coronary- risk impact factor. Lancet 2004; 363: 557-9.
5. Mitsutake R, Niimura H, Miura S, Zhang B, Iwata A, Nishikawa H, Kawamura A, Kumagai K, Shirai K, Matsunaga A, Saku K. Clinical sig- nificance of the coronary calcification score by multidetector row com- puted tomography for the evaluation of coronary stenosis in Japanese patients. Circ J 2006; 70: 1122-7.
6. LaMonte MJ, FitzGerald SJ, Church TS, Barlow CE, Radford NB, Levine BD, Pippin JJ, Gibbons LW, Blair SN, Nichamar MZ. Coronary artery calcium score and coronary heart disease events in an large cohort of as- ymptomatic men and women. Am J Epidemiol 2005; 162: 421-9.
7. Detrano R, Guerci AD, Carr JJ, Bild DE, Burke G, Folsom AR, Liu K, Shea S, Szklo M, Bluemke DA, O’Leary DH, Tracy R, Watson K, Wong ND, Kronmal RA. Coronary calcium as a predictor of coronary events in four racial or ethnic groups. N Engl J Med 2008; 358: 1336-45.
8. Wong ND, Hsu JC, Detrano RC, Diamond G, Eisenberg H, Gardin JM.
Coronary artery calcium evaluation by electron beam computed tomog- raphy and its relation to new cardiovascular events. Am J Cardiol 2000;
86: 495-8.
9. Baumgart D, Schmermund A, Goerge G, Haude M, Ge J, Adamzik M, Sehnert C, Altmaier K, Groenemeyer D, Seibel R, Erbel R. Comparison of electron beam computed tomography with intracoronary ultrasound and coronary angiography for detection of coronary atherosclerosis. J Am Coll Cardiol 1997; 30: 57-64.
10. Funabashi N, Misumi K, Ohnishi H, Asano M, Komuro I. Characteriza- tion and morphology of atherosclerotic plaque of coronary arteries: util- ity of electron-beam tomography to detect non-calcified plaque: a compar- ison with conventional coronary angiography and intravascular ultra- sound. Int J Cardiol 2007; 115: 108-13.
11. Henneman MM, Schuijf JD, Pundziute G, van Werkhoven JM, van der Wall EE, Jukema JW, Bax JJ. Non-invasive evaluation with multislice com- puted tomography in suspected acute coronary syndrome: plaque mor- phology on multislice computed tomography versus coronary calcium score. J Am Coll Cardiol 2008; 52: 216-22.
12. Roberts WL, Moulton L, Law TC, Farrow G, Cooper-Anderson M, Savory J, Rifai N. Evaluation of nine automated high-sensitivity C-reactive pro- tein methods: implications for clinical and epidemiological applications.
Part 2. Clin Chem 2001; 47: 418-25.
13. Reiber JH, van der Zwet PM, Koning G, von Land CD, van Meurs B, Ger- brands JJ, Buis B, van Voorthuisen AE. Accuracy and precision of quan- titative digital coronary arteriography: observer-, short-, and medium- term variabilities. Cathet Cardiovasc Diagn 1993; 28: 187-98.
14. Agatston AS, Janowitz WR, Hildner FJ, Zusmer NR, Viamonte M Jr, De- trano R. Quantification of coronary artery calcium using ultrafast com- puted tomography. J Am Coll Cardiol 1990; 15: 827-32.
15. Mintz GS, Nissen SE, Anderson WD, Bailey SR, Erbel R, Fitzgerald PJ, Pinto FJ, Rosenfield K, Siegel RJ, Tuzcu EM, Yock PG. American College of Cardiology Clinical Expert Consensus Document on Standards for Ac- quisition, Measurement and Reporting of Intravascular Ultrasound Stud- ies (IVUS). A report of the American College of Cardiology Task Force on Clinical Expert Consensus Documents. J Am Coll Cardiol 2001; 37: 1478-92.
16. Nair A, Kuban BD, Tuzcu EM, Schoenhagen P, Nissen SE, Vince DG. Cor- onary plaque classification with intravascular ultrasound radiofrequen- cy data analysis. Circulation 2002; 106: 2200-6.
17. Ho JS, Fitzgerald SJ, Stolfus LL, Wade WA, Reinhardt DB, Barlow CE, Can- naday JJ. Relation of a coronary artery calcium score higher than 400 to coronary stenoses detected using multidetector computed tomography and to traditional cardiovascular risk factors. Am J Cardiol 2008; 101: 1444-7.
18. Church TS, Levine BD, McGuire DK, Lamonte MJ, Fitzgerald SJ, Cheng YJ, Kimball TE, Blair SN, Gibbons LW, Nichaman MZ. Coronary artery calcium score, risk factors, and incident coronary heart disease events.
Atherosclerosis 2007; 190: 224-31.
19. Nicholls SJ, Tuzcu EM, Wolski K, Sipahi I, Schoenhagen P, Crowe T, Ka- padia SR, Hazen SL, Nissen SE. Coronary artery calcification and chang- es in atheroma burden in response to established medical therapies. J Am Coll Cardiol 2007; 49: 263-70.
20. Okabe T, Mintz GS, Weigold WG, Roswell R, Joshi S, Lee SY, Lee B, Stein- berg DH, Roy P, Slottow TL, Kaneshige K, Torguson R, Xue Z, Satler LF, Kent KM, Pichard AD, Weissman NJ, Lindsay J, Waksman R. The predic- tive value of computed tomography calcium scores: a comparison with quantitative volumetric intravascular ultrasound. Cardiovasc Revasc Med 2009; 10: 30-5.
21. Burke AP, Kolodgie FD, Zieske A, Fowler DR, Weber DK, Varghese PJ, Farb A, Virmani R. Morphologic findings of coronary atherosclerotic plaques in diabetics: a postmortem study. Arterioscler Thromb Vasc Biol 2004; 24:
1266-71.
22. Schmermund A, Erbel R. Unstable coronary plaque and its relation to coronary calcium. Circulation 2001; 104: 1682-7.
23. Pitt B, Rubenfire M. Risk stratification for the detection of preclinical cor- onary artery disease. Circulation 1999; 99: 2610-2.
24. Raggi P, Callister TQ, Cooil B, He ZX, Lippolis NJ, Russo DJ, Zelinger A, Mahmarian JJ. Identification of patients at increased risk of first unher- alded acute myocardial infarction by electron-beam computed tomog- raphy. Circulation 2000; 101: 850-5.
25. Arad Y, Spadaro LA, Goodman K, Newstein D, Guerci AD. Prediction of coronary events with electron beam computed tomography. J Am Coll Cardiol 2000; 36: 1253-60.
26. Fujii K, Carlier SG, Mintz GS, Takebayashi H, Yasuda T, Costa RA, Mous- sa I, Dangas G, Mehran R, Lansky AJ, Kreps EM, Collins M, Stone GW,
Moses JW, Leon MB. Intravascular ultrasound study of patterns of cal- cium in ruptured coronary plaques. Am J Cardiol 2005; 96: 352-7.
27. Ehara S, Kobayashi Y, Kataoka T, Yoshiyama M, Ueda M, Yoshikawa J.
Quantification of coronary calcification by intravascular ultrasound. Circ J 2007; 71: 530-5.
28. Harada K, Amano T, Uetani T, Funahashi H, Arai K, Okada K, Hirashiki A, Hayashi M, Oshima S, Ishii H, Izawa H, Matsubara T, Murohara T. Ac- curacy of 64-slice multidetector computed tomography for classification and quantitation of coronary plaque: comparison with integrated back-
scatter intravascular ultrasound. Int J Cardiol 2011; 149: 95-101.
29. Carrascosa PM, Capuñay CM, Garcia-Merletti P, Carrascosa J, Garcia MF. Characterization of coronary atherosclerotic plaques by multidetec- tor computed tomography. Am J Cardiol 2006; 97: 598-602.
30. Galonska M, Ducke F, Kertesz-Zborilova T, Meyer R, Guski H, Knollmann FD. Characterization of atherosclerotic plaques in human coronary ar- teries with 16-slice multidetector row computed tomography by analysis of attenuation profiles. Acad Radiol 2008; 15: 222-30.
AUTHOR SUMMARY
Relationship between Coronary Artery Calcium Score by Multidetector Computed Tomography and Plaque Components by Virtual Histology Intravascular Ultrasound
Yun Ha Choi, Young Joon Hong, In Hyae Park, Myung Ho Jeong, Khurshid Ahmed, Seung Hwan Hwang, Min Goo Lee, Keun-Ho Park, Doo Sun Sim, Ju Han Kim, Youngkeun Ahn, Jeong Gwan Cho, Jong Chun Park and Jung Chaee Kang
The aim of this study was to evaluate the relationship between coronary artery calcium score (CACS) assessed by multidetector computed tomography (MDCT) and plaque components assessed by virtual histology-intravascular ultrasound in 172 coronary artery disease (CAD) patients with 250 coronary lesions. CACS was assessed according to Agatston scoring method by MDCT and patients were divided into four groups. Total atheroma volume was greatest in the group with highest calcium score. The absolute dense calcium (DC) and necrotic core (NC) volumes were greatest, and relative DC volume was greatest in the group with highest calcium score. In conclusion, CAD patients with high calcium score have more vulnerable plaque components than those with low calcium score.