Molecular Dynamics Simulation of Cluster-Seed Affects on Heterogeneous Nucleation
Donguk Suh†, Seung-chai Jung*, and Woong-sup Yoon**
분자동력학을 이용한 클러스터핵 주변의 이종핵형성 모사
서동욱
†· 정승채
*· 윤웅섭
**Key Words : Heterogeneous Nucleation (이종핵형성), Molecular Dynamics (분자동력학), Abstract
3-D heterogeneous nucleation was simulated by classical molecular dynamics (MD), where the Lennard- Jones (LJ) gas and solid cluster-seed molecules have argon and aluminum properties, respectively. There are three shapes of cluster-seeds, cube, rod, and sphere, and three classes of masses and the simulation took place under nine supersaturation ratios, making a total of 81 calculations. Results show that the dimension of the cluster-seed highly affects the rates of cluster development. In order to analyze heterogeneous nucleation above and below the critical supersaturation ratio, growth rate and liquefaction rate were separately defined to supplement the investigation. Design of experiments (DOE) was used for analysis which displayed that the shape and mass of the cluster-seed are prominent for the growth rate, while the supersaturation ratio is most significant followed by the mass for liquefaction rate. The significance of the supersaturation ratio for overall liquefaction suggests that thermal diffusion is more dominant than mass interactions for this system.
1. Introduction
There are numerous examples of heterogeneous nucleation such as forming of aerosols to cloud physics, cosmology, industrial applications, and generating new materials [1-5]. One of the main focuses is on the rate of which the phenomenon occurs. However, the discrepancy between the classical nucleation theory (CNT) and experimental results have been well documented [6-7]. CNT considering only monomer interactions is one of the causes for the inconsistency, but more paramount is that the theory is based on
macroscopic thermodynamic properties for a microscopic phenomenon [8]. On account of the deterministic and microscopic nature, many researchers have found molecular dynamics (MD) to be an ideal tool to simulate nucleation. Nevertheless, most of the research on heterogeneous nucleation by MD has been on supersaturated vapor condensing on 2-D solid surfaces. Yasuoka et al. simulated nucleation in a slit pore where the wall had no structure, to find the rate to be higher than in equivalent homogeneous conditions [9].
Kholmurodov et al. used the same thermodynamic conditions and system configurations except for the wall having atomic structure as Yasuoka et al. and concluded that an atomic wall shows a higher nucleation rate than a structureless wall by an order of one [10]. Kimura and Maruyama performed heterogeneous nucleation of metastable argon vapor onto a temperature controlled solid surface and observed the simulation results to agree
†
Ph.D candidate, Mech. Eng. Dept. Yonsei Univ.E-mail : [email protected]
TEL : (02)2123-4812 FAX : (02)312-2159 * Ph.D candidate, Mech. Eng. Dept. Yonsei Univ.
** Professor, Mech. Eng. Dept. Yonsei Univ.
대한기계학회 2008년도 추계학술대회 논문집
with CNT at lower cooling rates [11]. Toxvaerd conducted a similar simulation as Kimura and Maruyama, but employed ensemble averages and found that at high attractions for the wall the contact angle decreases [12].
Finally, Rozas and Kraska simulated nucleation on a polyethylene surface to investigate wettable systems. The growth of layers showed a gradual progression from
“layer-by-layer growth to island-on-layer” [13].
In this study, an isothermal heterogeneous nucleation simulation is performed by MD, but the difference between previous studies is that a metal cluster-seed is placed inside a supersaturated vapor instead of a surface.
Moreover, the affects of the dimensions of the cluster- seed will be examined as well.
In the studies of nucleation on surfaces, the nucleation rate was calculated by finding the slope of the increase in number of nuclei on the surface per time as in homogeneous nucleation [14]. However, in the cases of nucleation at supersaturation ratios (S) lower than the critical S, growth only occurs on the seed, which is completely wetted. Therefore, a model precisely constructed to calculate 3-D heterogeneous nucleation proposed by Fletcher was implemented to calculate the rate [15].
S=ρ/ρeq (1)
Here ρ and ρeq is each the number density of the supersaturated gas of the system, and the number density of gas at equilibrium [14, 16]. Critical S is the minimum value of S where homogeneous nucleation first occurs.
Analysis on nucleation was conducted on several S, seed shapes, and dimensions. The effects of each factor were examined by Design of Experiments (DOE) [18].
Since below the critical supersaturation ratio, nucleation occurs solely at a single site, the conventional nucleation rate loses its significance to represent the extent of liquefaction. New rates were newly defined to carry out the study.
2. Simulation Setup
Classical molecular dynamics was used for all simulations. The Lennard-Jones 12-6 potential was used and the time integration was performed by the leap-frog version of the Verlet algorithm. The time step was 10fs throughout the entire simulation and a cutoff radius of
4.5σ was used to widely incorporate attractive forces.
Linked-cells were used to speed up the calculation [19].
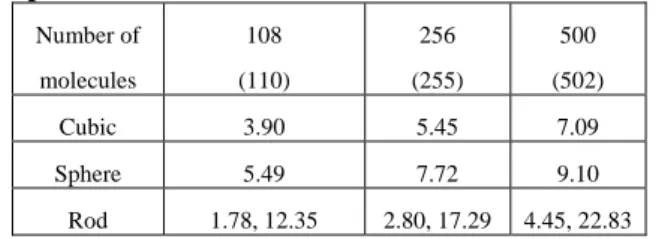
Table 1. Dimensions, number of molecules, and shapes of cluster-seeds.
Number of molecules
108 (110)
256 (255)
500 (502)
Cubic 3.90 5.45 7.09 Sphere 5.49 7.72 9.10
Rod 1.78, 12.35 2.80, 17.29 4.45, 22.83
10,000 soft core carrier, 11,952 target, and a number of seed molecules based on table 1 were placed inside a cubic system at an initial density of 100.0 kg/m3, so the system size varies with the total number of molecules.
Periodic boundary conditions were employed for all dimensions. All molecules are LJ particles, where soft core and target atoms have argon properties, the seed molecules are aluminum. Equations 8 and 9 show their interactions where the subscript t, c, and s, each denote target, carrier, and seed.
( )
r 4[ ( /r) (
12 /r)
6]
tt ε σ σ
φ = − (2)
( )
r tc( )
r sc( )
r 4(
/r)
12cc φ φ ε σ
φ = = = (3)
where r is the distance between two atoms, σ is the molecular length 3.405 Å for argon 2.551 Å for aluminum, and ε is the energy 1.67x10⁻²¹J for the former and 0.65 x10⁻¹⁹J for the latter [20]. Target-seed and seed-seed interactions follow (2), where εand σ are calculated by the Lorentz-Berthelot rules for the former interaction, while aluminum properties are simply used for the latter. When a carrier molecule interacts with any other molecule, there is only repulsion, and thus energy alteration is possible only through momentum transfer by collisions.
For initialization, the whole system was equilibrated for 0.8 ns at 241.38K and relaxed for 0.2 ns. All molecules during equilibration had no attraction. Once the simulation begins, quenching occurs for a target temperature by velocity rescaling of the carrier molecules at a frequency of 100 throughout. The entire simulation runs for 10.0 ns. Nine supersaturation ratios, 2.22, 3.04, 4.27, 5.11, 6.17, 7.15, 8.12, 9.25, and 10.23, were simulated. These S are initial target values and change during the simulation as nucleation progresses.
Figure 1 is simply an example of the seeds and their configurations. They are initially constructed from
cutting out an aluminum FCC (1,1,1) bulk with a density of 2700 kg/m3.
Figure 1. Cubic, sphere, and rod shaped cluster-seeds As noted, a summary of the configurations and dimensions in dimensionless units (by aluminum) of the cluster-seeds are in table 1. Vibration of the cluster-seed was observed so the dimensions are average lengths of the seeds. The parentheses contain sizes for spheres, and the first number for the rod shape is the square length followed by the height. The cubic and sphere are each the side length and diameter, respectively. Since the cluster-seed is made by cutting out an FCC lattice it was very difficult to make clusters having exactly the same number of molecules for the spherical shape, hence the minute discrepancy.
In the analyzing stage, molecules were identified to be in the same cluster when they were within 1.5σ, and a liquid molecule was defined to have more than 9 neighbors [21].
3. Results
3.1 ANOVA for Rates
A three-way layout analysis of variance (ANOVA) where the factors are S, mass, and shape, was performed and presented in table 2. All the interaction effects except that of mass and shape have been pooled into the error to improve statistical power. According to the table, only S has a statistically significant effect on the nucleation rate. This is comprehensible, because the nucleation rate is defined by the number of nuclei that exists at a certain time per unit volume. Even if the seed has an affect on a nucleus it is still only one nucleus. In other words, the seed does not affect the number of nuclei, thus the dimensions of the affect of the cluster- seed for the nucleation rate is insignificant.
Table 2. ANOVA for nucleation rate of high S, 45 simulations (five supersaturation ratios)
Source DF Mean Square F Value Pr>F Mass 2 0.00005267 0.91 0.4142 Shape 2 0.00000713 0.12 0.8850 S 4 0.00145888 25.10 <.0001
Mass*Shape 4 0.00004473 0.82 0.5213
For the nucleation rate has no substance under critical S, we defined and observed the growth rate of the cluster.
The growth rate is the increase in number of molecules that attach to the cluster. It is the number of molecules within the largest cluster at a certain time per unit volume. The mechanism of growth of the nucleus under critical S is basically monomer attachment, which should be distinguished from growth above critical S that also grows by coalescence. Table 3 shows below critical S results and that all three factors have a significant affect on the growth rate. Seen from the F value in the ANOVA table, the supersaturation ratio has the most effect on how quickly the cluster grows, followed by the mass class of the cluster-seed. Since growth occurs on the surface of the seed mainly by monomer attachment, the surface area and level of monomer existence are controlling factors. S is directly related to how many monomers can reside within the system, and for this case shows a stronger contribution to the rate than dimensions of the cluster-seed. As seen in table 1, the mass class is also correlated to the surface area as the shape, but has more influence on the area, because though the rod is the largest and sphere has smallest area within the same mass, the surface area of a sphere for an upper mass class is still greater than that of a rod for the next lower mass class. Thus the results show that the mass has relatively stronger contribution than the shape. S is related to thermal diffusion, while the dimension of the cluster- seed is related to mass diffusion. Therefore, one may conclude for the growth rate of low S, thermal effects are stronger than mass diffusion.
Table 3. ANOVA for growth rate of low S, 36 simulations (four supersaturation ratios)
Source DF Mean Square F Value Pr>F Mass 2 1.36468836 63.88 <.0001 Shape 2 0.51686019 24.19 <.0001 S 3 1.64024173 76.78 <.0001 Mass*Shape 4 0.08865061 4.15 0.0108
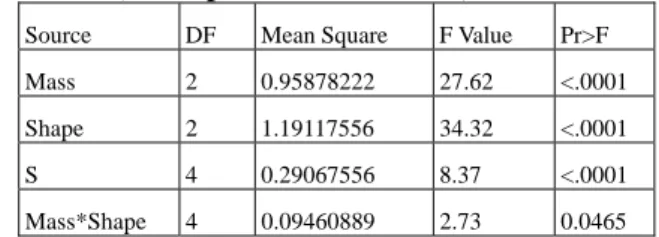
Unlike the nucleation rate, which has no meaning for low S, it is possible to obtain the growth rate for high S, which was done in table 4. Since there is more than one cluster for high S conditions, the growth rate is defined for that of the largest cluster. Interestingly, the prominence of effects are directly in contrast to that of
low S. In short, at low S thermal affects are most significant, while at high S they become the least. This may be intuitively incomprehensible, for high conditions should render high contributions to results and vice versa.
From a different perspective, however, the abundance of an effect actually decreases the scarcity i.e. importance, and thus translates that to the contribution of the significance of the effect. Physically, as mentioned before, the monomer distribution and surface area of the cluster-seed are controlling factors, but since there are more than enough monomers, the next controlling factor becomes relatively stronger in influence. Then if the surface area is the more dominant factor, as in low S, the mass should have more influence than shape for the larger area. However, for high S the rod tends to have a larger moment of gyration, which generates an effective surface area that overcomes the mass shape deficit.
Furthermore, according to the F values, the absolute difference between the shape and other factors for high S is less than low S, which suggests that the shape is relatively more effective for high S, but not as instrumental.
Table 4. ANOVA for growth rate of high S, 45 simulations (five supersaturation ratios)
Source DF Mean Square F Value Pr>F Mass 2 0.95878222 27.62 <.0001 Shape 2 1.19117556 34.32 <.0001 S 4 0.29067556 8.37 <.0001 Mass*Shape 4 0.09460889 2.73 0.0465
When the ANOVA is seen for all nine S, the tendency coincides with the growth rate for low S. Two questions may arise from this result. The first is why does the tendency have to follow one or the other, and the second is if so, does the tendency have to correspond identically with the chosen one. A similar pattern is seen for the subsequent analysis on liquefaction rate.
Basically, the answers to the two questions lie in the definition of the rates. Firstly, the reason for the results of all S following low S is that it is the one that purely identifies with the definition of the growth rate. As noted, the growth rate is controlled by two factors being monomer distribution and surface area of seed, and the low S environment brings out the significance of both. At high S, growth is not focused exclusively to the cluster with the seed, which means the effects that were
intended to be observed by the definition are impure.
Secondly, even though the overall growth rate seems to follow low S, the level of significance may differ. For instance, S can be followed by shape rather than mass as in low S. This does not happen because surface area is still one controlling factor but the mass has a greater effect on it than shape. The shape contribution for high S is relatively higher, but when it comes to the absolute value difference for both systems, low S is greater than high S. Therefore, when both are summed, the results follow low S as in table 5. In other words, the aberration of shape for high S is for an isolated case.
Table 5. ANOVA for growth rate of all S, 81 simulations (nine supersaturation ratios)
Source DF Mean Square F Value Pr>F Mass 2 2.25005779 76.08 <.0001 Shape 2 1.67014564 56.47 <.0001 S 8 2.6908422 91.13 <.0001 Mass*Shape 4 0.17158805 5.80 0.0005
The nucleation and growth rates were each used to understand if the cluster-seed dimensions influenced characteristics of condensation for two disparate regions bordering critical S. However, a direct comparison to evaluate which system, high or low S at what cluster- seed, has more liquid molecules is impossible. The nucleation rate is only for high S and growth rate is essentially for low S, because of their innate definition.
Nevertheless, in creating new materials or in the formation of aerosols, the seed dimensions are somewhat fixed, and the environmental conditions are controlled. It is more convenient to be able to neglect the critical supersaturation ratio and analyze the condensation occurring in the system, without distinguishing of homogeneous or heterogeneous nucleation. Therefore a liquefaction rate is defined, as the number of all liquid molecules within the system at a certain time per unit volume. The definition of liquid molecules is aforementioned.
2 4 6 8 10 0
2 4 6 8 10
108 cub 108 rod 110 sph 256 cub 256 rod 255 sph 500 cub 500 rod 502 sph
Liquefaction Rate
S
Figure 2. Nondimensional liquefaction rate for all S.
Figure 4 gives a basis on how quickly liquefaction occurs for each system. The rate gradually increases with S, but for the rod shape with 500 molecules, even though S is low at 4.27 there are more liquid molecules in the system than for some cluster-seeds at S=8.12. A sudden increase in the rate is seen after S= 9.25. The distribution for each S is relatively narrow for low S than for high.
The sphere with 110 molecules for S=7.15 coincidentally has a distinctive value. Repetition of simulations will most probably produce more general and quantitative results.
Table 6. ANOVA for liquefaction rate of low S, 36 simulations (four supersaturation ratios)
Source DF Mean Square F Value Pr>F Mass 2 1.34052108 62.08 <.0001 Shape 2 0.51306775 23.76 <.0001 S 3 1.67577748 77.61 <.0001 Mass*Shape 4 0.08645333 4.00 0.0126
Similarly for coherence, ANOVA was initially conducted separately for the liquefaction rate at low S.
Comparing table 6 to 3, the two are nearly identical. This is natural because at low S the definition for the growth rate and liquefaction rate are equivalent. The analysis coincides as well.
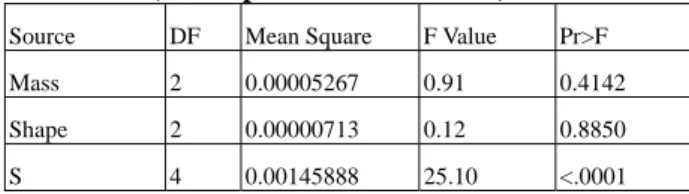
Table 7. ANOVA for liquefaction rate of high S, 45 simulations (five supersaturation ratios)
Source DF Mean Square F Value Pr>F Mass 2 1.7304289 2.06 0.1441 Shape 2 0.3756822 0.45 0.6434 S 4 50.5874411 60.20 <.0001 Mass*Shape 4 0.8938222 1.06 0.3905
Table 7 is the liquefaction rate for high S. The supersaturation ratio is the only significant factor, which
means that the cluster-seed has no effect on the rate. This is quite straight forward because at high S, nuclei are formed and grow at multiple sites regardless of the cluster-seed as in the case of the nucleation rate. In contrast to the growth rate, S is the most important factor for the liquefaction rate for both high and low S.
Table 8. ANOVA for liquefaction rate of all S, 81 simulations (nine supersaturation ratios)
Source DF Mean Square F Value Pr>F Mass 2 3.0539365 6.81 0.0021 Shape 2 0.8413928 1.88 0.1616 S 8 50.7143891 113.06 <.0001 Mass*Shape 4 0.6870333 1.53 0.2036
The tendency of the liquefaction rate for all S follows high S, unlike the growth rate following low S. Though the consequence differs, the reason for such result is similar in that the roots are in the definition of the liquefaction rate. In overall condensation there are two aspects where one is nucleation and the other growth of the nucleus. For the growth rate, the S condition that best identifies with the definition was low S because at low S there was only pure growth centered from the seed.
Similarly, the liquefaction rate incorporates both nucleation and growth thus best identifies with high S where both phenomena occur, but the former being more dominant for condensation, which will be discussed further subsequently.
4. Conclusion
3-D heterogeneous nucleation was simulated by classical molecular dynamics (MD), where the Lennard- Jones (LJ) gas and solid cluster-seed molecules each have argon and aluminum properties, respectively. All dimensions of the wall were periodic and a soft core carrier gas within the system controls the temperature rise induced by latent heat of condensation by velocity rescaling. There are three shapes of cluster-seeds, cube, rod, and sphere, and three classes of masses and the simulation took place under nine supersaturation ratios, making a total of 81 simulations. A three-way layout from design of experiments (DOE) was used for analysis, where the factors are S of the system, and mass and shape of the cluster-seed.
The study confirms that nucleation may occur for an
insufficient supersaturation ratio if a seed is within the system, but it is at a single site. Hence, analyzing the nucleation rate becomes meaningless and the growth rate of the largest nucleus was examined. The nucleation rate for systems above critical S shows exclusive dependence on the supersaturation ratio, while the overall growth rate is controlled by seed dimensions. To bridge nucleation and growth rate into one condensation rate independent of critical S, the liquefaction rate was defined. This liquefaction rate showed that bulk contribution from high supersaturation is more significant to condensation. At very high supersaturation ratios, the cluster-seed was found to interfere with all rates.
References
(1) Berger, U., and von Zahn, U., 2007, "Three- dimensional modeling of the trajectories of visible noctilucent cloud particles: An indication of particle nucleation well below the mesopause," Journal of Geophysical Research-Atmospheres, 112(D16).
(2) Bunkov, Y. M., and Timofeevskaya, O. D., 1998, "A and B phases nucleation at a fast superfluid transition in He-3. Can it be relevant for cosmology?," Journal of Low Temperature Physics, 110(1-2), pp. 45-50.
(3) Heiler, M., Winkler, G., and Schnerr, G. H., 2000,
"Homogeneous/heterogeneous condensation in transonic nozzle flows," Zeitschrift Fur Angewandte Mathematik Und Mechanik, 80, pp. S721-S722.
(4) Coffee, S. S., Stanley, S. K., and Ekerdt, J. G., 2006,
"Directed nucleation of ordered nanoparticle arrays on amorphous surfaces," Journal of Vacuum Science &
Technology B, 24(4), pp. 1913-1917.
(5) Wang, Y., Xu, X., Tian, Z. Q., Zong, Y., Cheng, H. M., and Lin, C. J., 2006, "Selective heterogeneous nucleation and growth of size-controlled metal nanoparticles on carbon nanotubes in solution,"
Chemistry-a European Journal, 12(9), pp. 2542-2549.
(6) Debenedetti, P. G., 1996, Metastable Liquids, Princeton University Press.
(7) Hirth, J. P., and Pound, G. M., 1963, Condensation and evaporation: nucleation and growth kinetics, MacMillan.
(8) Suh, D., Yoon, W., Shibahara, M., and Jung, S., 2008,
"Molecular dynamics analysis of multiple site growth and coalescence effects on homogeneous and heterogeneous nucleations," Journal of Chemical Physics, 128(15).
(9) Yasuoka, K., Gao, G. T., and Zeng, X. C., 2000,
"Molecular dynamics simulation of supersaturated vapor nucleation in slit pore," Journal of Chemical Physics, 112(9), pp. 4279-4285.
(10) Kholmurodov, K. T., Yasuoka, K., and Zeng, X. C., 2001, "Molecular dynamics simulation of supersaturated vapor nucleation in slit pore. II.
Thermostatted atomic-wall model," Journal of Chemical Physics, 114(21), pp. 9578-9584.
(11) Kimura, T., and Maruyama, S., 2002, "Molecular dynamics simulation of heterogeneous nucleation of a liquid droplet on a solid surface," Microscale Thermophysical Engineering, 6(1), pp. 3-13.
(12) Toxvaerd, S., 2002, "Heterogeneous nucleation at a planar surface," Physica a-Statistical Mechanics and Its Applications, 314(1-4), pp. 442-447.
(13) Rozas, R., and Kraska, T., 2007, "Molecular dynamics simulation of heterogeneous nucleation and growth of argon at polyethylene films," Journal of Physical Chemistry C, 111(43), pp. 15784-15791.
(14) Yasuoka, K., and Matsumoto, M., 1998, "Molecular dynamics of homogeneous nucleation in the vapor phase. I. Lennard-Jones fluid," Journal of Chemical Physics, 109(19), pp. 8451-8462.
(15) Fletcher, N. H., 1958, "Size effect in heterogeneous nucleation," Journal of Chemical Physics, 29(3), pp.
572-576.
(16) Yasuoka, K., and Matsumoto, M., 1998, "Molecular dynamics simulation of homogeneous nucleation in supersaturated water vapor," Fluid Phase Equilibria, 144(1-2), pp. 369-376.
(17) 2005, "NIST Chemistry WebBook."
(18) Montgomery, D. C., 2001, Design and analysis of experiments, John Wiley, New York.
(19) Sadus, 2002, Molecular Simulation of Fluids, Elsevier Science.
(20) Agrawal, P. M., Rice, B. M., and Thompson, D. L., 2002, "Predicting trends in rate parameters for self- diffusion on FCC metal surfaces," Surface Science, 515(1), pp. 21-35.
(21) Stillinger Jr, F. H., 1963, "Rigorous basis of the Frenkel-Band theory of association equilibrium,"
Journal of Chemical Physics, 38(7), pp. 1486-1494.
(22) Toxvaerd, S., 2001, "Molecular-dynamics simulation of homogeneous nucleation in the vapor phase," Journal of Chemical Physics, 115(19), pp.
8913-8920.
(23) Yasuoka, K., and Matsumoto, M., 1998, "Molecular dynamics of homogeneous nucleation in the vapor phase. II. Water," Journal of Chemical Physics, 109(19), pp. 8463-8470.