Sensors & Transducers
© 2016 by IFSA Publishing, S. L.
http://www.sensorsportal.com
Operative Line of Resection Determination Method for Emphysema Surgery using High-Speed Laser Scanner
and Non-Rigid Registration
Jong-Ha Lee 1 , Wei Qun 1 , and Hyung Jin Kim 2
1
Keimyung University, School of Medicine, Dept. of Biomedical Engineering, Daegu, South Korea
2
Biomedical IT Tech Research Division,
Gumi Electronics and Information Technology Research Institute, Gumi, South Korea Tel.: (82)-053-580-3736, fax: (82)-053-580-3746
E-mail: [email protected]
Received: 5 December 2015 /Accepted: 29 January 2016 /Published: 29 February 2016
Abstract: A successful image-to-physical space overlay method is necessary to provide reliable guidance information to surgeons and accurate surface displacement data for use in compensation algorithm of soft tissue deformation. In this paper we outline a novel approach to relate preoperative images to intraoperative space in a lung volume reduction surgery. The protocol requires intraoperative geometric data to measure and compensate for tissue deformation in the organ. We use 3D laser scanner to accomplish these tasks intraoperatively. A laser scanner based on the optical principle of triangulation acquires a dense set of three-dimensional point data in a very short time. The non-rigid registration is then performed via robust point matching algorithm between control points identifiable in both the preoperative tomograms and the intraoperatively acquired point cloud data provided by a laser scanner. Using the obtained warping field, preoperative region of interest is determined in a physical space. Phantom studies using commercial pig’s lung were performed to test the ability to link 3D laser scanner with preoperative modality data through non-rigid registration. The experiments demonstrate that the proposed protocol is capable of achieving non-overlapping ratio of less than 1.41 %. Surface deformation studies were performed in order to determine if the non-rigid registration is capable of compensate soft tissue deformation. In the deformation studies, the laser scanner with non-rigid registration method was able to track changes in preoperative region of interest less than 3.13 % non-overlapping ratio. The experiments were also performed different field of vision data: the non-overlapping error was below 4.14 % with 84 % of the organ visible and below 1.66 % with 96 % of the organ visible. Copyright © 2016 IFSA Publishing, S. L.
Keywords: Non-rigid image registration, Image guided surgery, Robust point matching.
1. Introduction
Emphysema is an obstructive lung disease affecting millions of people, especially smokers around the world. It is characterized by a loss of elasticity, which results in an early airway closure during exhalation. The normal anatomy of the lung is altered in such a way that gas exchange becomes poor.
According to the National Center for Health Statistics,
the number of non-institutionalized adults who have
ever been diagnosed with emphysema was 4.1 million
in 2006 [1]. In the United States, emphysema also
contributes to more than 100,000 deaths each year, and
costs more than 2.5 billion dollars in annual health
care expenses [2]. National emphysema treatment trial
shows that lung volume reduction surgery (LVRS)
improves the quality of life by improving the exercise capacity [3]. The same study also concludes that for patients with both predominantly upper-lobe emphysema and low base-line exercise capacity, LVRS reduces mortality. A more recent study shows the improvements in pulmonary function and exercise ability after LVRS [4-5]. There are also studies that LVRS improves neuropsychological function and sleep quality [6]. Thus, LVRS benefits the patients with severe emphysema, and the improvements of LVRS equipment and procedure should also benefit the patients.
Computed tomography (CT) scan is the choice of imaging modality for patients with suspected emphysema [Screaton and Koh, 2004]. Out of different possible CT images such as high resolution computed tomography (HRCT) and spiral CT, the spiral CT images printed with pixels below 960 HU (Housfield Unit), called density-masked images, gave the best estimate of the degree of emphysema in patients undergoing evaluation for LVRS [Cederlund, et al., 2002]. CT scans are relatively fast – it takes less than 30 seconds to obtain the lung CT scan – and cost effective compared to MRI. Thus, CT scan images are extensively used to determine the severity of emphysema. CT images are used in diagnosis of emphysema, but the data is not used in the operating room by the surgeons because the shape of the open lung is not identical to the shape of the lung when the CT scan was performed. Thus surgeons depend on their experiences of the tactical and visual senses to determine the line of resection. We develop an image- to-physical space overlay method that will aid surgeons in deciding the line of resection during the LVRS.
The protocol requires intraoperative geometric data to measure and compensate for tissue deformation in the organ. In this paper, we use laser scanner to accomplish these tasks intraoperatively. The laser scanners are capable of generating texture point clouds describing the surface geometry and intensity pattern.
Once we obtain the image of the lung from the laser scanner with the associated physical coordinate system, then we need to correspond the image with the CT image. Thus we need a method to register the non- rigid images. In this paper robust point matching (RPM) has been considered. RPM algorithm uses continuous relaxations of correspondence variables and non-rigid mapping [Chui, et al., 2000]. A recent comparative study of various non-rigid registration methods suggests that RPM are appropriate when the set of control point correspondences is fewer than a thousand and variation in spacing between the control points is not large [Zagorchev, 2006], which is the case in our application. In this paper, TPS affine transformation and non-affine deformation matrixes between CT data and laser scanner data are computed by RPM. Two matrices overlay CT image to laser scanner image and surgeons identifies their region of interest intraoperatively. The preliminary version of our paper has been presented in [Lee, et al., 2008].
2. Image Overlay Method and System Design 2.1. Image Overlay Method
(a) A patient is scanned by a CT scan and a 3D image is created. We determine the lung pressure of the patient.
(b) The CT scan data is segmented to the 3D torso surface image and lung images.
(c) In the operating room, prior to draping, the patient is scanned by a laser range scanner.
(d) Register the coordinate space of the patient’s torso (physical space) and the scanned laser image of the torso (scanned image space).
(e) Then 3D torso CT scan image is matched with laser torso image. This is to save time when the lung images are matched.
(f) Drape the patient and get ready for open lung surgery.
(g) After one of the lungs is visible, we inflate the lung to the predetermined pressure from step “a”. Then we scan the lung using the laser range scanner and coordinate measuring machine (CMM).
(h) Register the coordinate of the patient’s lung (physical space) and the coordinate of the laser scanned image (scanned image space).
(i) CT scan image is matched to the patient lung surface data obtained by the laser scanner using visible control points such as lung boundary, fissures, and carina.
(j) Overlay and display the resection boundary on the laser scanned lung image in the computer screen.
The theoretical and algorithmic developments are mostly given in steps “d”, “e”, “h” and “i”. These steps are the registration process to relate the physical space, laser scanner image space, with the CT image space.
Steps “d” and “h” are similar, and here we register the scanned image space with the physical space. Steps
“e” and “i” are similar and here we use non-rigid registration of the scanned image with the CT image.
The steps “d” and “e” are performed a priori as an initial alignment.
In the following subsections we describe the overall design of the Image Overlay System, preoperative image acquisition method, intraoperative image acquisition method, and coordinate transformation. The critical part of the Image Overlay System is non-rigid image registration. The next section is dedicated to the design, implementation, and test of a non-rigid image registration method.
2.2. Image Overlay System
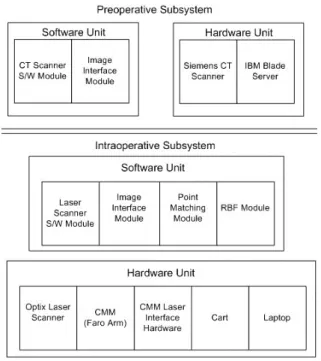
The system is divided into the Preoperative
Subsystem and Intraoperative Subsystem, and within
each subsystems there are hardware unit and software
unit. Furthermore, within the software unit there are
multiple modules. The outline of the whole system is
given in Fig. 1 Siemens CT scanner software, VB10 and Syngo Multimodality Workplace (MMWP) VE20A SL08P62, is the first module in the Preoperative Subsystem. This module will capture and display the three dimensional image of the lung. Using these images as the input, Emphysema Boundary module will determine the degrees of emphysema based on the Housfield unit (HU), and determine the optimal resection boundary. The final module in the Preoperative Subsystem is a MATLAB Interface Module. We designed software to import the dicom files generated by the CT Scanner module into MATLAB.
On the Intraoperative Subsystem side, we have four modules: Laser scanner software module, Point Matching module, Radial basis function (RBF) module, and Display module. The laser scanner module will be the laser scanner company’s software.
This will enable us to see and manipulate the laser scanned image. Also, this module have a file conversion part to convert 3D stereolithography (STL) or ASCII files to other MATLAB readable file format.
The Point Matching module will be based on the RPM algorithm. The RBF module will be used to fit a smooth surface to the laser scanned images using RBF.
The final software module, the Display module, will visualize the patient’s lung on the computer screen and overlay the emphysema boundary on the screen.
Fig. 1. Image overlay system hardware and software design.
2.3. Preoperative Image Acquisition
Preoperative images from various different modalities are usable with our approach. In this paper, we used 3D CT images from a Siemens Somatom
Sensation CT scanner in Temple University Hospital.
The CT produced 64 multiple 2D slices per rotation and the resolution was 0.24 mm ultra-high isotropic resolution. For our lung phantom, the highest rotation time was 0.33 seconds. The CT data were manipulated through Siemens Syngo acquisition workplace and stored in a computer. When the data were available in the server, we accessed clinical data through Syngo multimodality workplace and rendered 3D CT images through CT clinical engines and Syngo Expert-1.
Every slice was transmitted and stored in the Digital Imaging and Communication in Medicine (DICOM) file format. The size of DICOM files obtained from the CT is directly proportional to the number of obtained 2D slices. Later, we imported these 2D slices image into our software package. Then we rendered the 3D image and determined the outline and the region of interest for the pig’s lung.
2.4. Intraoperative Image Acquisition
Different modalities such as CT, MRI, or SPECT can be used with our approach to obtain intraoperative images. Here, we used a laser scanner (Optix 400M, 3D Digital Corporation, Sandy Hook, CT) to obtain intraoperative images. The laser scanning is a non- contact, non-invasive, fast, safe, and relatively simple method. The laser scanner is capable of generating point clouds with a resolution of 0.175 mm at a distance of 30 cm and 0.375 mm at a distance of 65 cm. The maximum point density was 1,000 points per line, up to 1,000 lines, and the field of view was 30 degrees. If the object is glossy or light absorbing such as black in color, then the scanned image may be noisy or the sensor may not detect the laser light reflection. We have tested the use of a laser scanner with a pig’s lung which is simulated as a smoker’s lung. Even though, the simulated smoker’s lung made from a pig’s lung was dark in color with smooth, light, porous, spongy texture, the laser scanner was able to successfully scan it.
We also have experimented with the point density, resolution, and scanning time. The results are summarized in Table 1.
Table 1. Swine lung scanning test with Optix 400 M laser scanner.
Lines Points Resolution, x (mm)
Resolution, y (mm)
Time (seconds)
1000 1000 0.25 0.25 90
500 1000 0.40 0.25 75
300 1000 0.75 0.25 50
500 255 0.40 0.75 20
The preliminary result shows that the best
resolution of X and Y was 0.25 mm with 90 seconds
scanning time and the worst resolution was 0.40 mm
of X and 0.75 mm of Y with 20 seconds scanning time.
The organ such as a lung is not stationary for 90 seconds. However, surgeons can inflate one lung at a time and hold it at a constant pressure for 90 seconds [9]. Then we can scan the lung during this period. The laser scanner that we use is a class II laser, which will not cause ocular damage as long as human does not directly look into the laser for an extended period of time.
After acquiring data, Radial Basis Function (RBF) was used to fit a smooth surface to the laser scanned images. In the OR, there is a need to relate the laser scanner space with a fixed physical coordinate system as the laser scanner moves to obtain three dimensional images of the organ. To relate the laser scanned images to the physical coordinate, we designed the system to use a Coordinate Measurement Machine (CMM). After the initial alignment, the CMM can track the location and orientation of the laser scanner and the scanner images are related to the physical coordinates.
2.5. Non-rigid Registration
Once the preoperative and intraoperative images are obtained, we need a method to relate these two images accurately. One of the most popular registration methods is Iterative Closest Point (ICP) algorithm. While ICP algorithm is very simple, fast, and guarantees to converge to the local minimum, it is not very robust. The algorithm is easily degenerated by noise and large deformation. In this paper, another algorithm, robust point matching (RPM) has been considered and modified [Chui, et al., 2000].
Moreover, we would like to determine region of interest (ROI) such as the location of the tumor or the line of resection within the intraoperative images. In order to perform these tasks, we augmented a RPM method to estimate ROI.
Consider we have a CT image and a laser scanner image as our preoperative and intraoperative images, respectively. We will consider the line of resection as the ROI of an organ. CT image control points consist of two point sets depending on whether correspondence points exist or not. Let
1 2
{ , ,...,
M}
A a a a be a set of control points selected along the contour line of an object in a CT image. CT image includes line of resection where laser scanner cannot detect. Let B { , b b
1 2,..., b
K} be a set of control points on the line of resection of a CT image.
These points do not have a corresponding points in C . . The outline of the organ is also fully detected on a laser scanner image, and all of control points in this set have correspondences. It is in the case of 100 % field of vision. We use C { , c c
1 2,..., c
N} to denote a set of control points in the laser scanner image.
Each landmark a
iis represented as a 2D homogeneous coordinate vector (1, a a
ix,
iy) . In our application, one to one matching is desired, but in general, one to one matching is not achieved due to
outliers. To handle this problem, two point sets A and C are augmented to A ˆ { , a a
1 2,..., a nil
M, } and
1 2
ˆ { , ,...,
N, }
C c c c nil by introducing a dummy or nil point. From these sets we determine the matching correspondence matrix, H . For a point m A ˆ and
n C ˆ , if m is matched to n , then h
mn 1 , otherwise,
mn
0
h , where h
mnis an element in matrix H . Points in A with the corresponding points in C are matched one to one, some of the points are determined as outliers if the matching probability is below the pre- determined threshold. Outliers in A are matched to the nil point in C , and vice versa. Multiple control points may be matched to a nil point. We want to find the matching correspondence and transformation
ˆ ˆ
, :
H f A C between these two point sets, which minimizes the bending energy of the Thin Plate Spline (TPS) model. Then we will use this matching function, f , to transform B , which is without correspondence to ˆ B , which is the resection line on the intraoperative laser scan image; f B : . RPM method formulates B ˆ the energy function to match the control points as closely as possible while rejecting outliers. The softassign technique and deterministic annealing algorithm are used to search for the optimal solution.
Below is the summary of RPM method of [Chui, et al., 2000, Yang, et al., 2006], which we modified to include the matching of the points without correspondence points. The optimal correspondence
H
^and transformation
^
f is obtained as follows.
,
ˆ
[ , ] ˆ arg min ( , )
H f
H fE H f , (1)
where
( , )
g( , )
t( )
d( )
w( ) E H f E H f E f E H E H (2
) subject to the following constraints.
1
1
1
N ij j
h
for i {1,..., M }
1
1
1
M ij i
h
for j {1,..., } N (3) with h
ij [0,1] and it indicates the matching probability.
( , )
E H f
gis the geometric feature based energy term according to the Euclidean distance,
2 1 1
2 1
( , ) ( )
( )
N M
g ij j i
j i
M
i i
i
E H f h c f a
v f a
, (4)
where
1 N
i ij j
j
v h c
(5)
The variable v
ican be regarded as a newly estimated position that corresponds to a
i.
t
( )
E f is the TPS smoothness energy term to generate a smooth spatial mapping. The constant regulates the smoothness.
2 2 2
2 2 2
2 2
( ) 2 .
t
f f f
E f dxdy
x y
x y
(6) ( )
E H
dcontrols the fuzziness of softassign technique with the temperature T of deterministic annealing, T [0,1]
1 1
( ) log .
N M
d ij ij
j i
E H T h h
(7)
The final term E H
w( ) prevents the rejection of too many points as outliers.
1 1
( ) ,
N M
w ij
j i
E H h
(8)
where is the constant.
RPM method involves a dual update process embedded within an annealing scheme. The first step is to update the correspondence:
( ( )) ( ( ))
1 exp
2
T
i i i i
ij
c f a c f a
h T T
(9)
Then, with a fixed H , the mapping parameters of f are calculated. If a weighting parameter is fixed, a unique solution of f that minimizes TPS energy function exists,
( ) ( , ) ( )
tps g t
E f E H f E f (10)
A solution consists of two parameter matrices D and W
( , , f a D W
i) a D
i ( ) a W
i , (11)
where D is the 3 3 matrix representing the affine transformation and W is the M 3 warping coefficient matrix representing the non-affine deformation. ( ) a
iis a 1 M vector for each
landmark a
i, where each entry
( )
2log , 1,...,
j
a
ia
ja
ia
ja
ij M
.
If we substitute the solution for f (12) into (11), the TPS energy function becomes,
( )
2trace(
T)
E
TPSf V XD W W W , (12) where [0,1] . { ( ) : 1,..., a
ii M } is the
M M matrix formed from ( ) a
i. To find the least- squares solutions for D and W , QR decomposition on A is applied to separate the affine and non-affine warping space [Wahba, 1990].
1 2
[ | ] 0 A Q Q R
(13)
As the final optimal solutions for ˆ D and W ˆ , we obtain
1
ˆ (
1T),
D R Q A
W (14)
1
2 2 2 2
ˆ (
T)
T.
W Q Q Q I
Q V (15)
The minimum value of the TPS energy function obtained at the optimum ( D W ˆ ˆ , ) is the bending energy. In RPM method, above two steps are iterated as the temperature is gradually reduced until the desired correspondence ˆ H and the transformation ˆf are obtained. Because we know the bending energy in every determined annealing step, the line of resection landmark set B can be warped to the laser scanner image using the TPS warping field. This process will allow B transforming gradually without correspondence.
The resection boundary estimation method has several parameters. To setup these parameters, some practical techniques are utilized. For our convenience, we scale coordinates of x-axis and y-axis into unit square and set T
oas 0.05. In the beginning, the preoperative image’s control points are placed as the center of the initial search boundary. Then the search boundary is set large enough to enclose all intraoperative control points. We set the initial weighting parameters as 1. We initialize the affine transformation matrix D to a zero matrix and non- affine deformation matrix W to an identity matrix.
During the annealing procedure, T gradually decreases according to a linear annealing schedule,
new old
T T , is the annealing rate. We set as 0.94. The annealing rate of is T and decreases by
new old
T
. The updates occur alternatively and are
repeated until they converge at each temperature
value. The deterministic annealing is repeated until T
reaches T
finaland we set T
finalas 0.005. The pseudo-
code for the resection boundary estimation algorithm
is summarized in Table 2.
Table 2. The Resection Boundary Estimation Algorithm Pseudo-code.
Input: CT image contour landmark set A , CT image line of resection landmark set B , Laser image landmark set C .
Initialization: D←0, W←0, T←To, λ← λo Do 1: Deterministic Annealing A ˆ and C ˆ
Do 2: Alternating Update
Update H ˆ based on current A ˆ and C ˆ Update D and W based on current H ˆ Update B ˆ based on updated D and W Until 2: D and W are converged
End Alternating Update T←T τ, λ← λT
Until 1: T< T_final
End Deterministic Annealing Merge warped A ˆ and warped B ˆ .
2.6. Registration Validation Metrics
The measurement of root mean square (RMS) distance between corresponding points is the most common performance metric of registration accuracy in rigid control points based registration [Fitzpatrick et al., 1998]. A metric for non-rigid registration is measuring mean RMS distance error between control points on one image and its corresponding closest control points on the other image. This is called mean registration error (MRE) and is defined as follows.
1
1 [( ˆ )( ˆ ) ],
m T
i i i i
i
a b a b
m
(16)
where ˆ a is the warped control points,
ib is the truth
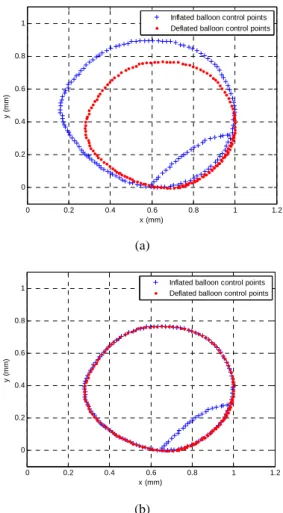
icontrol points, and m is the total number of control points. However this metric is inconsistent and sometimes leads to misleading results in the non-rigid registration problem [5]. Fig. 2 shows the failure of mean RMS distance error for the registration accuracy.
In Fig. 2(a), three control points (x) are matched to one landmark (o) simultaneously. In contrast, in Fig. 2(b), control points (x) and control points (o) are matched perfectly. If we calculate mean RMS distance between corresponding points, however, both results have the same mean RMS distance error. This problem occurs more prevalently if there are many control points and for a non-rigid registration.
In order to overcome this drawback of RMS distance and to have a more intuitive metric, we define a new metric called Non-Overlapping Ratio (NOR).
See Fig. 3 for the visual depiction of the NOR error.
Our main concern is the mismatched area after the registration.
(a) (b)
Fig. 2. An example of the shortcomings of mean RMS distance error for the registration accuracy in the non-rigid registration problem. Many to one registration result (a) and one to one registration result (b) have same mean RMS distance error.
Fig. 3. An example of NOR. The dark area indicates non- overlapping region between A and B.
We assumes that control points have m vertices (
i
,
ix y
a a ), i 1,..., m and a polygon is made of line segments between m vertices. The last vertex (
m
,
mx y
a a ) is assumed to be the same as the first, thus the polygon is closed. The NOR between polygon area A consisting of m vertices, and polygon area B consisting of n vertices is given by
( ) ( ) 2 ( )
100 (%) ( )
R A R B R C R B
, (17)
where ( ) R indicates the area made of vertices. ( ) R C indicates the intersection area of ( ) R A and ( ) R B . In this study, the MATLAB function polyarea is used to calculate the polygon area.
Typically, in non-rigid image registration using control points, perfect matching is rarely achieved, thus we assume there is always some overlapping; i.e., there are no 0 % nor 100 % NOR. Then NOR gives more intuitive metric for the registration quantity. This metric can be generalized to 3D volume error.
3. Result
In the first case, we used a balloon as a phantom.
We used a digital camera as our first modality. Before
taking a picture, we drew a line on the balloon’s
surface to indicate a truth line of resection. The black
points on the Fig. 4 represent ROI area. We took the
first digital image with an inflated balloon and took the
second image with a deflated balloon to represent the deformation of organs. We chose 200 landmarks for each image, 170 landmarks were chosen along the outlier and 30 landmarks were chosen along the resection line. The resection line on the deflated balloon image was used as the “truth” value.
(a)
(b)
Fig. 4. (a) Inflated balloon digital image, and (b) deflated balloon digital image.
Fig. 5 (a) shows landmarks before registration. The landmarks represented by the cross “X” are from the first image and the circle “o” are the second image.
Notice that there are significant differences between two outlines landmarks and two resection lines landmarks. Fig. 5 (b) shows the result after registration; we registered just using the outline landmarks. We notice that the outlines match relatively well, but on the left and right corner of the line of resection landmarks, there are some errors.
After rescaling it back to the actual coordinate system, we calculate the corresponding area. The result shows that before registration, the difference area was 31.48 cm
2for outline area and 2.41 cm
2for ROI area.
However, after registration, it becomes much smaller, and the difference area was 0.04 cm
2for outline area and 0.21 cm
2for ROI area. The corresponding NOR was 0.53 % for outline area and 0.74 % for ROI area.
We note that outline area has smaller NOR than ROI area. We conjecture that this is because there are more landmarks in the outline area and they are registered
using corresponding landmarks. We remind the readers that ROI landmarks were estimated without correspondence. We also note that we can improve the accuracy by carefully choosing more landmarks for both areas.
(a)
(b)
Fig. 5. (a) Balloon digital image landmarks (a) before registration, and (b) after registration.
3.1. Image Registration Experiments
The result from non-rigid registration experiments on pig’s lung are shown in Table 3.
Table 3. Registration results between CT image and laser scanner image. Three ROI were used as targets.
Before Registration After Registration MRE (mm) NOR (%) MRE(mm) NOR (%) Left
lung 15.42±2.23 23.03±8.46 2.32±0.23 1.21±0.28 Right
lung 16.22±2.36 24.78±4.63 3.36±0.26 1.91±0.13 Trachea 14.78±3.01 21.47±5.63 1.58±0.17 1.23±0.23 Cardiac
notch 14.25±2.97 21.57±7.45 1.32±0.21 1.01±0.35
A pig’s lung was first scanned by a CT scanner and an inflated pig’s lung was scanned by a laser scanner.
Fig. 6 shows the CT scan image and the laser scanned
0 0.2 0.4 0.6 0.8 1 1.2
0 0.2 0.4 0.6 0.8 1
x (mm)
y (mm)
Inflated balloon control points Deflated balloon control points
0 0.2 0.4 0.6 0.8 1 1.2
0 0.2 0.4 0.6 0.8 1
x (mm)
y (mm)
Inflated balloon control points Deflated balloon control points
image of the lung. A total of 700 control points are used for the registration. We assume that our ROI is the left lung, right lung, and a plastic gasket attached on the lung. To increase the reliability of experiments, the phantom was scanned 10 times, and for each scan, the control points were extracted and the registration is performed.
(a) (b)
Fig. 6. CT image (a), and laser scanner image (b) of a phantom surface.
3.2. Deformation Experiments
During the surgery, an organ’s shape change.
Therefore, the degree of organ’s deformation and visible percentage of the organ during a surgery are two important factors. For this reason, two sets of data from three images were obtained. We designed a computer simulation to measure the robustness of our algorithm under different degree of deformation and organ visibility. In the deformation experiment, 700 control points on each set of images are used and 10 different scanned data sets are chosen for each degradation level. Because the CT scan and laser scanned images are taken at the different times, the registration accuracy will depend upon the degree of deformation between the two registering images.
Fig. 7 shows the swine lung CT/laser scanner image landmarks.
We assume that the laser scanned image is the deformed image and register it to the CT scan image.
So, we quantify the degree of nonlinear deformation using Gaussian Radial Based Function (GRBF), which is generated by choosing a special form of the kernel,
2 2
( ) exp( / ), , 1,...,
j
x
ix
jx
ii j l
. Five levels
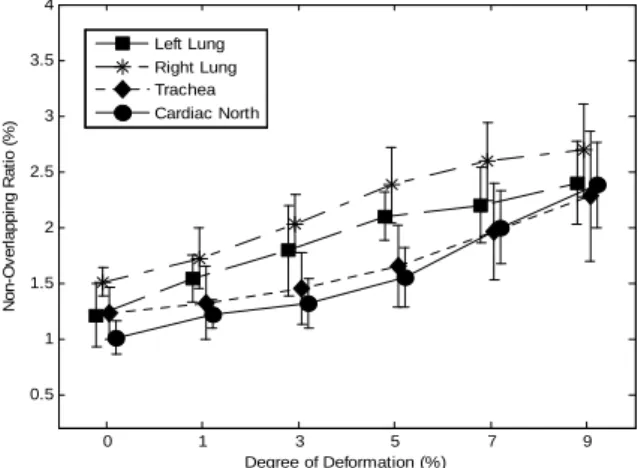
of deformation: 0.01, 0.03, 0.05, 0.07, and 0.09 are used depending on the parameters of GRBF. These values correspond to the degrees of deformation, 1 %, 3 %, 5 %, 7 % and 9 %. The results are shown in Fig. 8.
From Fig. 8, we notice that when the degree of the deformation is the highest, the NOR increases to 2.23±0.65 % for case 1 and 3.19±0.66 % for case 2.
Case 3 has the highest value deformation error and the error increases to 3.32±0.65 %. The difference between 1 % deformation and 9 % deformation was the largest in case 2 with 1.33 % and the smallest in case 1 with 0.78 %. Case 3 was in between these two and the difference was 1.07 %.
(a)
(b)
Fig. 7. Swine lung CT /laser scanner image landmarks (a) before registration and (b) after registration.
Fig. 8. Values correspond to the degrees of deformation.
3.3. Organ Visibility Experiments
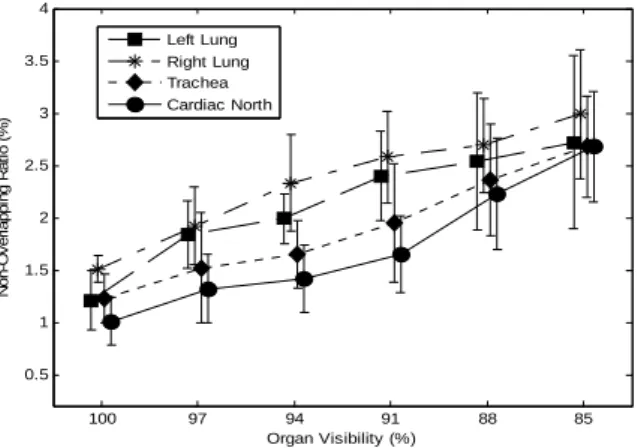
During a surgery, often only a part of the organ is visible. Thus, we investigate the effect of our method if the organ is partially visible in this section. For the organ visibility test, blocking windows are used to the original image and the images are reduced accordingly. The control points are re-chosen based on the reduced image. Six different organ visibility percentages are considered: 100 %, 96 %, 93 %, 90 %, 87 % and 85 %. Different percentages of organ visibility were also simulated and the results are shown in Fig. 9. In Fig. 9, we noticed that NOR error
0 1 3 5 7 9
0.5 1 1.5 2 2.5 3 3.5 4
Degree of Deformation (%)
Non-Overlapping Ratio (%)
Left Lung Right Lung Trachea Cardiac North
increases as percentage of visibility decreases, which is consistent with the intuition. If the surgeon sees about 96 % of organ, NOR was 0.94±0.30 %, 1.35±0.22 %, and 1.66±0.54 % for Cases 1, 2 and 3.
However, if the organ visibility drops to 84 %, the error increased and NOR was 3.28±0.33 % in Case 1 and 4.14±0.52 % in Case 3. Case 2 had the error of 4.01±0.49 %. The statistical test verifies that our approach is tolerant with various deformation and organ visibility.
Fig. 9. Simulated results in Different percentages of organ visibility.
4. Discussion
With the multitude of medical diagnostic equipment and frequent use of them, there is a need to integrate data from different modalities. Despite the fact that a surgeon can determine the region of interest such as a line of resection from preoperative CT scan image, there is no good method to relate this information to the open organ in the operating room.
The work presented in this paper estimates the operative surgical line of resection in the OR using a preoperative image such as CT data and intraoperative image using laser scanner data. Once again we emphasize that the line of resection does not have a corresponding points on the intraoperative image. We, however, use a novel non-rigid image registration method to relate these two images including the line of resection. The registration and estimation methods are implemented through customized software.
The proposed method will minimize unintended removal of the healthy part of the organ. We hypothesize that this method will improve the precision and quality of the LVRS, consequently improving the morbidity and mortality of patients with severe emphysema. Furthermore, the image-to- physical space registration method can be used train new surgeons in determining the line of resection in severe emphysema surgery. Furthermore, this research will have a direct applicability in image-guided surgery of other non-rigid structures of the body such as the heart, liver, and the brain. Similar technology will be applicable to tracking of moving or deformable organs.
4.1. Non-rigid Image Registration
Our registration method uses control points on the images. Thus, it is an intrinsic method. Different approaches based on the extrinsic method are also available [Maintz, et al., 1998]. In extrinsic method, invasive markers are introduced. The use of intrinsic method is more suitable registration approach for the following reasons. Extrinsic methods depend on artificial fiducials such as invasive screw markers or skin markers. Patients should be preoperatively imaged with artificial markers attached to them.
Intraoperatively, surgeons touch markers with the optical tracking probe and a system determines the transformation between those markers. The main drawback of this method is that fiducials must be attached or marked on the patient’s body before the surgery. The patients need to be at OR earlier for the preparation, and markers make patients feel uncomfortable. Furthermore, the transformations is mostly designed for a rigid model. Consequently, this method introduces larger error on most non-rigid organ surgeries. Our intrinsic method, however, depends only on the patient’s anatomical images.
Registration is based on the control points or voxel properties of the images. The advantages of our method are relatively fast, simple, non-contact, and non-invasive.
Furthermore, a new non-rigid transformation method has been developed for points without correspondence. This is important because even though our intraoperative images do not have diagnostic capability, we are able to determine the region of interest from the preoperative image. This method can be used to identify tumor locations and lines of resection in the OR. In our study, the landmark based non-rigid registration was performed using RPM. The line of resection was estimated on the approximate TPS warping field. This warping filed was calculated through two novel techniques, soft- assign and deterministic annealing. Using this method the non-overlapping region (NOR) errors were determined; for the phantom case, the error was less than 1 % and for the lung case the error was less than 2 % non-overlapping region.
Although, this method has been applied to lungs, other organs may be used. Other organs such as breasts may work well with this method. For example, the location of the breast cancer cell predetermined by MRI may be related to the intraoperative image (laser scanned, digital image, etc.). Moreover, this method can be used for time series analysis. For example, the tumor growth may be determined if there are multiple images separated by time are available.
4.2. Registration Accuracy Metric
In order to determine how well the ROI are estimated, non-overlapping ratio (NOR) error was introduced and determined using the vertices consisting of control points on the contour. In fact, we found out that measuring RMS distance (i.e., mean
100 97 94 91 88 85
0.5 1 1.5 2 2.5 3 3.5 4
Organ Visibility (%)
Non-Overlapping Ratio (%)
Left Lung Right Lung Trachea Cardiac North