Vol. 19, No. 7 pp. 443-452, 2018
사회경제적 특성 및 유병에 따른 의료서비스 이용 행태
이고은1, 임복희2*
1
부산가톨릭대학교 일반대학원 병원경영학과,
2부산가톨릭대학교 병원경영학과
Utilization Behavior of Medical Services According to Socioeconomic Characteristics and Prevalence
Ko-Eun Lee
1, Bok-Hee Im
2*1
Health Care Management, Graduate school of Catholic University of Pusan
2
Health Care Management, Catholic University of Pusan
요 약 본 연구는 제6기 국민건강영양조사 자료를 이용하여 만 25세 이상 성인을 대상으로 사회경제적 특성 및 유병상태 에 따른 의료서비스 이용행태를 파악하기 위한 연구이다. SPSS 23.0을 이용하여 빈도분석 및 기술적 통계분석, 일원배치분 산분석, χ
2-test, 회귀분석을 실시하였다. 연구결과는 남자보다 여자가, 65세 이상, 고졸이상, 무직이 많았고 소득분위는 모두 비슷한 수준으로 나타났다. 교육수준, 직능, 소득분위를 함께 고려한 사회경제적 상태(socioeconomic status; SES)에 대한 점수는 7-8점이 가장 많았고, 대부분 응답자의 주관적 건강상태는 보통으로 느끼고 있었다. 평균유병개수는 1.07±1.497개이 며 외래서비스 평균이용횟수는 0.50±.0745회이며, 입원서비스 평균이용횟수는 0.12±0.454회로 외래서비스 이용횟수 보다 낮았다. 일반적 특성에 따른 유병 및 주관적 건강상태는 유의한 차이가 있었고, 연령이 높을수록, 교육수준과 직능, 소득분
위 및 SES점수가 낮을수록 평균 유병개수는 많았으며 주관적 건강상태는 나쁘게 인식하였다. 현재 앓고 있는 질환에서
입원서비스는 중증일수록, 외래서비스는 만성일수록 많이 이용하는 것으로 나타났다. 즉, SES점수가 높을수록 전반적인 의료서비스의 이용이 낮았고, SES점수가 낮을수록 의료서비스의 이용은 높게 나타났다. 이와 같은 결과를 토대로 사회경제 적 특성이 낮은 집단에게 질환을 예방할 수 있는 적절한 보건교육 프로그램을 개발하여 이들이 질환에 노출되었을 때 적정 한 의료서비스를 이용할 수 있도록 지역사회기반의 적절한 보건서비스 체계의 구축 및 시행의 필요성을 시사 할 수 있겠다.
Abstract The purpose of this study was to investigate the utilization behavior of medical services according to the characteristics of socioeconomic status (SES) and prevalence by using the 6th National Health and Nutrition Survey data for adults over 25 years old. Frequency and technical statistical analysis, ANOVA, χ
2-test, and regression analysis were performed using SPSS 23.0. The results were as follows: more female than male, 65 years old and over, high school graduate, and unemployed and income quintiles were similar. The SES score considering education level, function, and income quintiles was the highest at 7-8, and most of the respondents felt moderate about their subjective health condition. The mean number of prevalence was 1.07±1.497, the mean utilization of outpatient services was 0.50±0.045, and the mean number of inpatient services use was 0.12±0.454. Depending on general characteristics, there was a significant difference between subjects with prevalence and subjective health conditions.
Higher age was associated with lower education, skill level, income, and SES score, and average prevalence was associated with poor subjective health conditions. More serious prevalence was associated with greater utilization of inpatient services. More chronic prevalence was associated with utilization of outpatient services. In other words, higher SES score was associated with lower overall use of medical services. Lower SES score was associated with higher use of medical services. In conclusion, we must develop appropriate health education programs that can prevent diseases in groups with low socioeconomic characteristics. There is the need to construct and implement a community-based appropriate health service system so that proper medical services can be used.
Keywords : SES score, utilization of medical service, KNHNES, prevalence, subjective health condition
*
Corresponding Author : Bok-Hee Im(Catholic Univ. of Pusan) Tel: +82-10-2389-4180 email: [email protected]
Received April 18, 2018 Accepted (1st May 24, 2018, 2nd June 1, 2018)
Accepted July 6, 2018 Published July 31, 2018
1. 서론
최근 주목받고 있는 보건의료의 개념 중 하나는‘건강 의 사회적 결정요인’이다[1]. 보건의료에 있어 형평성은 매우 중요한 가치임에도 불구하고 보건의료혜택을 받아 야 하는 사회경제수준이 낮은 사람들에 비해 사회경제수 준이 높은 사람들이 더 나은 보건의료의 혜택을 받고 있 다. 또한, 낮은 사회경제수준의 사람들은 양질의 보건의 료 혜택을 필요한 때에 받지 못하는 경우가 지속적으로 발생하고 있다[2].
현실적으로 우리 사회에 사회경제적 지위에 따라 건 강수준과 의료서비스 이용에 격차가 존재한다는 사실은 오래전부터 문제점으로 부각되어 왔다[3]. 최근에는 경 제 불평등과 인구 건강과의 관계에 대한 역학자들의 관 심이 증가하고 있으며, 사회경제 상태가 건강 불평등의 중요한 원천임을 제시하고 있다[4]. 사회경제 상태란 일 반적으로 가족이나 개인의 세 가지 영역을 설명하기 위 해 세 가지 수준(높음, 중간, 낮음)으로 나뉘며, 세 가지 변수(소득, 교육 및 직업) 중 일부 또는 전부로 평가할 수 있다[5]. 개인의 권력과 소득, 물자 등의 불평등 분포 는 사람이 살아가는 직접적이고 가시적인 환경(교육 등 에 대한 접근, 노동, 여가, 가정, 거주지역의 조건)에 불 공정성을 초래하며 사회적 결정요인은 건강에 미치는 영 향 요인 중 생물학적 요인에 비하여 과소평가 되어 있다 [6].
여러 학자들은 사회경제적 지위에 따른 건강수준과 의료서비스 이용에 격차가 존재함을 연구하여 건강 불평 등 현상을 분석하고 파악하고 있으며, 그에 대한 내용은 Table 1과 같다. 보건의료의 이용에 있어 불평등 현상을 해소하기 위하여 사회경제적 지위 및 특성과 보건의료 이용과의 형평성은 지속적으로 관찰할 필요가 있으며 이 를 위해서 사회경제적 특성이 의료이용 행태와 어떠한 관계가 있는지 분석해볼 필요가 있다. 더불어 어떠한 질 환들이 의료서비스를 이용하는데 영향을 미치는지에 대 하여도 분석해볼 필요가 있으며, 기존에 연구된 영향요 인과의 비교 또한 필요한 부분이다.
이에 본 연구에서는 제6기 국민건강영양조사 자료를 이용하여 사회경제적 특성 및 조사 대상자의 현재 유병 상태와 의료서비스 이용과의 관계를 통합적으로 분석하 여 과거 분석된 자료와 비교하고자 한다. 이들 대상자들 의 최근 의료이용 데이터를 기초자료로 하여 추후 지속
적인 연구를 통하여 보건의료 이용의 불평등 현상을 확 인하여 해결할 수 있는 대처방안을 수립하는데 근거자료 로 제시하고자 한다.
2. 연구방법
2.1 연구대상
국민건강영양조사는 매년 실시되는 조사이며 전국 192개 지역을 대상으로 순환표본조사 방식을 이용하여 조사지역을 선정한 후, 연구대상 가구를 계통추출법에 의해 선정한다. 본 연구는 질병관리본부가 조사한 국민 건강영양조사 자료 중 제6기 자료(2013-2015)를 활용하 였다. 최근의 자료인 6기 자료를 전체 통합하여 표본을 추출하였으며, 만 25세 이상 성인 중 건강상태 및 의료 이용에 대한 무응답 및 결측값을 제외한13,606명을 최 종 연구대상자로 선정하였다.
2.2 측정변수
2.2.1 사회경제적 특성 변수
Erica Goode[5]는 사회경제적 특성은 교육, 소득, 직 업의 세 가지 변수를 이용하여 평가할 수 있다고 주장하 였으며 이를 기준으로 본 연구에서는 제6기 국민건강영 양조사에서 조사한 교육수준, 직능, 가구별 소득분위를 사회경제적 특성 변수로 사회경제적 지위를 반영하는 측 정 지표로 선정하여 연구의 목적에 따라 변수를 재분류 하였다. 사회경제적 지위를 나타낼 수 있는 세 변수에 가 중치를 부여하여 사회경제적 지위 점수(SES점수)를 계 산하여 사용하였으며 주관적 건강상태, 질환별 현재 유 병여부, 1년간 입원이용 여부, 입원이용 횟수, 2주간 외 래이용 여부, 외래이용 횟수를 지표로 선정하였으며 연 구의 목적에 따라 일부 변수를 재분류하였다. 사회경제 적 지위 및 일반적 특성, 건강수준 및 의료서비스 이용 측정 변수의 종류 및 범위는Table 2와 같다.
2.3 분석방법
SPSS 23.0을 이용하여 연구대상자의 일반적 특성은 빈도 및 기술적 통계분석을 실시하였고, 일반적 특성에 따른 현재 유병 질환의 개수를 알아보기 위하여 기술적 통계분석 및 일원배치분산분석을 실시하였다. 일반적 특
1.
Subject Quantitative and qualitative difference in the utilization of health care-Based on the survey of Gwangju-Jeonnam residents-
Data Based on the survey of 1,480 Gwangju-Jeonnam residents.
Method HIww index
Result
There was no big difference in the medical amount of the income group. Also, fair equity was favorable in the direction of increasing hospital admissions and hospital days. But on the qualitative aspect, better quality or expensive medical care is advantageously used, except for hospitalized medical expenses of wealthy people.
2.
Subject Income-related Inequalities in health care finance and self-assessed health in Korea fromm 1999 to 2007:measurements based on KLIPS survey data
Data Korea Labor&Income panel (1999~2007) Method Kakwani indices, CI+
Result
Vertical fairness of income and medical expenditure falls under a very high inequality. Inequality in medical expenditure expenses repeatedly increased and decreased with the passage of time. Inequality level of health level by income class is not so big, and degree gradually decreases with the passage of time As 2005 it showed again that inconvenience became.
3.
Subject Income-related inequality in medical care utilization by provider types Data 2005 Korea National Health and Nutrition Survey
Method Concentration indices(C), medical care utilization inequality
Result
Concentration index for outpatient use showed many inequality in outpatient use of low income group. Outpatient utilization inequality by income class The same medical care principle was obeyed. However, the medical institution type showed other aspects. Health institutions showed inequality in medical inequality, where there are many outpatient uses of high-income class members of comprehensive specialized medical institutions, which had a large medical inequality favorable to the low-income class. Regardless of the type of medical institution, hospitalization showed hospital use unequal structure, which is frequently used in low-income class, at all medical institutions.
4.
Subject A equity changes in health care utilization according to health status Data National Health and Nutrition Survey(1998, 2001, 2005, 2007) Method Le Grand index, concentration index(CI)
Result
Medical usage by income group was found to be concentrated in low-income class medical use. Concentration index of subjective health condition was focused on medical needs of low income group. It is judged that the concentrated of medical care is gradually getting worse and the health condition of the low income group is getting worse. The Le Grand is mostly many medical usage of low-income, but the disparity was not large, but the usage of high-income has gradually increased.
5.
Subject Comparisons of the equity of medical care utilization by sex, age groups, and region Data National Health and Nutrition Survey2010)
Method Concentration index(CI), Hiww index(HI)
Result
In outpatient use, hospitalization use, sum of hospitalization expenditure, the average of agricultural fishing village higher than or equal to urban area, there is no difference. Medical inequality is shown to be different for all regions.
Health status and socioeconomic status in medical services, low-income medical use is severely restricted compared to medical demand.
6.
Subject A study on the effects of socioeconomic status on health level and medical service use Data National Health and Nutrition Survey(2013)
Method SES model
Result Factors of socioeconomic status(income level, educational level, form of economic activity) influence health status and used of services.
Table 1. About the health level and the utilization disparity of medical services by socioeconomic status
악하기 위하여 χ2-test를 하였고, 사회경제적 특성과 유 병 질환에 따른 의료서비스 이용 행태의 관계를 알아보 기 위하여 회귀분석을 실시하였다.
본 연구에 사용된 통계적 검증은p<.05에서 유의성을 검토하였다.
3. 연구결과
3.1 연구대상자의 일반적 특성
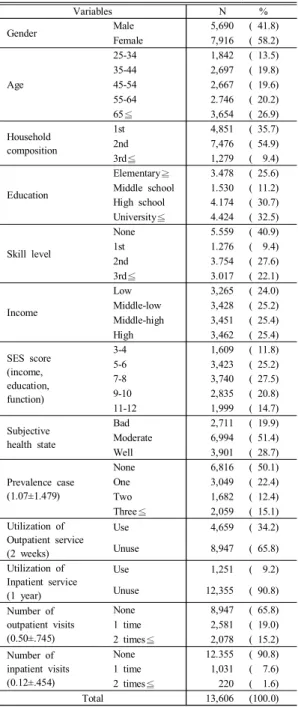
연구대상자의 일반적 특성을 빈도 분석한 결과 여자
58.2%, 65세 이상 26.9%, 2세대 가구구성 54.9%, 대졸 이상32.5%, 무직에서 40.9%로 높은 분포를 나타냈다.
소득분위는 중상, 상분위에서 25.4%로 동일하게 나타났 고, SES점수는 7-8점대가 27.5%로 높게 나타났다. 주관 적 건강상태는‘보통이다’에서 51.4%, 현재 질환을 가지 고 있지 않은 응답자가50.1%였으며, 현재 질환을 앓고 있다고 응답한 사람 중 1개의 질환에만 응답한 사람은 22.4%로 나타났다. 의료서비스 이용여부에서는 외래와 입원 모두‘아니오’에서 높은 응답률을 보였고, 외래서비 스의 평균이용횟수는0.50±.745, 입원서비스의 평균이용 횟수는0.12±.454로 나타났다<표3>.
Variables Range
Socioeconomic characteristics
Education ≦Elementary=1, Middle school=2, High school=3, University≦=4
Skill level
Reclassification according to Korean standard classification of occupations
None=1, First skill level(Elementary Workers)=2, Second skill level(Craft and Relates Trades Workers, Equipment, Machine Operating and Assembling Workers, Skilled Agricultural, Forestry and Fishery Workers, Service·Sales Workers, Clerks)=3, Third skill level≦(Managers. Professionals and Related Workers)=4
Income Low=1, Middle-low=2, Middle-high=3, High=4
Socioeconomic score(SES score)
Education(≦Elementary=1, Middle school=2, High school=3, University≦=4) + Skill level(None=1, First=2, Second=3, Third=4) + Income(Low=1, Middle-low=2, Middle-high=3, High=4) = Sum
→ Reclassify after summing
3-4scores=1, 5-6scores=2, 7-8scores=3, 9-10scores=4, 11-12scores=5
General characteristics
Gender Male=1, Female=2
Age 25-34=1, 35-44=2, 45-54=3, 55-64=4, 65≦=5
Household composition
Reclassify as generational classification
First generation(One generation household of the 1st generation, Couples, Others)=1, Second generation(Couples+Unmarried child, Single parent+Unmarried child, others)=2, Third generation≦=3
Health level
Subjective health state
Reclassification o 3 scale with 5 scale Bad=1, Moderate=2, Well=3
Prevalence case
Based on the total of the items that answered “Yes” in the response of the items as to whether they are afflicted by each disease or not, reclassification
None=0, One=1, Two=2, Three≦=3
Utilization of medical service
Outpatient service
(2weeks) No=0, Yes=1
Inpatient service
(1year) No=0, Yes=1
Count of utilization of outpatient service (2weeks)
Reclassify self-filled response None=0, One time=1, Two times≦=2 Count of utilization of
inpatient service (1year)
Reclassify self-filled response None=0, One time=1, Two times≦=2
Table 2. Socioeconomic and general characteristics and health level and medical service usage variable type and
range
Table 3. General characteristics
Variables N %
Gender Male 5,690 ( 41.8)
Female 7,916 ( 58.2)
Age
25-34 1,842 ( 13.5)
35-44 2,697 ( 19.8)
45-54 2,667 ( 19.6)
55-64 2.746 ( 20.2)
65≦ 3,654 ( 26.9)
Household composition
1st 4,851 ( 35.7)
2nd 7,476 ( 54.9)
3rd≦ 1,279 ( 9.4)
Education
Elementary≧ 3.478 ( 25.6) Middle school 1.530 ( 11.2) High school 4.174 ( 30.7) University≦ 4.424 ( 32.5)
Skill level
None 5.559 ( 40.9)
1st 1.276 ( 9.4)
2nd 3.754 ( 27.6)
3rd≦ 3.017 ( 22.1)
Income
Low 3,265 ( 24.0)
Middle-low 3,428 ( 25.2)
Middle-high 3,451 ( 25.4)
High 3,462 ( 25.4)
SES score (income, education, function)
3-4 1,609 ( 11.8)
5-6 3,423 ( 25.2)
7-8 3,740 ( 27.5)
9-10 2,835 ( 20.8)
11-12 1,999 ( 14.7)
Subjective health state
Bad 2,711 ( 19.9)
Moderate 6,994 ( 51.4)
Well 3,901 ( 28.7)
Prevalence case (1.07±1.479)
None 6,816 ( 50.1)
One 3,049 ( 22.4)
Two 1,682 ( 12.4)
Three≦ 2,059 ( 15.1)
Utilization of Outpatient service (2 weeks)
Use 4,659 ( 34.2)
Unuse 8,947 ( 65.8)
Utilization of Inpatient service (1 year)
Use 1,251 ( 9.2)
Unuse 12,355 ( 90.8)
Number of outpatient visits (0.50±.745)
None 8,947 ( 65.8)
1 time 2,581 ( 19.0)
2 times≦ 2,078 ( 15.2)
Number of inpatient visits (0.12±.454)
None 12.355 ( 90.8)
1 time 1,031 ( 7.6)
2 times≦ 220 ( 1.6)
Total 13,606 (100.0)
3.2 일반적 특성에 따른 주관적 건강상태 일반적 특성에 따른 주관적 건강상태를 교차 분석 및 평균 분석 한 결과, 성별에 따라서 남·여 모두 ‘보통이다’
의 응답이 가장 많았으나 평균 유병은1.23±1.611개로 여자가 더 많았고, 평균 건강수준은 .85±3.192로 남자가 더 나쁘게 인식하는 것으로 나타났다. 연령에 따른 건강
상태는 모든 연령에서‘보통이다’의 응답이 많았으나 65 세 이상에서 평균 유병이 2.09±1.814개, 건강상태는 1.90±.723으로 나쁘다고 인식하고 있었으며 연령이 높 아질수록 유병의 수는 증가하고 건강상태는 나쁜 것으로 나타났다. 가구세대구성은 모든 세대구성에서 ‘보통이 다’의 응답이 가장 많았고, 2세대로 구성된 가구에서 평 균 유병이 .74±1.192개로 낮았고 평균 건강상태는 2.15±.674로 보통보다 조금 더 좋게 인식하고 있었다.
교육수준에 따른 건강상태는‘보통이다’의 응답이 가장 많았고 초졸 이하의 평균 유병이2.01±1.812개, 평균 건 강상태가1.82±.696로 낮게 나타났으며, 교육수준이 낮 아질수록 유병의 수는 증가하고 건강상태는 나쁘게 인식 하고 있었다. 모든 직능에서 건강상태가 보통이라고 응 답한 사람이 많았으나 무직의 평균 유병은1.51±.1.729 개, 평균 건강상태는 1.96±.714로 보통보다 조금 낮게 인식하고 있었으며, 가구수입에 따라서 건강상태가 보통 이라고 인식한 응답자가 가장 많았으나 수입이 낮을수록 평균 유병이1.19±1.558개, 평균 건강상태가 1.98±.705 로 유병개수가 증가하고 건강상태는 나쁘다고 응답하였 다. SES점수에 따른 건강상태는 모든 점수에서 ‘보통이 다’의 응답이 가장 많았으나, 3-4점에서 평균 유병이 2.13±1.877개, 평균 건강상태는 1.74±.693으로 나쁘게 인식하는 것으로 나타났고, SES점수가 낮을수록 유병의 수는 증가하고 건강상태는 나쁘게 인식하고 있었다<표 4>.
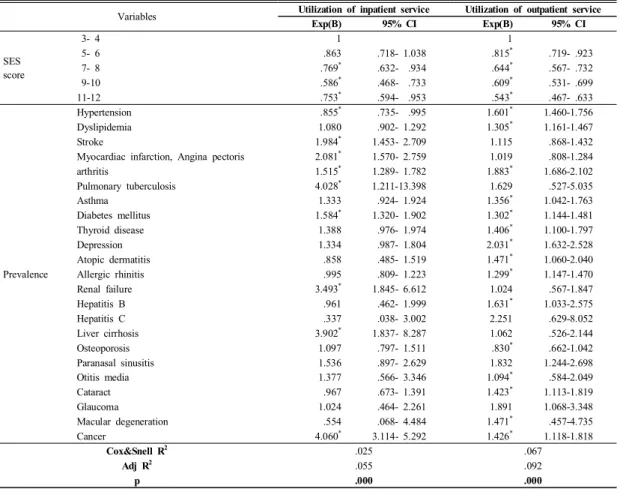
3.3 SES점수 및 현 유병자의 의료서비스 이용 SES점수와 의료서비스 이용 관계를 회귀분석으로 살 펴본 결과, SES점수에 따른 1년 이내 입원서비스 이용 은 7점 이상에서 통계적으로 유의하였고 3-4점에 비해 7-8점은 0.769배, 9-10점 0.586배, 11-12점 0.753배로 낮게 이용하는 것으로 나타났다. 2주 이내 외래서비스 이용은 모든 점수에서 통계적으로 유의하며SES점수가 높을수록 의료서비스를 이용하지 않는 것으로 분석된다.
각 질환별 현재 유병자의 입원 및 외래 의료 서비스 이용관계를 로지스틱 회귀분석으로 살펴본 결과, 입원서 비스 이용은 고혈압 질환자에서0.855배 낮게 이용하는 것으로 나타났고, 뇌졸중 1.984배 및 심근경색·협심증 2.081배, 관절염 1.515배, 폐결핵 4.028배, 당뇨병 1.584 배, 신부전 3.493배, 간경변증 3.902배, 암은 4.060배 높 게 입원서비스를 이용하는 것으로 나타났으며 통계적으
로 유의하였다. 외래서비스 이용에서는 고혈압 질환자가 1.601배, 이상지질혈증 1.305배, 관절염 1.883배, 천식 1.356배, 당뇨병 1.302배, 갑상선 질환 1.406배, 우울증 2.031배, 아토피피부염 1.471배, 알레르기비염 1.299배, B형간염 1.631배, 중이염 1.094배, 백내장 1.423배, 황반 변성1.471배, 암 1.426배 높게 이용하는 것으로 나타났 고, 골다공증 질환자는 0.830배로 낮게 이용하는 것으로 나타났으며 통계적으로 유의한 차이를 보였다<표5>.
3.4 SES점수 및 일반적 특성과 의료서비스 이용
SES점수 및 일반적 특성과 1년 이내 입원서비스 이
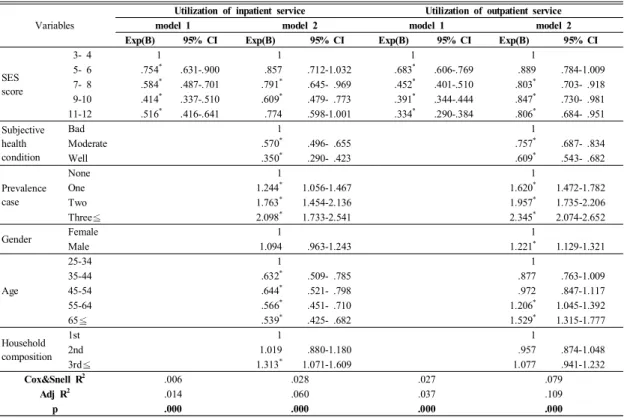
경우3-4점에 비해 5-6점 0.754배, 7-8점 0.584배, 9-10 점0.414배, 11-12점 0.516배 낮게 이용하는 것으로 나 타났다. Model 2의 경우에서는 SES점수가 3-4점에 비 해7-8점 0.791배, 9-10점 0.609배 낮게 이용하는 것으 로, 주관적 건강 상태는 나쁨에 비해 보통이 0.570배, 좋 음0.350배 낮게 이용하는 것으로 나타났다. 현재 유병 질환이 없는 사람에 비해 유병개수가1개인 경우 1.244 배, 2개 1.783배, 3개 이상이 2.098배 높게 이용하는 것 으로, 연령은 25-34세에 비해 35-44세가 0.632배, 45-54 세0.644배, 55-64세 0.566배, 65세 이상이 0.539배 낮 게 이용하는 것으로 분석되며, 가족세대구성은 3세대 이 상이1세대보다 1.313배 높게 이용하는 것으로 나타났 고 통계적으로 유의한 차이가 있었다.
Variables Subjective health state Prevalence
case Health state
Total Bad Moderate Well M±SD M±SD
Gender Male 5,690(100.0) 913( 16.1) 2,914( 51.2) 1,863( 32.7) .85±1.239 .85±3.192
Female 7,916(100.0) 1,798( 22.8) 4,080( 51.5) 2,038( 25.7) 1.23±1.611 1.21±3.848
x
2/t(p) 130.5(.000) 217.1(.000) 132.8(.000)
Age
25-34 1,842(100.0) 223( 12.1) 967( 52.5) 652( 35.4) .29± .571 2.23± .649
35-44 2,697(100.0) 296( 11.0) 1,467( 54.4) 934( 34.6) .36± .666 2.24± .633
45-54 2,667(100.0) 437( 16.4) 1,418( 53.2) 812( 30.4) .65±1.022 2.14± .670
55-64 2,746(100.0) 600( 21.8) 1,436( 52.3) 710( 25.9) 1.34±1.513 2.04± .690
65≦ 3,654(100.0) 1,155( 31.6) 1,706( 46.7) 793( 21.7) 2.09±1.814 1.90± .723
F/x
2(p) 595.0(.000) 1010.7(.000) 239.8(.000)
Household composition
1st 4,851(100.0) 1,232( 25.4) 2,413( 49.7) 1,206( 24.9) 1.53±1.701 1.99± .709
2nd 7,476(100.0) 1,217( 16.3) 3,912( 52.3) 2,347( 31.4) .74±1.192 2.15± .674
3rd≦ 1,279(100.0) 262( 20.5) 669( 52.3) 348( 27.2) 1.25±1.585 2.07± .688
F/x
2(p) 181.0(.000) 458.1(.000) 72.6(.000)
Education
Elementary≧ 3,478(100.0) 1,215( 34.9) 1,679( 48.3) 584( 16.8) 2.01±1.812 1.82± .696 Middle school 1,530(100.0) 385( 25.2) 810( 52.9) 335( 21.9) 1.33±1.553 1.97± .685 High school 4,174(100.0) 647( 15.5) 2,287( 54.8) 1,240( 29.7) .78±1.219 2.14± .657 University≦ 4,424(100.0) 464( 10.5) 2,218( 50.1) 1,742( 39.4) .52± .900 2.29± .644
F/x
2(p) 1045.1(.000) 884.6(.000) 465.5(.000)
Skill level
None 5,559(100.0) 1,518( 27.3) 2,719( 48.9) 1,322( 23.8) 1.51±1.729 1.96± .714
1st 1,276(100.0) 265( 20.8) 689( 54.0) 322( 25.2) 1.28±1.520 2.04± .677
2nd 3,754(100.0) 615( 16.4) 2,063( 55.0) 1,076( 28.6) .83±1.208 2.12± .660
3rd≦ 3,017(100.0) 313( 10.4) 1,523( 50.5) 1,181( 39.1) .48± .878 2.29± .642
F/x
2(p) 1045.1(.000) 394.1(.000) 211.7(.000)
Income
Low 3,265(100.0) 843( 25.8) 1,642( 50.3) 780( 23.9) 1.19±1.558 1.98± .705
Middle-low 3,428(100.0) 695( 20.3) 1,852( 54.0) 881( 25.7) 1.03±1.438 2.05± .676 Middle-high 3.451(100.0) 628( 18.2) 1,792( 51.9) 1,031( 29.9) 1.04±1.475 2.12± .684
High 3,462(100.0) 545( 15.8) 1,708( 49.3) 1,209( 34.9) 1.03±1.439 2.19± .686
F /x
2(p) 186.7(.000) 8.9(.000) 81.6(.000)
SES score
3-4 1,609(100.0) 656( 40.8) 723( 44.9) 230( 14.3) 2.13±1.877 1.74± .693
5-6 3,423(100.0) 944( 27.6) 1,767( 51.6) 712( 20.8) 1.49±1.659 1.93± .692
7-8 3,740(100.0) 602( 16.1) 2,019( 54.0) 1,119( 29.9) .90±1.310 2.14± .664
9-10 2,835(100.0) 324( 11.4) 1,516( 53.5) 995( 35.1) .60±1.014 2.24± .640
11-12 1,999(100.0) 185( 9.3) 969( 48.4) 845( 42.3) .49± .878 2.33± .638
F/x
2(p) 1081.4(.000) 496.2(.000) 472.6(.000)
Total 13,606(100.0) 2,711( 19.9) 6,994( 51.4) 3,901( 28.7) 1.07±1.479 2.09± .692
Table 4. Subjective health condition according to general characteristics
2주 이내 외래서비스 이용 관계를 분석한 결과 Model 1의 경우 3-4점에 비해 5-6점은 0.683배, 7-8점 0.452배, 9-10점 0.391배, 11-12점이 0.334배 낮게 이용하는 것으 로 분석된다.
Model 2의 경우 SES점수는 3-4점에 비해 7-8점이 0.803배, 9-10점 0.847배, 11-12점은 0.806배 낮게 이용 하는 것으로, 주관적 건강상태가 나쁨에 비해 보통은 0.757배, 좋음 0.609배로 낮게 이용하는 것으로 분석된 다. 현재 질환이 없는 사람에 비해 유병 개수가 1개인 경 우1.620배, 2개 1.957배, 3개 이상은 2.345배 높게 이용 하는 것으로 분석되며, 여자에 비해 남자가 1.221배 높 게 이용하는 것으로 나타났다. 연령은 25-34세보다 55-64세가 1.206배, 65세 이상이 1.529배 높게 이용하는 것으로 나타났으며 통계적으로 유의한 차이가 있었다
<표6>.
4. 고찰 및 결론
본 연구는 제6기 국민건강영양조사 자료를 이용하여 25세 이상 성인을 대상으로 사회경제적 특성 및 현재 앓 고 있는 질환과 의료서비스 이용과의 관계를 통합적으로 분석하는데 목적을 두었다.
연구대상자의 일반적 특성을 살펴본 결과 남자보다 여자가 높았고, 연령은 65세 이상이 가장 많았으며, 이 는 제4기 2008년 자료[12], 제5기 통합자료[11]와 비슷 한 결과로 나타났다. 가구세대구성은 2세대 구성이 가장 많았으며 교육수준은 대부분 고졸이상이었다. 2008년 제4기 국민건강영양조사[12]에서 초졸 이하가 50.9%, 한국복지패널 데이터를 활용한 연구[13]에서는 고졸미 만이79.8%, 2010년~2012년까지 제5기 통합자료[11]에 서는 고졸이하가67%로 나타났으며 이와 비교해 본 결 과 2013년 이후 연구대상자의 교육수준이 전반적으로
Variables Utilization of inpatient service Utilization of outpatient service
Exp(B) 95% CI Exp(B) 95% CI
SES score
3- 4 1 1
5- 6 .863 .718- 1.038 .815
*.719- .923
7- 8 .769
*.632- .934 .644
*.567- .732
9-10 .586
*.468- .733 .609
*.531- .699
11-12 .753
*.594- .953 .543
*.467- .633
Prevalence
Hypertension .855
*.735- .995 1.601
*1.460-1.756
Dyslipidemia 1.080 .902- 1.292 1.305
*1.161-1.467
Stroke 1.984
*1.453- 2.709 1.115 .868-1.432
Myocardiac infarction, Angina pectoris 2.081
*1.570- 2.759 1.019 .808-1.284
arthritis 1.515
*1.289- 1.782 1.883
*1.686-2.102
Pulmonary tuberculosis 4.028
*1.211-13.398 1.629 .527-5.035
Asthma 1.333 .924- 1.924 1.356
*1.042-1.763
Diabetes mellitus 1.584
*1.320- 1.902 1.302
*1.144-1.481
Thyroid disease 1.388 .976- 1.974 1.406
*1.100-1.797
Depression 1.334 .987- 1.804 2.031
*1.632-2.528
Atopic dermatitis .858 .485- 1.519 1.471
*1.060-2.040
Allergic rhinitis .995 .809- 1.223 1.299
*1.147-1.470
Renal failure 3.493
*1.845- 6.612 1.024 .567-1.847
Hepatitis B .961 .462- 1.999 1.631
*1.033-2.575
Hepatitis C .337 .038- 3.002 2.251 .629-8.052
Liver cirrhosis 3.902
*1.837- 8.287 1.062 .526-2.144
Osteoporosis 1.097 .797- 1.511 .830
*.662-1.042
Paranasal sinusitis 1.536 .897- 2.629 1.832 1.244-2.698
Otitis media 1.377 .566- 3.346 1.094
*.584-2.049
Cataract .967 .673- 1.391 1.423
*1.113-1.819
Glaucoma 1.024 .464- 2.261 1.891 1.068-3.348
Macular degeneration .554 .068- 4.484 1.471
*.457-4.735
Cancer 4.060
*3.114- 5.292 1.426
*1.118-1.818
Cox&Snell R
2.025 .067
Adj R
2.055 .092
p .000 .000
Table 5. Relation of SES scores, current illness and utilization of medical services
상승된 것으로 사료된다. 직능은 무직이 가장 많이 차지 하였고, 소득분위는 모든 분위에서 비슷한 수준으로 나 타났다. 하지만 교육수준과 직능, 소득분위를 함께 고려 한SES점수에서는 7-8점이 27.5%로 가장 높게 나타났 고 이는 사회경제적 지위의 중간 등급으로 생각되며, 이 와 같은 결과는 직능이 낮더라도 교육수준의 향상과 비 슷한 소득분위로 인해 나타난 결과로 생각된다. 응답자 의 대부분은 주관적 건강상태가 보통이라고 응답하였으 며 이는65세 이상을 대상으로 한 Jeon[13]의 연구 결과 에서 보통이하 정도로 평가하고 있는 것과는 차이를 보 였고, Kim[11]의 제5기 통합자료에서는 보통이라고 생 각하는 응답자가47.7%로 비슷한 결과를 나타냈다. SES 점수가 낮을수록 평균 유병개수는 증가하고 주관적인 건 강상태는 나쁘다고 인식하고 있었으며, 이는 Kim[15]의 소득이 낮을수록 주관적 건강상태가 나쁘며 만성질환의 수가 증가한다는 결과와 일치한다. 평균 현재 유병개수 는1.07±1.479개였고 의료서비스를 이용한 사람보다 이 용하지 않은 사람이 더 많았으며 의료서비스를 이용한 사람 중 외래서비스의 평균 이용횟수는0.50±0.745, 입
이용횟수 보다 낮게 나타났다.
SES점수와 의료서비스 이용과의 관계 결과를 살펴보 면 SES점수가 높을수록 의료서비스의 이용이 낮았다.
이는 점수가 낮을수록 의료서비스를 많이 이용하는 것으 로 생각되며Kim[11]의 연구결과 소득분위와 교육수준 이 낮고, 경제활동이 불안정 할수록 입원서비스의 이용 확률이 높아진다는 것과 비슷하다. 현재 유병과 의료서 비스 이용과 관계를 보면 폐결핵, 간경변, 신부전, 심근 경색, 뇌졸중은 입원서비스 이용이 높았다. 이는 특히 높 은 수준의 의료서비스가 필요한 질환 특성에 의한 결과 로 생각되며, Yoon[16]의 중증 질환군에서 기타 질환군 에 비해 입원서비스 이용 유경험자가 높게 나타난 결과 와 비슷하게 나타났다. 우울증, B형간염, 아토피피부염, 황반변성, 백내장, 갑상선질환, 천식, 이상지질혈증, 알레 르기 비염, 중이염은 외래서비스 이용이 높았고, 이는 질 환이 만성적이거나 특별히 높은 수준의 의료서비스가 필 요하지 않기에 나타난 결과로 사료된다. 관절염과 당뇨 병, 암 질환자는 건강자보다 모든 의료서비스의 이용이 높았고, 이는 질환의 특성상 집중적인 치료가 요구되며
Variables
Utilization of inpatient service Utilization of outpatient service
model 1 model 2 model 1 model 2
Exp(B) 95% CI Exp(B) 95% CI Exp(B) 95% CI Exp(B) 95% CI
SES score
3- 4 1 1 1 1
5- 6 .754
*.631-.900 .857 .712-1.032 .683
*.606-.769 .889 .784-1.009
7- 8 .584
*.487-.701 .791
*.645- .969 .452
*.401-.510 .803
*.703- .918
9-10 .414
*.337-.510 .609
*.479- .773 .391
*.344-.444 .847
*.730- .981
11-12 .516
*.416-.641 .774 .598-1.001 .334
*.290-.384 .806
*.684- .951
Subjective health condition
Bad 1 1
Moderate .570
*.496- .655 .757
*.687- .834
Well .350
*.290- .423 .609
*.543- .682
Prevalence case
None 1 1
One 1.244
*1.056-1.467 1.620
*1.472-1.782
Two 1.763
*1.454-2.136 1.957
*1.735-2.206
Three≦ 2.098
*1.733-2.541 2.345
*2.074-2.652
Gender Female 1 1
Male 1.094 .963-1.243 1.221
*1.129-1.321
Age
25-34 1 1
35-44 .632
*.509- .785 .877 .763-1.009
45-54 .644
*.521- .798 .972 .847-1.117
55-64 .566
*.451- .710 1.206
*1.045-1.392
65≦ .539
*.425- .682 1.529
*1.315-1.777
Household composition
1st 1 1
2nd 1.019 .880-1.180 .957 .874-1.048
3rd≦ 1.313
*1.071-1.609 1.077 .941-1.232
Cox&Snell R
2.006 .028 .027 .079
Adj R
2.014 .060 .037 .109
p .000 .000 .000 .000
Table 6. Relation of SES scores, general characteristics and utilization of medical services
고혈압 질환자의 입원서비스 이용은 낮았고 외래서비스 이용은 높았으며, 골다공증 환자는 외래서비스의 이용이 낮았다.
SES점수와 일반적 특성을 같이 고려하여 의료서비스 이용과의 관계를 살펴보면, 점수가 낮을수록 의료서비스 를 이용도는 높은 것으로 나타났다. 이는 Lee[9]의 저소 득층의 건강상태가 고소득층에 비해 상대적으로 지속적 으로 좋지 않으며, 저소득층의 의료이용 집중현상이 심 화된다는 결과와 비슷하다. 의료서비스의 이용은 주관적 건강상태가 나쁘다고 인식하고, 유병개수가 많을수록 이 용하는 것으로 생각되며, 연령이 높을수록 입원서비스의 이용은 낮고, 외래서비스의 이용은 높게 나타났다.
Park[14]은 연령이 높을수록 건강상태에 대하여 나쁘게 인식하며, 만성질환의 수가 많아진다고 하였는데 본 연 구에서 만성질환자들의 외래서비스 이용이 높게 나타난 결과와 비슷한 의미를 나타낸다고 생각된다.
본 연구의 결과를 정리하면, 일반적 특성에 따라 현재 유병 및 주관적 건강상태는 유의한 차이가 있었고, 연령 이 높을수록, 교육수준과 직능, 소득분위 및 SES점수가 낮을수록 평균 유병개수는 많고 주관적 건강상태는 나쁘 게 인식하는 것으로 나타났다. SES점수가 높을수록 전 반적인 의료서비스의 이용이 낮았고, 이는 사회경제적 특성이 낮을수록 의료서비스의 이용이 높은 것으로 나타 났다. 기존의 연구에서 소득분위 및 교육수준, 연령이 낮 고 경제활동이 불안정할수록 주관적 건강상태를 나쁘게 인식하고 만성질환의 수가 높아진다는 결과와[2-20]
상응하는 것으로 나타났다. 현재 앓고 있는 질환이 중증 일수록 입원서비스를 이용하고 만성일수록 외래서비스 를 이용하는 것으로 나타났고, SES점수가 낮을수록 의 료서비스의 이용이 높게 나타났다. 주관적 건강상태가 나쁘게 인식되고 유병개수가 많을수록 의료서비스의 이 용이 높았고, 연령이 높을수록 입원서비스의 이용은 낮 게 외래서비스의 이용은 높게 나타났다. 이와 같은 결과 를 토대로 사회경제적 특성이 낮은 집단에게 질환을 예 방할 수 있는 적절한 보건교육 프로그램을 개발하여 질 환에 노출되었을 때 적정한 의료서비스를 이용할 수 있 도록 지역사회기반의 적절한 보건서비스 체계의 구축 및 시행의 필요성을 시사 할 수 있겠다.
본 연구는 전 국민을 대상으로 시행된 국민건강영양 조사를 이용한 자료로 표본추출이 체계적으로 이루어졌 기에 대표성을 가질 수 있다는 장점이 있다. 그러나 조사
당시 의료서비스 이용의 시기가 다른 점과 연구대상자의 주관적 응답인 점을 고려하였을 때 객관적인 이용정도를 추출하는데 한계가 있다.
사회경제적 요소에 따른 의료서비스 이용에 대한 연구 는 보건의료의 중요한 가치 중 하나인 형평성을 알아보기 위한 방법의 일환으로 지속적으로 시행되어야 하며, 시계 열 자료를 이용한 의료서비스의 이용 변화 양상과 사회경 제적 요소로 인해 나타나는 시대적 양상을 잘 파악하고, 의료정책에 따른 의료서비스 이용의 효과에 대하여 알아 보는 연구가 지속적으로 수행되어야 할 것이다.
References
[1] C. Y. Kim, “Health and Healthcare in Welfare State:
Social Justice as a New Principle”, Korean Economic Journal, vol. 50, no. 3, pp. 233-234, 2011.
[2] Y. J. Lee 2010, “A Equity in Health Care Utilization by Health Status”, Korean Association of Social Policy, vol.
17, no. 1. p.269, 2010.
[3] D. Y. Kim, “A study on the Effects of Socioeconomic Status on Health Level and Medical Service Use”, Institute for Humanities and Social Sciences, vol. 16, no.
4, p.330, 2015.
[4] Bradley, Robert, “Socioeconomic Status and Child Development”, Annual Review of Psychology, 53.
[5] Erica Goode. 13 April. “For Good Health, it Helps to be Rich and important.” New York Times[Internet], Available From:
http://query.nytimes.com/gst/fullpage.html
[6] J. J. Kim, J. H. Oh, O. R. Moon, S. M, Kwon,
“Quantitative and Qualitative Difference in the Utilization of Health Care-Based on the Survey of Gwangju-Jeonnam Residents-”, Korean J. of Health Policy & Administration, vol. 17, no. 3, pp. 26-49, 2007.
DOI: https://doi.org/10.4332/KJHPA.2007.17.3.026 [7] S. H. Eom, C. G. Moon, “Income-Related Inequalities in
Health Care Finance and Self-Assessed Health in Korea from 1999 Based on KLIPS Survey Data”, The Korean Association of Health Economics and Policy, vol. 16, no.
1, pp. 35-61, 2010.
[8] K. H. Rhim, J. H. Lee, “Income-related inequality in medical care utilization by provider types”, The Korean Journal of Health Economics and Policy, vol. 16, no. 2, pp. 39-56, 2010.
[9] Y. J. Lee, C. W. Park, “A Equity Changes in Health Care Utilization According to Health Status”, Social Welfare Policy, vol. 38, no. 1, pp. 33-55, 2011.
DOI: https://doi.org/10.15855/swp.2011.38.1.33 [10] J. G. Kim, “Comparisons of the Equity of Medical Care
Utilization by Sex, Age Groups, and Region”, Korean Journal of Social Welfare Studies, vol. 43, no. 2, pp.
319-344, 2012.
DOI: https://doi.org/10.16999/kasws.2012.43.2.319 [11] D. Y. Kim, “A Study on the Effects of Socioeconomic
Status on Health Level and Medical Service Use”, Institute for Humanities and Social Sciences, vol. 16, no.
4, pp. 329-369, 2015.
DOI: https://doi.org/10.15818/ihss.2015.16.4.329 [12] Y. C. Lee, B. H. Im, Y. H. Park, “The Determinants and
Comparison of Health Behavior and Health Service by Private Medical Insurance on National Health=Nutrition Survey”, Journal of The Korea Contents Association, Vol. 10, no. 12, pp. 190-204, 2010.
DOI: https://doi.org/10.5392/JKCA.2010.10.12.190 [13] H. S. Jeon, S. K. Kahng, “The Effects of Medical
Service Utilizations on Life Satisfaction among the Elderly: Focusing on the Moderating Effects of the Presence of Chronic Illnesses”, Journal of the Korean Gerontological Society, vol. 31, no. 4, pp. 1247-1263, 2011.
[14] E. J. Park, “Self-rated Health and Health Service Utilization of Chronic disease Patients”, Korea Information Electron Communication Technology, vol. 9, no. 4, pp. 404-413, 2016.
DOI: https://doi.org/10.17661/jkiiect.2016.9.4.404 [15] D. Y. Gim, “Analysis of Gaps in th Utilization of Health
Care Service according to Health Status between Income Classes”, Social Science Studies, vol. 36, no. 1, pp.
119-156, 2012.
[16] Y. J. Yoon, “Trend of Horizontal Equity in Health Care Utilization and Incidence of Household Catastrophic Health Expenditure”, pp. 11-29, The Graduate School of Public Health Seoul National University, 2012.
[17] E. S. Ahn, J. M. Hwang, M. S. Shin, “Denral Utilization Associated Factors among Elderly”, The Korean Society of Dental Hygiene Science, vol. 15, no. 1, pp. 60-66, 2015.
DOI: https://doi.org/10.17135/jdhs.2015.15.1.60 [18] M. J. Oh, Y. J. Kim, J. G. Lee, Y. H. Yi, Y. J. Tak, H.
R. Hwang, S. H. Lee, “ The Health Behavior and Status according to Household Income Level in Korean Women Aged 35 Years or Older: the 2013 National Health and Nutrition Examination Survey”, The Korean Society of Health Promotion and Disease Prevention, vol. 17, no.
1, pp. 20-30, 2017.
DOI: https://doi.org/10.15384/kjhp.2017.17.1.20 [19] H. J. Lee, S. I Huh, “Unmet Health Care Needs and
Impact of Type of Household among the Elderly in Korea:, The Korean Journal of Health Economics and Policy, vol. 23, no. 2, pp85-108, 2017.
[20] J. H. Moon, M. A. Kang, “The Prevalence and Predictors of Unmet Medical Needs among the Elderly Living Alone in Korea: An Application of the Behavior Model for Vulnerable Populations”, Health and Social Welfare Review, vol. 36, no. 2, pp. 480-510, 2016.
DOI: https://doi.org/10.15709/hswr.2016.36.2.480
이 고 은(Ko-Eun Lee) [정회원]
•2013년 2월 : 부산가톨릭대학교 일
반대학원 병원경영학과 (보건학석사)
•2017년 2월 : 부산가톨릭대학교 일 반대학원 병원경영학과(보건학박사 수료)
<관심분야>
보건학
임 복 희(Bok-Hee Im) [정회원]