1. INTRODUCTION
Customer relationship and loyalty is the most central issue in service marketing (Rust & Huang, 2011). Customer is consi- dered a powerful means of establishing firm’s assets (Gupta
& Lehmann, 2005). Especially the competition in the market become more severe, as the value of the customer’s contribu- tion essentially becomes the value of the business (Reichheld, 2003). Based on this background, the concept of customer equity was raised; “the total of the discounted customer life- time values summed over all of the firm’s customers” (Blatt- berg & Deighton,1996). In other words, an increase in the
customer’s equity maximizes the assets of the business (Vargo
& Lush, 2004; Boulding et al., 2005; Gupta & Lehmann, 2005;
Payne and Frow, 2005; Rogers, 2005; Vogel et al., 2008).
The customer equity framework suggest that three factors are of particular importance in building a loyal customer base, value equity, brand equity and relationship equity (Rust et al., 2004). Previous empirical studies also report positive link between these customer equity drivers and loyal intentions (Rust et al., 2004; Vogel et al., 2008)-though only in order to maximize the value customers.
This situation can be applied to foodservice industry. Eating- out market has significantly grown, it faced severe compe- Information available at the Culinary Society of Korea (http://www.culinary.re.kr/)
Culinary Science & Hospitality Research
Journal & Article Management System: https://cshr.jams.or.kr/
21-28
http://dx.doi.org/10.20878/cshr.2018.24.2.007
A Study on the Effect of Customer Equity on Behavioral Intentions: Moderating Effect of Restaurant Type
Sun Lyung Lee
1, Young Namkung
2& Hye Hyun Yoon
21
Dept. of Hotel & Tourism Management, Woo Song University, South Korea
2
Dept. of Culinary Arts and Service Management, Kyung Hee University, South Korea
KEYWORDS ABSTRACT
Customer equity, Value equity, Brand equity, Relationship equity, Restaurant type.
The value of the customer’s contribution essentially becomes the value of the dining industry in Korea. Therefore, an increase in the customer’s equity maximizes the assets of the business. The purpose of this study intends to examine relationships between customer equity and behavioral intentions in restaurant industry and verify the moderating effect of restaurant type. This study takes an integrated perspective on prior literature on customer equity, as well as on aspects of the general restaurant industry related to customer equity, thereby defining the concept of customer equity in a way that reflects the characteristics of the dining industry. A total of 420 patrons in Korea participated. The results showed a positive relationship between brand equity, relationship equity and behavioral intentions. There were moderating effects related to restaurant type in the causal relationships between behavioral intentions. The components of customer equity and relationship equity in casual dining restaurants, and value equity and brand equity in quickservice restaurants significantly by customers differs according to restaurant type. Limitations and future research directions are also discussed.
*
This study is based on data and literature review of my doctoral thesis at the Kyunghee University.
Corresponding author: Hye Hyun Yoon, Dept. of Culinary Science Arts and Service Management, Kyung Hee University, 26, Kyungheedae-ro,
Dongdaemun-gu, Seoul 02447, South Korea, Tel. +82-2-961-9403, Fax. +82-2-964-2537, E-mail: [email protected]
tition. Accordingly, it is critical for foodservice companies to not only attract customers but also maintain and activate exis- ting customers to generate profits. Therefore, companies must recognize the importance of customer equity as financial assets for measuring and managing customers to maximize companies’ tangible and intangible assets based on customer relationships. In recently, the core competency of restaurant businesses is to strengthen customer relationships and attract customer attention (Venkatesh et al., 2003), so that profits are generated by retaining and enticing existing customers (Rei- chheld, 2003). Customers who evaluate a product objectively and or subjectively, might not buy it again in the future for several reasons, including changes in individual situations and the effects of other companies’ marketing efforts (Oliver, 1999). In recent years, customer lifetime value (CLV) and its implications have received increasing attention (Berger & Nasr 1998; Reinartz & Kumar, 2000). Consequently, “customer equity” has been one of the most discussed concepts in the foodservice marketing literature in recent years.
Also, restaurant type is another important consideration. A casual dinning restaurant is higher quality of foods and peo- ple service than a quickservice restaurant. And quickservice restaurant is faster service and cheaper price than a casual dinning restaurant (Anderson, 2003). So, there is a significant difference between them. The components of customer equity which include service quality, food quality, brand awareness, and trust have different levels of influence on the intention to revisit. Therefore, it is necessary to examine the moderating effects according to restaurant type.
Some studies have been conducted in the hospitality in- dustry regarding the components of customer equity, such as value equity (Chen and Hu, 2010; Ryu et al., 2008; Ha & Jang, 2012), brand equity (Namkung & Jang, 2013; Tasci & Guillet, 2011) and relationship equity (Hu et al., 2010; Tanford, 2013).
Nevertheless, these components have synthetically effected on the customer, research on integrated customer equity is rare in hospitality industry. Unlike previous studies related to customer equity, this study’s largest differentiation factor is that it synthetically examines non-financial and financial data in reviewing significant customer equity according to restau- rant type. Therefore, this study needed to examine the com- ponents of customer equity and the relationship between the intention to revisit in the restaurant market conditions in which customer importance has increased and customers are perceived as the customer equity.
This current research aimed to compose value equity, brand equity, and relationship equity of the components of custo- mer equity as sub-factors appropriate for the foodservice industry field in order to establish a hypothesized relationship between each component and behavioral intentions. In addi- tion, in order to examine the differences between compo- nents of customer equity and structural relations according to the service levels of foodservice companies, an analysis was conducted according to restaurant types. The specific objec- tive of this study is to examine how customer equity in restau- rants (i.e., value equity, brand equity, and relationship equity) affect behavioral intentions. As well as to investigate the mo- derating role of restaurant type (namely, casual dining restau- rant and quickservice restaurant).
2. LITERATURE REVIEW
2.1. Customer Equity
Customer equity is defined as “the total of the discounted customer lifetime values summed over all of the firm’s custo- mers” (Blattberg & Deighton, 1996, p132). Thus, customers are seen as the intangible assets a firm should measure, maintain, and maximize just like other financial assets (Blattberg et al., 2001). In one of the major studies on customer equity, Rust et al. (2000) identified customer equity drivers’ model as in- volving three constructs: value equity, brand equity, and relationship equity.
In the context of hospitality field, several researches have attempted to understand customer equity (Hyun, 2009; Kasa- vana & Knutson, 2000; Severt & Palakuthi, 2008; Wong, 2013;
Wu & Li, 2011).
Kasavana and Knutson (2000) frequent diner programs allow
restaurants to gain valuable marketing insights while rewar-
ding customer loyalty. A logical extension of point-of-sale te-
chnology, frequent diner software is a major key to effectively
reducing marketing costs at the same time it builds relation-
ship marketing. Severt and Palakuthi (2008) found that to de-
termine the value a convention center provides its customers,
the brand the center offers, and the importance of the custo-
mer/business relationship. Value, brand, and relationship equity
are components of customer equity. This study is the first
study to identify the drivers and sub-drivers of customer
equity in the convention industry. Meeting planners confir-
med value equity as the most important in the customer to
business exchange. Relationship equity followed with brand
equity as the least important of the three. Meeting planners identified the sub-drivers included: reputation and awareness of the convention center. Relationship equity sub-drivers in- cluded: the interactions, responsiveness, and special treatment received from the convention center personnel. Hyun (2009) found that to create and test a model of customer equity model for chain restaurant brand formation. It has long been acknowledged that managing and enhancing customer equity influences a company’s shareholder value, which is a reflec- tion of long-term financial performance. Wu and Li (2011) found that 688 effective questionnaires produces two main findings. Customer relationship marketing (CRM) has a po- sitive influence on relationship quality has a positive influence CLV. Consumer groups with different hotel preferences reveal a partial interference effect on the relationships among CRM, relationship quality, and CLV. In other words, different hotel preferences create significant differences in the strength of partial relationship paths. Wong (2013) found that exploring customer equity and the role of service experience in the ca- sino service encounter. This article adopts the customer equity framework to study how service experience shapes customer satisfaction and loyalty in the casino service encounter. An empirical model is developed to examine the direct and indirect roles of service experience equity, relationship equity, brand equity, and customer satisfaction on loyalty outcomes.
2.2. Drivers of Customer Equity and Behavioral Intentions
2.2.1. Value Equity
Value equity is “the customer”s objective assessment of utility of brand based on perceptions of what is sacrificed for what is received” (Rust et al., 2000, p 59). It is based on the customer’s perceived value of a product or service quality (Zeithaml, 1988). Three key elements that comprise value equity: quality, price, and convenience (Rust et al., 2001). Qua- lity refers to consumers’ perceptions of the overall excellence or the superiority of a product (Zeithaml, 1988). Price repre- sents the monetary costs for purchasing a product and conve- nience relates to consumers’ time and search costs (Rust et al., 2000). However, these key elements are inadequate for the restaurant industry. Previous researchers used multidimensio- nal attributes; food quality, service, physical evidence, to measure restaurants’ quality. (Namkung & Jang, 2008; Ryu and Han, 2010). In this context, Hyun (2009) suggest that value equity is composed of quality of food, service quality, price
of a restaurant, convenience of restaurant and environment.
Thus, this study integrates four items to measure value equity:
food quality, service quality, physical evidence, and price.
Previous studies have also provided empirical evidence with respect to the positive impact of value equity on consumers’
behavioral intentions in various service settings, including retail stores (Sweeney et al., 1999), airlines (Sirdeshmukh et al., 2002). Several researchers have found that perceived value had a positive impact on behavioral intentions in the restau- rant industry (Kwun & Oh, 2004; Ryu & Han, 2011; Tam, 2004).
Based on these results, this study assumes that value equity positively affects behavioral intention, as indicated in the following hypothesis:
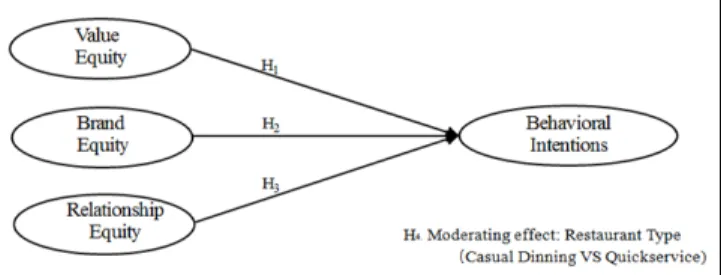
Hypothesis 1: Value equity is positively related to behavioral intentions.
2.2.2. Brand Equity
Brand equity is defined as a set of symbols, that add to or subtract from the value provided by a product or service to a firm and/or to the firm’s customers (Aaker, 1991, p5).
Keller(1993, p2) stated that brand equity is “the differential effect of brand knowledge on customer response to the marketing of the brand.”
Previous studies have demonstrated that the brand/store image has a significant impact on customers’ perceived value, satisfaction, and revisit intention (Andreassen & Lindestad, 1998;
Bloemer and Reyter, 1998; Cretu and Brodie, 2007; Lai et al., 2009; Patterson and Spreng, 1997; Ryu et al., 2008).
The relationships between brand equity and behavioral intentions were examined by Washburn and Plank (2002), who found significant correlations among the dimensions of brand equity and behavioral intentions. In addition, Kim et al.
(2008), the authors discovered that hotels with a high level
of brand awareness/association will be patronized by their
loyal customers. In other words, hotel brand equity is posi-
tively related to behavioral intentions. Three dimensions of
brand equity (brand awareness, image, and attitude) have a
significant impact on behavioral intentions. Brand Equity
levels are known to lead to higher consumer preferences and
purchase intentions (Cobb-Walgren et al., 1995). Brand atti-
tude should be an antecedent of customer satisfaction and
behavioral intentions when it is treated as a pre-purchase
construct. Empirical studies have also supported the impact
of brand attitude on behavioral intentions (e.g. Hellier et al.,
2003; Suh & Yi, 2006). For example, Hellier et al. (2003) exa- mined satisfaction, and behavioral intentions using data collected from 6,923 retail customers. According to the results of the structural equation modeling analysis, although custo- mer satisfaction does not influence behavioral intentions directly, it does so indirectly via brand attitude. Suh and Yi (2006)’s study replicated and further extended this research by examining the relationships among customer satisfaction, attitude toward advertising, corporate image, brand attitudes, and loyalty in retail industry settings. The study analyzed data collected from 420 consumer panels and found that brand attitude fully mediates the effects of advertising attitude and corporate image on loyalty. It was concluded that brand atti- tude has a positive impact on customer behavioral intentions.
Hypothesis 2: Brand equity is positively related to beha- vioral intentions.
2.2.3. Relationship Equity
Relationship equity is defined as “the tendency of the cus- tomer to stick with the brand, greater than the customer’s objective and subjective assessment” (Rust et al., 2000, 2004, p54). Compared to a relationship-quality theory, Relationship equity refer to a large extent to the relationship between the customers and the enterprise. For example, Rust et al. (2001) suggested that Relationship equity involves the elements that link a customer to a brand or a company, and Sawhney and Zabin (2002) proposed that relationship equity takes a broa- der view of relationships to include relationship with all key stakeholders with which the firm relates, Vogel et al. (2008) point out that relationship equity is commonly built around financial and recognition incentives. Therefore, relationship equity is a key determinant of customer equity in the sense that building a customer relationship increases the possibility that the customer will continue to choose the company, thereby increasing customer loyalty (Blattberg et al., 2001;
Reichheld, 1996).
In conceptualizing relationship equity, consist of the trust (Dwyer et al., 1987; Crosby et al., 1990; Hennig-Thurau & Klee, 1997; Rust et al., 2004; Hyun, 2009), commitment (Hennig- Thurau and Klee, 1997; Hyun, 2009), loyalty program (Rust et al., 2004; Mascarenhas et al., 2006) and commitment (Morgan and Hunt, 1994; Goodmans & Dion, 2001; Leu & Hsieh, 2000).
In the context of restaurants, several researchers have attempted to understand relationship equity. Rust et al. (2004)
proposed that frequent buyer card (loyalty program), sense of community, and waitstaff’s knowledge of customers’ names, and the menu are key factors in evaluating relationship equity.
Hyun (2009) found that relationship equity is formed by trust, affective commitment, satisfaction, and conflict. Thus, this study integrates three items to measure relationship equity:
a loyalty program, trust, and an affective commitment. In previous research, these factors have been shown to relate to behavioral intentions.
Trust means that the customers believe sales personnel will provide them with long-term benefits and service (Crosby et al., 1990). Lee and Kim (1999) asserted that trust is a cus- tomer’s confidence in the quality and reliability of the service provided by the organization. Loyalty programs are becoming increasingly important for service organizations to promote relationships and to achieve sustainable loyalty (Mascarenhas et al., 2006). Finally, commitment to the relationship on the part of both partners is a key factor in successful relationship quality in the long run, and helps enhance long-term benefits (Morgan & Hunt, 1994). Moorman et al. (1993) and Goodmans and Dion (2001) concluded that commitment occurs when one of the partners wants to continue and reinforce the re- lationship. Leu and Hsieh (2000) found that Relationship qua- lity has a significant influence on customer usage quantity, loyalty, product purchase intentions and on word of mouth.
Thus relationship quality is formed by commitment, trust, and satisfaction.
In the context of restaurants, several researchers have attempted to understand relationship equity. Hyun (2009) found that relationship equity in restaurant, examines items measuring four factors: trust, affective commitment, satis- faction, and conflict.
Based on previous studies on relationship equity, this study assumes that relationship equity will have a significant effect on behavioral intentions and following hypotheses are pre- sented:
Hypothesis 3: Relationship equity is positively related to behavioral intentions.
2.3. Moderating Effect of Restaurant Type
Depending on the type of restaurant, there is a difference in the service level: quickservice service restaurant and casual dinning restaurant.
Jang and Mattila (2005) results were consistent across res-
taurant type (quickservice versus casual dinning). The findings of this study suggest that restaurant operators in the casual dining and fast-food segments should consider employing immediate, necessary, and monetary rewards as opposed to points-system, luxury, and non-monetary rewards. In terms of motivation to join loyalty reward programs, the study results indicate that casual dining patrons are looking for exciting and entertaining rewards in addition to mere cost savings.
Ha and Jang (2012) applied a means-end chain approach to identify underlying consumer values across three different restaurant segments. The participants responded to questions in a one-on-one interview procedure regarding attributes of restaurants, consequences, and values. The results suggested that attributes of quickservice restaurants were largely asso- ciated with convenience, success, and economic values; attri- butes of casual dining restaurants were related to emotional and belonging value; and attributes provided by fine dining restaurants were linked to emotion and quality life values.
A quickservice restaurant emphasizes prompt service and relatively low food costs, and customers expect to eat their food directly from disposable containers. Previous studies examining perceived quality or customer satisfaction indicated that customers visiting fast food restaurants considered seve- ral attributes important, such as low prices, friendliness of personnel, prompt service, convenience, business hours, take- out service, location, etc (Bonjanic, 2007; Gilbert et al., 2004;
Knutson, 2000). These attributes of quickservice restaurants emphasize convenience and efficiency, which are the most prominent characteristics of the quickservice segment. Custo- mer equity drivers are likely to have similar influences on purchase intention as well (Kim & Ko, 2011). Based on the above review, the following hypotheses are proposed:
Hypothesis 4: The relationship among customer equity drivers and behavioral intentions in restaurant type are different.
Fig. 1. A proposed model of value equity, brand equity, relationship equity, behavioral intentions.
3. METHODS
3.1. Sample and Data Collection
The data used for the current study were collected from customers in casual dining restaurants in Seoul, the capital of Korea, in 2012. In order to comply with our objectives and test our research hypotheses, we designed a study based on a personal survey of the casual dining restaurant and quickser- vice restaurant customers. Five ranked casual dining and quick- service restaurants were chosen in terms of sales in 2011. A pilot test using 50 customers was conducted to ensure the reliability of the scales, and several modifications were made based on feedback from the pilot test. The final questionnaire instrument included 31 items divided into four parts. The data collection was carried out in the period from 1 to 15 February 2012. With the cooperation of the managers of the casual dining restaurants involved, a questionnaire survey was con- ducted on customers waiting for their dessert. A total of 500 questionnaires were distributed to visitors of these casual di- ning and quickservice restaurants. We told the participants either verbally in groups, or in cover letters, that their responses were anonymous. We assured respondents there were no right or wrong answers to maximize the likelihood that we would receive honest answers and from them. After eliminating unusable responses among the completed questionnaires, 420 responses were coded for data analysis (82% response rate).
3.2. Instrument Development
Multiple items scales were used to measure each construct in this study. The survey instrument for this study was com- prised of four parts. The first three parts pertained to Custo- mer Equity(value equity, brand equity, relationship equity) of customers, behavioral intentions. (Likert 7-point scale was used to measure). Part four contained questions about partici- pant demographic information (e.g., gender, age, education level and visiting frequency in a month).
3.3. Customer Equity
The definitions and measures for customer equity by Rust
et al. (2004), Vogel et al. (2008) and Hyun (2009) were
adopted in the instrument used for this study. This study
examines three dimensions of value equity, brand equity,
relationship equity. Value equity was measured using twelve
items including: “Food presentations is attractive (food qua-
lity)”, “Employees are always willing to help me (service quality)”, “The price is reasonable (price)”, “The environment is clean (physical evidence)” and so on. Brand Equity was measured seven items including: “I can recognize the restau- rant brand among other competing brands (awareness)”, “The restaurant brand has a different image from other restaurant brands (image)”, “I have seen advertising about this restaurant (activity)” and so on. Relationship equity was measured using nine items including: “This restaurant provide loyalty program (loyalty program)”, “I can trust the restaurant to treat me fairly (trust)”, “: I feel emotionally attached to this restaurant (affec- tive)” on a 7-point scale (1:strongly disagree to 7: strongly agree) based on Rust et al. (2004), Vogel et al. (2008) and Hyun (2009).
3.4. Behavioral Intentions
Behavioral intentions were examined in terms of future return intentions, and word-of mouth(WOM) recommenda- tions. Each behavioral intention was measured using four item (1:strongly disagree to 7: strongly agree), including “I will certainly visit this restaurant again” (revisit intention); “I will recommend this restaurant to friends and acquaintances”
(WOM recommendation).
3.5. Data Analysis
Descriptive statistics were performed to profile the respon- dent demographic questions. Following the two-step approach recommended by Anderson and Gerbing (1988), a confirma- tory factor analysis (CFA) with maximum likelihood was first performed to estimate the measurement model, which deter- mined whether the manifest variables reflected the hypo- thesized latent variables. Once the measure was validated, a structural equation model(SEM) was utilized to test the vali- dity of the proposed model and hypotheses.
4. RESULTS
4.1. Descriptive Statistics of The Sample
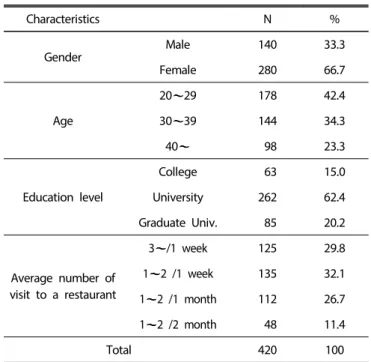
The profiles of the sample are presented in Table 1. Res- pondents were 33.3% male and 66.7% female. In terms of age, 42.4% of the respondents were 20 29 years old, 34.3.% were 30 39, and 23.3% were 40 or older. Most respondents (82.6%) were highly educated, holding at least a university degree.
The majority (61.9%) of respondents visited a restaurant 1 2
Table 1. General characteristics of samples
Characteristics N %
Gender
Male 140 33.3
Female 280 66.7
Age
20 29 178 42.4
30 39 144 34.3
40 98 23.3
Education level
College 63 15.0
University 262 62.4
Graduate Univ. 85 20.2
Average number of visit to a restaurant
3 /1 week 125 29.8
1 2 /1 week 135 32.1
1 2 /1 month 112 26.7
1 2 /2 month 48 11.4
Total 420 100
times per week.
4.2. Validity and Reliability Test
Following Anderson and Gerbing’s (1988) two-step ap- proach, a CFA was first undertaken to assess the fit of the five-factor model, which was comprised of customer satisfac- tion, loyalty, switching intent, variety-seeking orientation, and purchase decision involvement. Based on CFA results, we analyzed convergent validity, discriminant validity, and relia- bility of all the multi-items, following the guidelines in pre- vious research (Nunnally, 1978; Fornell & Larcker, 1981; Ander- son and Gerbing, 1988).
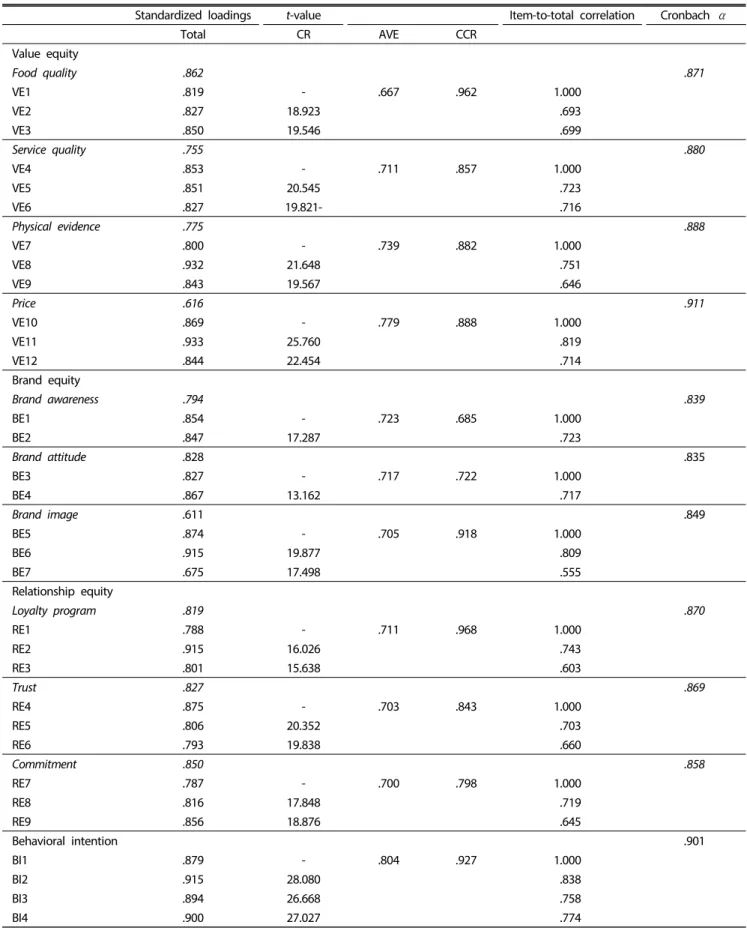
As shown in Table 2, the level for internal consistency in each construct was acceptable, with Cronbach’s alpha esti- mates ranging from 0.835 to 0.911 (Nunnally, 1978). Compo- site reliabilities, ranging from 0.685 to 0.968, were consider- able acceptable (Fornell & Lacker, 1981; Nunnally and Bern- stein, 1994). In addition, all variance extracted estimates, ranging from 0.667 to 0.804 exceeded the recommended 0.50 threshold (Fornell & Larket, 1981).
Convergent validity was confirmed because all confirmatory
factor loading exceeded 0.70 and all were significant at the
alpha level of 0.001 (Anderson & Gerbing, 1988). Discriminant
validity was assessed by comparing the average variance ex-
tracted (AVE) with the squared correlation between cons-
trcucts (Fornell & Larcker, 1981). Discriminant validity was evi-
Table 2. Confirmatory factor analysis and reliability analysis results
Standardized loadings
t-valueItem-to-total correlation Cronbach α
Total CR AVE CCR
Value equity
Food quality .862 .871
VE1 .819 - .667 .962 1.000
VE2 .827 18.923 .693
VE3 .850 19.546 .699
Service quality .755 .880
VE4 .853 - .711 .857 1.000
VE5 .851 20.545 .723
VE6 .827 19.821- .716
Physical evidence .775 .888
VE7 .800 - .739 .882 1.000
VE8 .932 21.648 .751
VE9 .843 19.567 .646
Price .616 .911
VE10 .869 - .779 .888 1.000
VE11 .933 25.760 .819
VE12 .844 22.454 .714
Brand equity
Brand awareness .794 .839
BE1 .854 - .723 .685 1.000
BE2 .847 17.287 .723
Brand attitude
.828 .835
BE3 .827 - .717 .722 1.000
BE4 .867 13.162 .717
Brand image
.611 .849
BE5 .874 - .705 .918 1.000
BE6 .915 19.877 .809
BE7 .675 17.498 .555
Relationship equity
Loyalty program .819 .870
RE1 .788 - .711 .968 1.000
RE2 .915 16.026 .743
RE3 .801 15.638 .603
Trust .827 .869
RE4 .875 - .703 .843 1.000
RE5 .806 20.352 .703
RE6 .793 19.838 .660
Commitment .850 .858
RE7 .787 - .700 .798 1.000
RE8 .816 17.848 .719
RE9 .856 18.876 .645
Behavioral intention .901
BI1 .879 - .804 .927 1.000
BI2 .915 28.080 .838
BI3 .894 26.668 .758
BI4 .900 27.027 .774
Goodness-of-fit statistics: χ
2=1,016.876 (df=448); CMIN/df=2.270; GFI=.863; NFI=.908; CFI=.946; TLI=.941; RMSEA=.055; IFI=.947.
Note: All correlations are significant at p<.001(2-tailed).
Table 3. Correlation analysis
1 2 3 4
1. Value equity 1
2. Brand equity .645
**1
3. Relationship equity .552
**.591
**1
4. Behavioral intention .710
**.699
**.618
**1
** p<.001.
dent because the variance extracted estimate, ranging from 0.667 to 0.884 exceeded all squared correlations for each pair of constructs, which ranged from 0.426 to 0.804. These results indicates that the five factors are distinct and unidimensional.
Also, confirmatory measurement models demonstrated the soundness of measurement properties (GFI=.863; NFI=.908; CFI=
.946; TLI=.941; RMSEA=.055; IFI=.947).
4.3. Structural Equation Modeling
Structural equation modeling (SEM) was conducted to test the validity of the proposed model and the hypotheses. The structural parameter estimates are presented in Table 4. The chi-square statistic indicated that the model did not fit the data well (χ
2=252.376, df=67, p<.001). Given the sensitivity
Table 4. Structural equation modeling Standardized
estimates
t-value
p-
value Value equity Behavioral intentions .185 1.773 .065 Brand equity Behavioral intentions .399 2.634
**.009 Relationship equity
Behavioral intentions .332 2.375
*.016
Goodness-of-fit statistics: χ
2=252.3763(df=67); CMIN/df=3.767; GFI.=
918; NFI=.935; CFI=.951; RMSEA=.080; IFI=.951.
* p<0.05, ** p<0.01.
Table 5. Moderating effect of the restaurant types
Casual dining restaurant Quickservice restaurant Baseline model χ
2(df=134)
Nested model χ
2(df=135)
χ
2(df=1)
β
t-valueβ
t-valueVE BI .173 1.176 .304 2.127
*299.806
300.625 .819
BE BI -.047 -.215 .529 2.232
*306.978 7.172
*RE BI .780 3.169
**.108 .562 307.813 8.007
*Goodness-of-fit statistics : χ
2=299.806(df=134); CMIN/df=2.237; GFI.=904; NFI=.922; CFI=.955; RMSEA=.054; IFI=.955.
* p<0.05, ** p<0.01.