1) Department of Civil Engineering Chungnam National University
† Department of Civil Engineering Chungnam National University (Corresponding Author : [email protected])
A Study on Rainfall Induced Slope Failures:
Implications for Various Steep Slope Inclinations
Xuan Khanh Do1)・ Kwansue Jung†・ Giha Lee2)・ Ram Krishna Regmi3) Received: January 4th, 2016; Revised: January 5th, 2016; Accepted: April 4th, 2016
ABSTRACT : A rainfall induced slope failure is a common natural hazard in mountainous areas worldwide. Sudden and rapid failures which have a high possibility of occurrence in a steep slope are always the most dangerous due to their suddenness and high velocities. Based on a series of experiments this study aimed to determine a critical angle which could be considered as an approximate threshold for a sudden failure. The experiments were performed using 0.42 mm mean grain size sand in a 200 cm long, 60 cm wide and 50 cm deep rectangular flume. A numerical model was created by integrating a 2D seepage flow model and a 2D slope stability analysis model to predict the failure surface and the time of occurrence. The results showed that, the failure mode for the entire material will be sudden for slopes greater than 67°; in contrast the failure mode becomes retrogressive. There is no clear link between the degree of saturation and the mode of failure. The simulation results in considering matric suction showed good matching with the results obtained from experiment. A subsequent discarding of the matric suction effect in calculating safety factors will result in a deeper predicted failure surface and an incorrect predicted time of occurrence.
Keywords : Slope failure, Landslide, Steep slope, Rainfall, Experimental, Numerical Journal of the Korean Geo-Environmental Society
17(5): 5~16. (May, 2016) http://www.kges.or.kr
ISSN 1598-0820 DOI http://dx.doi.org/10.14481/jkges.2016.17.5.5
1. Introduction
A rainfall induced slope failure is one of the most serious natural hazards worldwide due to the adverse impacts on localized people and properties. The importance of this hazard will certainly increase with the effects of climate change and further expansion of human activities in to upland areas (Korup, 2002). The effects of a failure increase remarkably with its velocity and traveling distance. In general, gradual slow and retrogressive failures are less threatening to human life compared to those occurring suddenly and rapidly. However, in either case, the potential for huge devastation always exists (Regmi et al., 2014). Therefore, many researchers continue to undertake studies to elucidate the failure mechanisms in various situations for good disaster readiness and thus reduce losses.
Some researchers have analyzed and observed the rainfall and hydrologic responses as essential factors in landslide triggering (Huang et al., 2009; Huang & Yuin, 2010; Ran et al., 2012; Gallage et al., 2012; Lourenco et al., 2006).
In their studies, pore water pressure, moisture content at some critical positions within the slope, and rainfall were identified
as the fundamental information for the prediction of slope failures. Orense et al. (2004) and Tohari et al. (2007), based on laboratory experiments, suggested slope failures were always induced when the soil moisture content within a region near the toe of a slope became nearly completely saturated, even though the other parts of the failure were still in a partially saturated state. To investigate the movement of soil mass after failure, Iverson et al. (2000) and Wang & Sassa (2003) stated that if soil mass is in a loose state before failure, it is logical to expect that soil contraction during failure will generate positive excess pore water pressure, which may cause soil liquefaction and rapid flow landslides. This motion of landslides which ranges from a few centimeters per year to many meters per second is dependent on the relative time scale between pore water pressure generation and dissipation (Iverson, 2005). Hakro & Harahap (2015) (in Discussions) also conducted flowslide experiments and indicated that the density of a soil slope is a more important factor controlling the initiation of flowslide types of failure. Generally, most of the failure mechanisms described in the above studies was investigated only in gentle slopes. However, sudden and rapid failures, which are the most dangerous due to their
suddenness and high velocities, always have high potential to occur in a steep slope. Gallage et al. (2012) stated that the mechanism of slope failures can vary depending on a slope’s angle and it becomes more vulnerable to sudden collapse with an increase in the inclination. This statement is true but still has little information, and thus is not enough distinguishing whether sudden or slow-retrogressive failure.
Besides, an accurate prediction of the time of occurrence and failure surface in the various slope angles by numerical simulation are also very important issues. Varnes (1984) stated that the greatest challenge posed by landslide hazards is being able to predict the time of occurrence. To deal with this problem, many researchers have developed a physical model by using Richards’ equation or applying the saturated/
unsaturated seepage finite element code SEEP/W to investigate infiltration patterns and adopted the extended Mohr-Colomb failure criterion to present the unsaturated shear strength (Iverson et al., 2000; Lee et al., 2011; Collins & Znidarcic, 2004; Tsai & Ynag, 2006; Tsai et al., 2008). However most of these models are applicable to assess only shallow failure with the use of infinite slope assumptions. These failures usually occur in a gentle slope which has little possibility of a sudden and abrupt collapse.
In general, a rainfall induced slope failure occurs due to different mechanisms. Some researchers have focused on the impacts of positive pore water pressure generation in saturated slopes from heavy rainfall (Johnson & Sitar, 1990; Fannin &
Jaakkola, 1999) whereas, other researchers have investigated slopes failing from rainfall infiltration, without the creation of positive pore pressure, with failure occurring due to a loss of matric suction in unsaturated soil (Rahardjo et al., 1995). In practice, the determination of the matric suction term is always a difficult task by theory and even through experiments because of the cost and time consuming (Vanapalli
& Fredlund, 1999). However, the development of some empirical procedures has provided significant value to putting theories related to shear strength of unsaturated soils in to practice. Vanapalli et al. (1996), Fredlund et al. (1996), and Oberg & Sallfours (1997) used the Soil-Water Characteristic Curve (SWCC) along with saturated shear strength parameters to estimate the shear strength of unsaturated soils.
Based on a series of experiments, this study aims to determine a critical slope which could be considered as a
slope threshold for distinguishing between sudden and gradual retrogressive failures. The study also attempts to discover the relationship between the mode of failure and the degree of saturation inside the soil model. For prediction and simulation purposes, the Spencer method is integrated with an effective minimization procedure based on dynamic pro- gramming by which the minimum of safety coefficient and their corresponding critical non-circular slip surfaces are defined simultaneously. The additional shear strength of unsaturated soil caused by matric suction is estimated using an empirical procedure proposed by Vanapalli et al. (1996) which is com- patible for using a limit equilibrium method. The simulation results will then be compared to those obtained by experiments.
2. Experimental Work
The experimental setup and arrangement of measurement accessories are presented in Fig. 1. The experiments were carried out in a 200 cm long, 60 cm wide and 50 cm high rectangular glass-side flume, to generate slope failure. This flume could be adjusted with different angles by a chain pulley arrangement to create varied scenarios which were in turn at 15°, 19°, 23°, and 27°. The experimental program is presented in Table 1. A rainfall simulator was installed above the structure to provide artificial rainfall over the flume. The complete processes, including the initiation of slope failure and movement of the failure mass, were captured by two digital cameras. One was placed in front of the flume; the other was placed on the right side (side A) of flume. The temporal variation of moisture content inside the soil domain was observed by five Water Content Reflectometers (WCR) type M05 located at different locations and connected to a computer-based acquisition system.
The flume was divided into 2 main sections: a right section, 100 cm long, was used to construct the soil slope model; and a left section, 100 cm long, was set up as free space. These sections were separated from each other by a 40 cm vertical impermeable plate (Fig. 1). On the left section, at 10 cm below the flume wall top, another 100 cm long impermeable plate was set parallel with flume bottom to allow runoff.
The purpose of this runoff (also created pond at upstream) to provide a direct source of ground water flow to create
Fig. 1. Experimental setup in International Water Resources Research Institute, Chungnam National University, Korea
Table 1. Experimental program
Exp. No. Slope of flume (Degree) Average rainfall intensity Measurement
1 15 70 mm/hr Slip surface and geometry of landslide
2 19 70 mm/hr Slip surface and geometry of landslide
3 23 70 mm/hr Moisture content
Slip surface and geometry of landslide
4 27 70 mm/hr Moisture content
Slip surface and geometry of landslide
Table 2. Some parameters values of the sediment considered
Sediment type Sand
Saturated moisture content, θs 0.32 Residual moisture content, θr 0.02 Van Genuchten parameter, α 3.15 Van Genuchten parameter, η 5.25 Saturated hydraulic conductivity, Ks, m/s 0.00014
Specific gravity, Gs 2.65
Mean grain size, D50, mm 0.42
Angle of repose, ∅ 34°
Porosity, n 0.32
water table in the bottom area of the model slope which is important for investigating the slope failure phenomenon (Regmi et al., 2014). A wooden plate was located at the downstream face, to support the soil mass. Between this plate and the flume end, a small space 1.0 cm was set up to allow the sub-surface flow freely The model slope face angle was created at 40° to induce sudden sliding. However, fixing the slope face up to 40° initially by using dry sediment is impossible because of its 34° angle of repose. Thus, the sediment with initial volumetric moisture content 0.05 was utilized in all experiments. The soil slope was made on the steel bottom of flume and well compacted by 5.0 cm layers thick through the use of a hand tamper. To observe the slip surface, red-colored sediment strips were installed normal to the flume bed and 2.5 cm × 2.5 cm grid size scale drawn on transparent plastic sheet were attached at the outer faces
of the side walls (Fig. 1).
The chosen sediment for the preparation of model soil slope was fine sand. Physical properties of the sediment are shown in Table 2. In order to construct a moisture retention curve, the tensionmeter UE-3023 was used to measure the
Fig. 2. Moisture retention curve
Fig. 3. Arrangement of rainfall measuring beakers inside the flume
Fig. 4. Distribution of rainfall intensity (in mm/hr) over the flume pore pressure of the experimental soil. These tensiometers,
with a ceramic cup at the top, can measure soil moisture suction for a long period in a range of 0~100 kPa in an available measuring depth from 10 cm to 100 cm. The entire soil was measured in an experimental box. The measuring process started when soil samples were dry, and finished when the samples were saturated. Corresponding to the average
pressure measured in one day was the moisture content of the measured soil sample. This moisture content was determined by calculating the difference between the weight of a measured soil sample and that of the same soil sample in a dry state.
Thereafter the moisture retention curve was constructed and van Genuchten parameters i.e., alpha α and eta η were calculated by non-linear regression method (Fig. 2).
Above the flume, artificial rainfall was provided by a rainfall simulator with 3.0 liters/min pump supplied discharge.
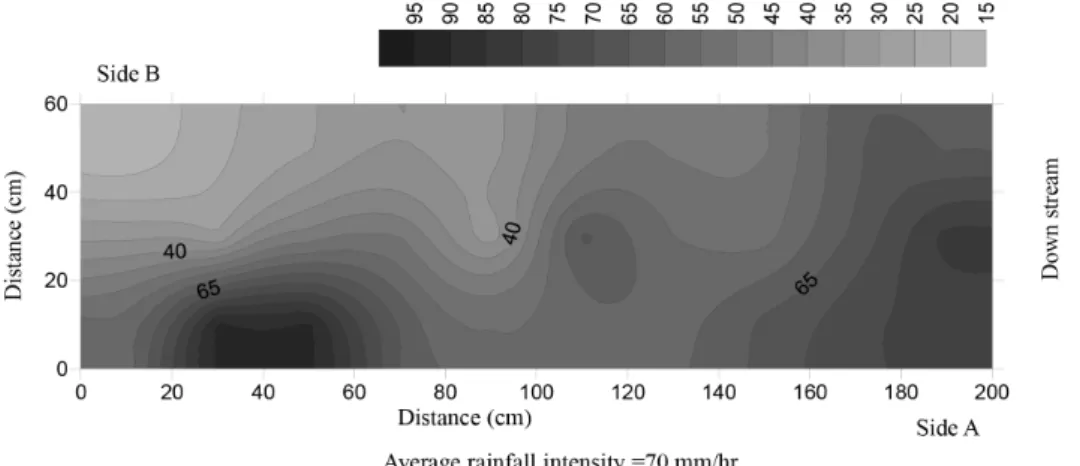
To measure the rainfall intensity and specify its distribution, 30 beakers with opening diameters of 12 cm were used.
They were placed at the bottom of the flume which was aligned horizontal by a specified arrangement as shown in Fig. 3. The average measured rainfall intensity value was 70 mm/hr. This rainfall intensity was calculated by averaging the measured rainfall over the entire duration of rain fall and the numbers of measuring points. The contour map presenting rainfall distribution over flume was illustrated in Fig. 4.
Fig. 5. General flow chart of the numerical simulation model
3. Numerical Work
A model for analyzing the stability of slopes was created by integrating two separate models: a seepage flow model and a slope stability model. These two models were non- commercial models and were modified from the models used in the study of Regmi & Jung (2015). They were both written in FORTRAN. In the model calculation procedure, firstly a 2D seepage flow model was used to compute the degree of saturation, pore-water pressure and moisture content within the body mass. This information was then sent to the slope stability model to check the stability of the slopes. The model structure and its flow chart are presented in the Fig. 5.
3.1 Seepage Flow Model
A 2D seepage-flow model based on Richards’ equation valid for unsaturated-saturated soil was proposed for evaluating the change in pore water pressure inside the soil domain.
w w w
x z
C ht x⎛⎜⎝K hx ⎞⎟⎠ z⎛⎜⎝K ⎛⎜⎝ hz 1⎞⎟⎠⎞⎟⎠
(1)
Where hw is the water pressure head, x is the horizontal spatial coordinate, z is the vertical spatial coordinate, Kx, and Kz represent the hydraulic conductivity in the x, and z directions, respectively, C=∂θw/∂hw is the specific moisture capacity, and t is the time.
The Line Successive Over Relaxation (LSOR) scheme which was introduced by Freeze (1971a; 1971b and 1978) was used
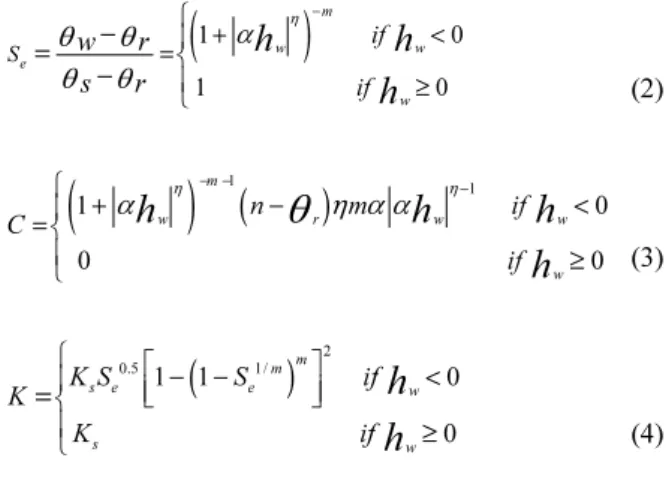
for solving Eq. (1) using an implicit iterative finite difference scheme. Moreover, in order to solve Richards’ equation, the constitutive equations which relate the pressure head to moisture content and the relative hydraulic conductivity proposed by Van Genuchten (1980) were also employed.
1
01 0
m
w w
e
w
S if
if
w r
s r h h
h
⎧
⎨⎪
⎪
⎩
(2)
1
1
1 00 0
m
w r w w
w
n m if
C
if
h h h
h
⎧
⎨⎪
⎪
⎩ (3)
20.5 1 1 1/ 0
0
m m
s e e w
s w
K S S if
K
K if
h h
⎧ ⎡ ⎤
⎪ ⎢⎣ ⎥⎦
⎨⎪
⎩
(4)
Where Se is the effective saturation, α and η are empirical parameters, Ks is the saturated hydraulic conductivity, θs
and θr represent the saturated and residual moisture content, respectively, n is the porosity of soil, and m=1-1/η.
3.2 Slope Stability Model
In the 2D slope stability model, the factor of safety was evaluated through a limit equilibrium analysis. The Spencer method was integrated with an effective minimization procedure based on dynamic programming by which the critical non- circular slip surface and its corresponding minimal factor of safety are calculated simultaneously. The mobilized shear force Ti and the total normal force Ni on the base of the slice can be expressed as
i i i i i i
N (W P )cos Q sin( ) (5)
i i i i i i
T (W P )sin Q cos( ) (6)
Where Wi is the weight of the slice, Pi is the vertical external force, αi is the inclination of the base to horizontal, and δ is the inclination of inter slice forces (Q1, Q2, …, Qi) to horizontal.
The Spencer’s original method does not consider the nega- tive pore-water pressure appearing in unsaturated soil which causes soil’s shear strength to increase. Vanapilli et al. (1996)
suggested the following formula for estimating the shear strength of unsaturated soils:
( )tan ( )[( w r)tan ]
i i ai ai i
s r
s c u u u
(7)
Where si is the shear strength (available), c is is the effective cohesion, φ is the effective angel of internal friction, σi is the total normal stress, ui is the pore water pressure, uai is the pore air pressure, θw is the volumetric water content, and θs and θr represent the saturated and residual moisture content, respectively.
Thus the factor of safety for slip surfaces can be defined as
[ {( )cos }tan ( ) tan ]/
( )sin /
w r
i i i i ai i ai i i i
s r
f
i i i i
cl W P u l u u l m
F W P m
∑
∑
(8)
w r
i i i i ai i ai i i i i
s r
m
i i i i i
[cl {(W P )cos u l }tan (u u )l tan ] Dcos( )/ m
F (W P )sin Dcos( )/ m
∑
∑
(9)
cos( )(1 1tan( )tan )
i i i
m F
(10)
Where li is the length of the base of a slice, Ff and Fm
are the safety factors with respect to the force and moment equilibrium, respectively, D is the distance from the base center of the slice to an arbitrary reference point, and θi is the angle between the vertical direction and the direction of the xz plane.
4. Results and Discussions
4.1 Detailed Observation of Failure Processes To determine whether sudden or slow retrogressive failures mode will occur, the flume experiments were set at various angles with the same model geometry, rainfall intensity, and initial conditions. During the time of research, a series of experiments were conducted; however, only 4 representative experiments in which the differences between the modes of failure could clearly be distinguished were chosen to be presented in this paper (Table 1). According to the video
recordings, it was observed that the mode of failure depends largely on the effect of a slope’s inclination. Mode of failure started from slow retrogressive in 55° slope in experiment 1, changed to gradual retrogressive in a steeper slope (59°
and 63°) in experiments 2 and 3, and became a sudden failure in 67° slope in experiment 4. In each failure mode, the failure process was divided into four stages as presented in Fig. 6.
1. The first signs of failure: In all experiments, the time t=0 seconds represented the starting time of the first sign of failure occurring. After the onset of rainfall, seepage water gradually infiltrated toward the bottom of slopes, with a rising in the degree of saturation at the toe position. The first sign of failure in experiments 1, 2 and 3 were observed nearby the toe position. The difference between them was only the size of the slides which was very small in experiment 1. However, the most striking feature was observed in experiment 4.
The first sign of failure was a large crack that appeared in the center at the top of the soil model instead of at the toe of the slopes as in the former experiments.
2. Retrogressive failures: After the first sign of failure, there were a number of small retrogressive slides that occurred in experiment 1, whereas only 2 localized slides could be observed in experiments 2 and 3. These two slides might be due to the local instability caused by the first slide. Interestingly, in experiment 4, no retrogressive failures were recorded.
3. Main failure: Following the retrogressive slides, the main failures occurred. It should be noted that the main failures in this study were considered as failures that covered the whole width of the flume. This stage could only easily be observed in experiments 3 and 4 from the front view. However, due to the asymmetry, main failures were difficult to distinguish in experiments 1 and 2. Fig. 7 presents an additional view to clearly describe this failure stage, which shows the illustration before and after the main failure in experiment 1 on the right view at t=580 seconds and t=581 seconds, respectively.
4. Failure completion: Failures were considered as complete once all of the failed mass had moved out of the flume.
After the failures, the failed masses started traveling to the downstream at different velocities; however, due
Fig. 6. Summarized failure process
Fig. 7. The plot before and after the main failure occurs in Exp.1 (View from side A)
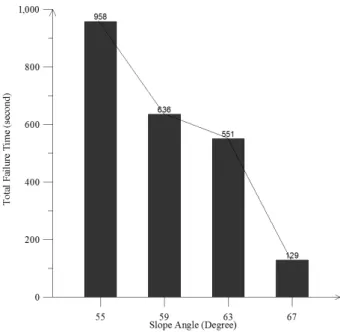
Fig. 8. The total failure time in different slope inclination to insufficient lab measurements (displacement sensor)
these velocities could not be recorded. However, by using a video camera, a comparison of the failure velocities could be approximately provided through the recording of the duration of failures (Fig. 8). Naturally, a subsequent increase in the slope inclination of the slope then caused a significant decrease in the total time of occurrence from 958 seconds in experiment 1 to only 129 seconds in experiment 4.
The results summarized in Fig. 6 show that the failure mode
in experiment 4 can be considered as the most dangerous type due to its suddenness (no early warning signs in toe position) and short duration (high moving velocity). The slope angle 67° could be considered as an approximate threshold
Fig. 9. Comparison of moisture profiles between Exp. 3 and Exp.
4 and their corresponding time of first sign of failure and failure completed
Fig. 10. Saturated and unsaturated zones at the time of first sign of failure in Exp. 3 and Exp. 4 to distinguish between sudden and retrogressive modes for
the entire material. Interestingly, though there was only a minor difference between the slope angle (4°) in experiments 3 and 4, their failure modes were completely different.
Therefore, to elucidate this phenomenon, the degrees of saturation at different points within the soil model in 2 experiments collected through 5 WCRs will be analyzed next.
4.2 Volumetric Soil Moisture Content During Failure Process
Observations showed the changes in degrees of saturation in 2 experiments were almost the same, and the process can be presented as follow. The infiltration process was not only dependent on rainfall above the soil model but also the direct source of ground water (water head in the upstream pond created by the rainfall) (Fig. 1). The wetting front due to rainfall began with rainwater percolating downwards from
the entire slope surface, and seeping toward the bottom of the slope. Meanwhile, the wetting front due to the upstream pond propagated in two directions: toward the surface of the slope and toward the bottom of the slope. In (Fig. 9) there was a sudden increase in moisture profile from its initial value in all WCRs. It was because the sharp wetting front through ground water flow arrived before the wetting front through rainfall above. Besides, the occurrence of the water table in the bottom of slope was illustrated clearly through three lowest WCRs (WCR1, WCR3 and WCR5).
Their degrees of saturation started to increase from WCR1 to WCR3 and to WCR5, indicating a gradual creation of the water table from the left to the right side of the flume.
In addition, WCR2 recorded the first position reached by the wetting front. However, the time required to attain full saturation was much longer than in the others due to its higher location. The recording of WCR4 indicated that at the time of failure, the water table remained still lower than its position, and WCR4 was the last WCR to become fully saturated. This suggests that the rise of water table in the downstream of the model was slower than the increase of water table in the upstream area. Besides, WCR5 showed at the time of failures, the toes slopes were almost saturated in both experiments. However, the degree of saturation of the whole soil model still could not be described through the data observed in these 5 WCRs. By using the numerical simulation, the comparison of fully and partially saturation part within the slope at the time of first sign of failure in experiment 3 (retrogressive failure mode) and experiment 4 (sudden failure mode) can be describe in Fig. 10. There was no big difference between them, thus revealed no clear link
Fig. 11. Simulated and experimental moisture profiles in 5 WCRs
in Exp. 4 Fig. 12. Schematic view of two dimensional slope surface generations
between the degree of saturation and the failure mode.
Instead, the failure mode was proven to depend mostly on the inclination of the slopes.
4.3 Numerical Analysis
To predict the failure surface and the time of failure, a seepage flow model and a slope stability model were integrated as a single unit. The sudden failure in experiment 4 was chosen for prediction due to the danger such failures present for people and properties. In the seepage flow model, the simulation was performed at 0.02 second time steps, 2.0 cm space steps in the horizontal direction and 1.0 cm space steps in the vertical direction. The time t=0 seconds was considered as the starting time for experiment. Fig. 11 presents the comparison of moisture profiles between simulated and experiments of 5 WCRs in experiment 4. Though there was only a minor difference between them, the results demonstrated similarities in the main trend as well as the time of occurrence.
In the slope stability model, limit equilibrium method of slices were performed at 1.0 second time steps and 2.0 cm space steps in the horizontal direction. The Spencer method of slope stability analysis was integrated with a minimization procedure based on dynamic programming to determine the critical non-circular slip surfaces and its corresponding minimal factor of safety. Dynamic programming is a technique handling multistage optimization (maximum or minimum value). In a typical problem, in each stage, a decision has to be made, and these decisions affect to the system, thereby creating a
certain result. Dynamic programming is a generalized method to achieve the best result (Yamagami & Ueta, 1986). In this study, in each time step, one critical slip surface (have the minimum value) was chosen among a list of potential slip surfaces by a numerical algorithm in mathematical programming for optimization of sequential multi-stage decision problems.
Such problems are characterized by the following two pro- perties (Baker, 1980):
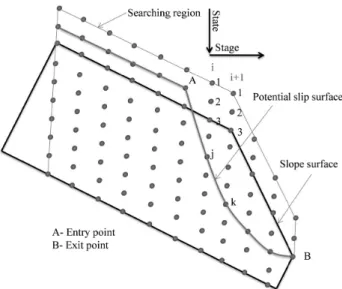
a) At any stage (time), the system may exist in any one of a finite number of states, thus describing a trajectory in the state-stage plane (Fig. 12).
b) It is necessary to find a minimum or maximum value Hs, of some quantity H (total return function or total auxiliary function), which depends on the trajectory and is determined as a sum of returns obtained on passing between two adjacent stages.
In order to search the critical slip surface by the safety factor formula with respect to the force, Eq. (8) can be represented by the following expression
1
1 n i fi
f n
i fi
R F
T
∑
∑
(11)When applying dynamic programming, the minimization of G is calculated in all admissible slip surfaces. The minimum value Gs is
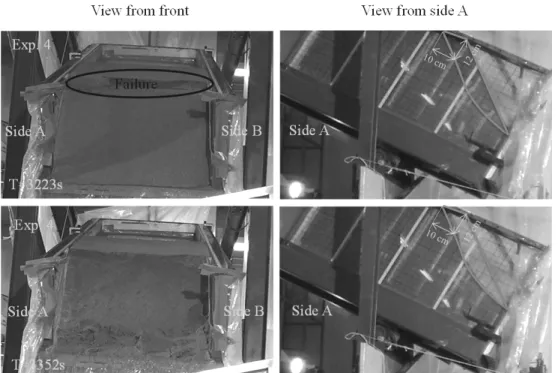
Fig. 13. Front view and side view showing failure surface in Exp. 4
Fig. 14. Experimental and simulated slips surfaces in Exp. 4 (27°
bottom slope)
1
min min[ (n )
s fi f fi
i
H H R F T
∑
(12)As consequence, in every time step, one critical slip surface with its corresponding factor of safety was determined to help the model to check whether or not failure would happen.
The study conducted by Regmi & Jung (2015) did not consider the matric suction in the calculation of factor of safety respects to force and moment equilibrium; however more information to help understand the critical slip surface searching procedure was provided.
In the experiment, it was observed that at 3,223 seconds a sudden failure occurred at 10 cm back from the crest (Fig.
13). The failure happened very fast and abruptly, without any tension cracks at the toe area. It was because the toe of the slope was almost in a saturated condition, and the entire slope was steep enough to trigger a sudden failure (Orense et al., 2004 and Tohari et al., 2007). The slide had a noncircular surface with 12 cm maximum thickness measured perpendicularly to the bottom slope.
Fig. 14 presents the comparison between slip surfaces observed in experiment and that simulated by numerical with and without considering matric suction in 67° slope model. The results show that the simulated slip surface without considering matric suction stayed in the lowest position thus had a big difference with those drawing by experiments.
The reason behind it is the acceptance of two additional boundary conditions following the study made by Regmi
& Jung (2015) below:
a) The slip surface has to reach to the base of the model before the appearance of water table.
b) The slip surface within one or two stages after entrance to the soil model had to pass at least a small portion through the water table in which only the pores below
it will exert positive pressure resulting instability.
Consequently, the simulated slip surface always looks steep in some first stages, and is located in a deep position. These assumptions seem imperative and are not absolutely correct due to the lack of matric suction effect. At the predicted time of failure, the soil above the water table (above red line in the failure in Fig. 14) was still unsaturated, thus the additional shear strength caused by the matric suction of unsaturated soil was still available to provide the stability for the slope. Therefore, the predicted failure time without considering matric suction (2,920 seconds) was much earlier than experiment (3,223 seconds).
In contrast, the predicted failures surfaces in Fig. 14 and the time of occurrence that were simulated in considering the matric suction (3,188 seconds) were more comparable with the experiments (3,223 seconds). The failure surfaces looked smoother than those in the former simulations. This was because when the matric suction effect is considered in calculation of safety factors in Eq. (8) and (9), no additional assumption is needed in the simulation. There are several factors that lead to the instability of slope: an increase in weight of soil mass above a particular slip surface, an increase in average pore-water pressure on the same slip surface, a decrease of negative pore-water pressure which presents as matric suction, and the steeper of slip surfaces. Rainfall causing an increase in moisture content due to infiltration adds to the weight of the slope. The infiltration also contributes to an increase in water table as well as a decrease of matric suction. Finally, until there is a sufficient infiltration into the slope when safety factor respect to force and moment equilibrium are both satisfied, failure will occur.
However, even this proposed model gave quite comparable results, the simulated slip surfaces still looked longer and deeper than surfaces in the experiment. This was because frictions caused by sides of the flume were neglected in the computation. Moreover, the observation only was implemented from the flume side. The aim of this study were simulation of failure in 2D, but the real failure shapes was 3D in geometry, in which their length and depth on either side is shorter and shallower than in the inner part. Therefore, to perfectly match the results obtained from experiments with those computed through calculations, a 3D numerical analysis is necessary.
5. Conclusion
In this study, a series of laboratory experiments were conducted to investigate the failure process of rainfall induced slope failures at various steep slope angles. The results showed that the mode of failure are highly dependent on the effect of a slope’s inclination: starting from slow retrogressive in a 55° slope, changing to gradual retrogressive in a steeper slope (59° and 63°) and becoming a sudden failure in 67°
slope for the entire material d50=0.420 mm. The sudden slope failure is the most dangerous type due to its suddenness and high velocity. These results also revealed no clear link between the degree of saturation and the failure mode. The saturation state at the toe position is still not enough to induce a sudden failure without the steepness of slope.
The numerical model was created by integrating a 2D seepage flow model and a 2D slope stability model to predict the failure surfaces and their corresponding times of occurrence.
The results showed that besides the effect of pore water pressure, matric suction is also a very important factor in slope stability analysis. The predicted failure surfaces and occurring times matched well with those observed in the experiments. A subsequent discard of matric suction will lead the predicted slip surfaces to become deeper and the corresponding failure times to happen earlier.
In future studies, different types of soil material should be employed to enrich the results. Additionally, the numerical analyses should be conducted in 3 dimensions to reproduce the failure phenomena well.
Acknowledgement
This research was supported by a grant (11-TI-C06) from the Advanced Water Management Research Program funded by the Ministry of Land, Infrastructure and Transport of the Korean government and Korea Ministry of Environment (MOE) as “GAIA Program-2014000540005”.
References
1. Baker, R. (1980), Determination of the critical slip surface in slope stability computations, International Journal for Numerical
and Analytical Methods in Geomechanics Vol. 4, pp. 333~359.
2. Collins, B. D. and Znidarcic, D. (2004), Stability analyses of rainfall induced landslides, Journal of Geotechnical and Geo- environmental Engineering No. 4, pp. 362~372, DOI: 10.1061 (ASCE)1090-0241(2004)130:4(362).
3. Fannin, R. J. and Jaakkola, J. (1999), Hydrological response of hillslope soils above a debris-slide headscarp, Can. Geotech.
J, Vol. 36, No. 6, pp. 1111~1122.
4. Fredlund, D. G., Xing, A., Fredlund, M. D. and Barbour S.
L. (1996), The relationship of the unsaturated soil shear strength to soil-water characteristic curve, Canadian Geotechnical Journal, No. 33, pp. 440~448.
5. Freeze, R. A. (1971a), Three dimensional transient, saturated unsaturated flow in a fround water basin, Water Resources Research, No. 7, pp. 347~366.
6. Freeze, R. A. (1971b), Influence of the unsaturated flow domain on seepage through earth dams, Water Resources Research, No. 7, pp. 929~941.
7. Freeze, R. A. (1978), Mathematical models of hill slope hydrology, in Kirkby. M. J., ed, Hillslope Hydrology, John Wiley, pp. 177~225.
8. Gallage, C., Jayakody, S. and Uchimura, T. (2012), Effects of slope inclination on the rain-induced instability of embankment slopes, Proceedings of the Second International Conference on Geotechnique, Construction Materials and Environment, The GEOMATE International Society, Kuala Lumpur, Malaysia, pp. 196~201.
9. Hakro, M. R. and Harahap, I. S. H. (2015), Laboratory experi- ments on rainfall-induced flowslide from pore pressure and moisture content measurements, Nat. Hazards Earth Syst. Sci (in Discssions) No. 3, pp. 1575~1613, DOI:10.5194/nhessd-3- 1575~2015.
10. Huang, C. C., Ju, Y. J., Hwu, L. K. and Lee, J. L. (2009), Internal soil moisture and piezometric responses to rainfall- induced shallow slope failure, Journal of Hydrology No. 370, pp. 39~51, DOI:10.1016/j.jhydrol.2009.02.051.
11. Huang, C. C. and Yuin, S. C. (2010), Experimental investigation of rainfall criteria for shallow slope failures, Geomorphology No. 120, pp. 326~338, DOI: 10.1016/j.geomorph.2010.04.006.
12. Iverson, R. M., Reid, M. E., Iverson, N. R., LaHusen, Logan, M., Mann, J. E. and Brien, D. L. (2000), Acute sensitivity of landslide rates to initial soil porosity, Science No. 290, pp.
513~516.
13. Iverson, R. (2005), Regulation of landslide motion by dilatancy and pore pressure feedback, Journal of Geophysical Research, Vol. 110, No. F02015, pp. 1~16, DOI:1029/2004JF000268.
14. Johnson, K. A. and Sitar, N. (1990), Hydrologic conditions leading to debris-flow initiation, Can. Geotech. J, No. 27, pp.
789~801.
15. Korup, O. (2002), Recent research on landslide dams- a literature review with special attention to New Zealand, Progress in Physical Geography No. 26, pp. 206~235.
16. Lee, K. H., Hwang, W. K., Yun, S. K., Kim, T. H. and Choi, S. J. (2011), Stability of unsaturated infinite slope under rainfall- induced infiltration, Proceeding of the Twenty-first international offshore and polar engineering conference, pp. 611~616.
17. Lourenco, S. D. N., Sassa, K. and Fukuoka, H. (2006), Failure
process and hydrologic response of a two layer physical model:
Implications for rainfall-induced landslides, Geomorphology No. 73, pp. 115~130, DOI:10.1016/j.geomorph.2005.06.004.
18. Oberg, A. and Sallfors, G. (1997), Determination of shear strength parameters of unsaturated silts and sands based on the water retention curve, Geotechnical Testing Journal, GTJODJ, Vol. 20, No. 1, pp. 40~48.
19. Orense, R., Shimoma, S., Maeda, K. and Towhata, I. (2004), Instrumented model slope failure due to water seepage, Journal of Natural Disaster Science No. 26, pp. 15~26.
20. Rahardjo, H., Lim, T. T., Chang, M. F. and Fredlund, D. G.
(1995), Shear strength characteristics of a residual soil, Can.
Geotech, J, No. 32, pp. 60~77.
21. Ran, Q., Su, D., Li, P. and He, Z. (2012), Experimental study of the impact of rainfall characteristics on runoff generation and soil erosion, Journal of Hydrology, Vol. 424~425, pp. 99~111.
22. Regmi, R. K. and Jung, K. S. (2015), Application of dynamic programming to locate the critical failure surface in a rainfall induced slope failure problem, KSCE, pp. 1~11, DOI: 10.1007/
s12205-015-0183-9.
23. Regmi, R. K., Jung, K. S., Nakagawa, H. and Kang, J. (2014), Study on mechanism of retrogressive slope failure using artificial rainfall, Catena, No. 122, pp. 27~41, DOI: http://dx.doi.org/
10.1016/j.catena.2014.06.001.
24. Tohari, A., Nishigaki, M. and Komatsu, M. (2007), Laboratory rainfall-induced slope failure with moisture content measurement, Journal of Geotechnical and Geoenvironmental Engineering Vol. 133, No. 5, pp. 575~587.
25. Tsai, T. L. and Yang, J. C. (2006), Modeling of rainfall-triggered shallow landslide, Environ. Geol, No. 50, pp. 525~534, DOI:
10.1007/s00254-006-0229-x.
26. Tsai, T. L., Chen, H. E. and Yang, J. C. (2008), Numerical modeling of rainstorm-induced shallow landslides in saturated and unsaturated soils, Environ Geol, pp. 1269~1277.
27. Van Genuchten M. T. (1980), A closed-form equation for predicting the hydraulic conductivity of unsaturated soils, Soil Science Society of America Journal, Vol. 44, No. 5, pp.
892~898.
28. Vanapalli, S. K., Fredlund, D. G., Pufahl D. E. and Clifton, A. W. (1996), Model for the prediction of shear strength with respect to soil suction, Canadian geotechnical Journal, No. 33, pp. 379~392.
29. Vanapalli, S. K. and Fredlund, D. (1999), Empirical procedures to predict the shear strength of unsaturated soils, Eleventh Asian Regional Conference on Soil Mechanics and Geotechnical Engineering, pp. 93~96.
30. Varnes, D. J. (1984), Landslide hazard zonation: a review of principles and practice, UNESCO, Natural Hazards Series, Vol.
3, p. 61.
31. Wang, G. and Sassa, K. (2003), Pore-pressure generation and movement of rainfall-induced landslides; effects on grain size and fine-particle content, Engineering Geology, No. 69, pp.
109~125, DOI:10.1016/s0013-7952(02)00268-5.
32. Yamagami, T. and Ueta, Y. (1986), Noncircular slip surface analysis of the stability of slopes- an application of dynamic programming to the Janbu method, Journal of Japan Landslide Society, pp. 22~4.