Received: July 28, 2020 Revised: August 12, 2020 Accepted: August 26, 2020
OPEN ACCESS
HORTICULTURAL SCIENCE and TECHNOLOGY 38(6):840-849, 2020
URL: http://www.hst-j.org pISSN : 1226-8763 eISSN : 2465-8588
This is an Open Access article distributed under the terms of the Creative Commons Attribution Non-Commercial License which permits unrestricted non-commercial use, distribution, and reproduction in any medium, provided the original work is properly cited.
Copyrightⓒ2020 Korean Society for Horticultural Science.
This work was supported by Korea Institute of Planning and Evaluation for Technology in Food, Agriculture and Forestry (IPET) through
“The First Generation Smart Plant Farm Advan- cement and Demonstration Program (319066-1)”
funded by Ministry of Agriculture, Food and Rural Affairs. The authors would like to thank Enago for the English language review and suggestions.
Author Contribution Statement
Ahn M.K and Ahn S.R. performed the experiment.
Sim H.S. and Kim D.S. analyzed the data and wrote the manuscript and revised it. Kim S.K.
designed the experiment, analyzed the data, and revised the manuscript.
Conflict of Interest
The authors declare no conflict of interest.
Prediction of Strawberry Growth and Fruit Yield based on Environmental and Growth Data in a Greenhouse for Soil Cultivation with Applied Autonomous Facilities
Ha Seon Sim 1† , Dong Sub Kim 2† , Min Gyu Ahn 1 , Su Ran Ahn 1 , and Sung Kyeom Kim 1*
1
Department of Horticultural Science, College of Agricultural and Science, Kyungpook National University, Daegu 41566, Korea
2
Department of Plant Sciences, University of California, Davis, 1636 East Alisal Street, Salinas, CA 93905, USA
*Corresponding author: [email protected]
†
Ha Seon Sim and Dong Sub Kim have contributed equally to this work.
Abstract
The ability to predict how well crops will grow and how much fruit they will yield is important for farmers, consumers, and researchers. Advances in environmental and plant measurement equipment provide the opportunity for more data to be collected from plant growing operations, which could result in more accurate predictions. The objective of this study was to predict the strawberry growth and fruit yield using environmental and growth data collected with this equipment. The correlation coefficients of the average daily air temperature and soil temperature data for strawberry growth predictions were higher than the relative humidity, soil moisture content, electronic conductivity, CO
2concentration, photosynthetic active radiation, and vapor pressure deficit data. The correlation coefficients of photosynthetic active radiation, vapor pressure deficit, and relative humidity for strawberry yield prediction were higher than the other environmental data and all growth data such as plant height, crown diameter, and leaf length and width. The regression model using environmental data showed high correlation coefficients with the actual yield data (R
2= 0.99). These results indicate that strawberry growth and fruit yield could be predicted using environmental data.
Additional key words: air temperature, forecast, photosynthetic active radiation, relative humidity, smart farming
Introduction
Climatic conditions are variable in greenhouses during strawberry cultivation and can be a major
contributing factor to growth and fruit yield variations. The growth of strawberry plants is mainly
affected by a complex and dynamic set of interacting environmental factors, such as temperature,
daylength, light intensity (Sønsteby et al., 2016), and soil temperature (Jun et al., 2008). Many studies
reported that strawberry fruit yield is affected by both environmental and growth factors. For
example, Ljones (1978) and Døving (1987) studied the effect of climate factors on fruit yield, while Fernandez et al.
(2001) illustrated that lower relative growth rates resulted in smaller fruit yields. Strawberry growth and fruit yield, therefore, might be predicted by environmental data (Døving and Måge, 2001). To collect environmental data, however, sensors and data loggers are usually needed. Environmental measurement sensors have become more advanced in recent years due to the development of smart farms (Muangprathub et al., 2019). These advancements have made farmers more efficient by making it possible for sensors to regulate fans, windows, and irrigation systems in greenhouses to control various environmental factors, such as air and soil temperature, humidity, CO
2, and electrical conductivity (EC) (Muangprathub et al., 2019).
Numerous prediction models can be used to predict various plant characteristics (Güçlü et al., 2020). For instance, Zadravec et al. (2013) predicted apple fruit size using a correlation/regression analysis. Kim et al. (2019) predicted carotenoid content in tomatoes using correlation coefficients and principal component analysis (PCA). Karydas et al.
(2020) predicted antioxidant activity of cherry fruits using PCA and correlation coefficients with imaging, free radical scavenging activity (DPPH), and Folin-Ciocalteu reducing capacity data. This study analyzed the correlation between environmental conditions, plant growth, and fruit yields in a strawberry soil cultivation greenhouse. Correlation coefficients and multiple regression models were used in this study, since these methods have been verified in many studies.
Furthermore, Rudolph (1985) used multiple regression models with air temperature, precipitation, and heat units as variables for predicting strawberry fruit yields. However, several researchers used linear equations with climate data to predict plant growth (Bugg et al., 2006). Other prediction techniques have been developed in various studies (Moon et al., 2018; Park et al., 2018). In agriculture, growth and fruit yields of crops have been studied (Døving and Måge, 2001;
Gholipoor and Nadali, 2019), as have metabolites in fruit, using machine vision technologies (Choi et al., 1995; Kim et al., 2019), and crop loss (Kogan et al., 2016). However, there is a lack of studies using on-farm trial data of growth-pattern responses to environmental factors in terms of atmosphere and rhizosphere conditions because the continuous monitoring and direct management of crops are difficult. The objective of this study was to predict the strawberry growth and fruit yield in greenhouses using environmental and growth data.
Materials and Methods Plant Material
The June-bearing cultivar ‘Seolhyang’ (Fragaria x ananassa) was used for this experiment. Strawberry plants were
transplanted to five greenhouses (double-layer plastic houses with polyethylene film), in Gaejin-myeon, Goryeong-gun,
Gyeongsangbuk-do, Republic of Korea (35°42'N, 128°19'E) on September 7, 2019. Fruits were harvested from
November 27, 2019 to April 28, 2020. The experiments were arranged in a randomized complete block design with three
replications. Five plants in three plots in the center of a greenhouse (n = 15) were selected for more in-depth study and
were evaluated once every two weeks starting ten days post transplantation (September 17, 2019) and lasting until 234
days post transplantation (April 28, 2020). Plant height, number of leaves, maximum leaf length and width, crown
diameter, and leaf area index (LAI) were measured. The methods for measuring plant height, leaf length, and width are
presented in Fig. 1 . The crown diameter and LAI were determined using digital Vernier calipers (Mitutoyo 500-196-30,
Kawasaki, Japan) and a plant canopy analyzer (LAI-2200C, Li-Cor, Lincoln, NE, USA), respectively.
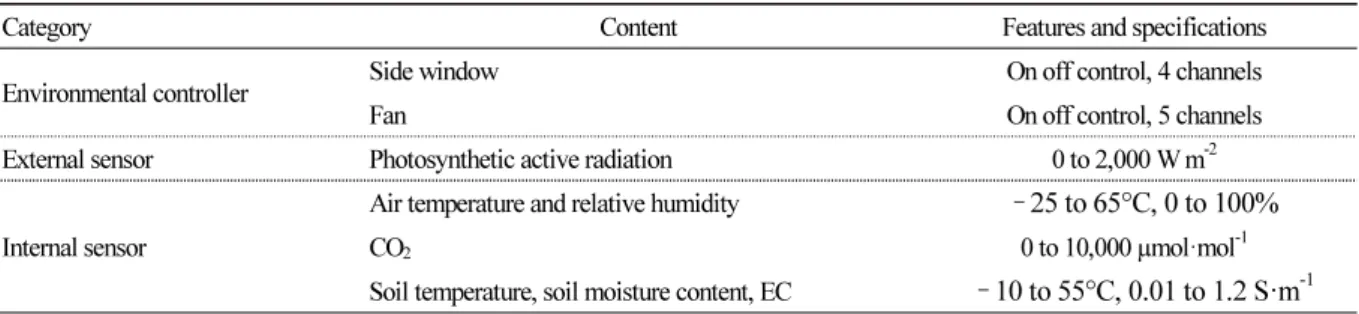
Table 1. Devices for environmental control and data collection for the strawberry plants
Category Content Features and specifications
Environmental controller Side window On off control, 4 channels
Fan On off control, 5 channels
External sensor Photosynthetic active radiation 0 to 2,000 W m
-2Internal sensor
Air temperature and relative humidity ‑ 25 to 65°C, 0 to 100%
CO
20 to 10,000 µmol·mol
-1Soil temperature, soil moisture content, EC ‑ 10 to 55°C, 0.01 to 1.2 S·m
-1A B C
Fig. 1. The measurement methods for plant height (a), leaf length (b), and leaf width (c) of strawberry plants.
Environmental Conditions
The environmental conditions in the greenhouses were controlled by the side windows and fans installed outside of the greenhouses for air temperature and relative humidity control (Table 1 and Fig. 2) .
Environmental Data Collection
Internal environmental data, such as air temperature, relative humidity, CO
2concentration, soil temperature, soil moisture content, and electrical conductivity, were collected by internal sensors. External environmental data, such as photosynthetic active radiation (PAR), was collected by external sensors (Table 1) . All data were recorded by data loggers (Nare Trends Inc., Sejong, South Korea) at 10-minute intervals.
Data Analysis
The correlation analysis was conducted using R, version 4.0.2 (RStudio Inc., USA). Regression analysis was conducted
using R, version 3.6.1. The multivariate analysis regression with the highest R
2value was used via forward, backward,
and both to predict plant growth (plant height, crown diameter, and leaf length and width) and fruit yield from the
environmental data in terms of temperature, relative humidity, vapor pressure deficit, PAR, CO
2concentration, soil
moisture content, and soil EC. The analysis of forward selection has carried out with no predictors in the model, while
backward selection analyzed with all predictors in the model, iteratively removes the least contributive variables, and the
analysis eliminated when you have a model where all predictors are statistically significant. The measured and predicted
data were displayed by SigmaPlot (Systat, San Jose, CA, USA). Adjusted R
2and route mean square error (RMSE) were
calculated to compare the measured and predicted data.
A B
C D
E F
Fig. 2. The environmental data during cultivation periods of strawberry plants from 10 days after transplanting (DAT) to 234 DAT. Bars represent standard deviation of data from 14-day intervals. The figures show ADAT and ST (a), RH and SMC (b), PAR (c), VPD (d), CO
2(e), and EC (f).
Results and Discussion
The average daily air and soil temperature in the greenhouses during the study period were 11.8 ‑ 24.7°C and 14.1 ‑
26.0°C, respectively (Fig. 2) . Although the air temperature was only measured during the day, the air temperature in the
greenhouses was lower than the soil temperature, which is to be expected, as soil temperatures from 0.1 to 1.0 m deep are
generally known to be higher than air temperatures (Chisholm and Chapman, 1992). Wu et al. (2012) reported that air
temperature is lower than soil temperature in winter. In a greenhouse in India, the soil temperature from January to
February was higher than the air temperature (Mahajan and Singh, 2006).
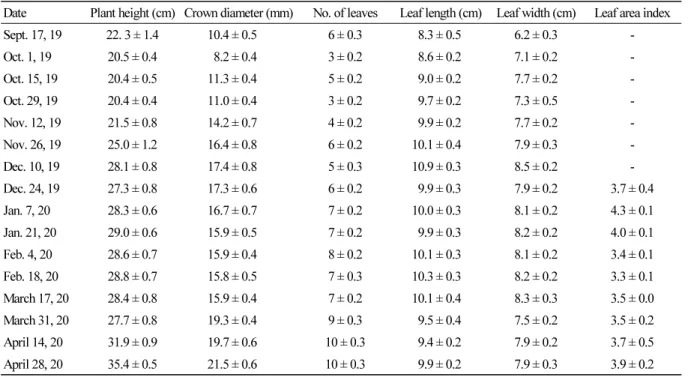
Table 2. The growth data of the strawberry plants from September 17, 2019 to April 28, 2020 (n = 10). Data presented as mean ± standard deviation
Date Plant height (cm) Crown diameter (mm) No. of leaves Leaf length (cm) Leaf width (cm) Leaf area index
Sept. 17, 19 22. 3 ± 1.4 10.4 ± 0.5 6 ± 0.3 8.3 ± 0.5 6.2 ± 0.3 -
Oct. 1, 19 20.5 ± 0.4 8.2 ± 0.4 3 ± 0.2 8.6 ± 0.2 7.1 ± 0.2 -
Oct. 15, 19 20.4 ± 0.5 11.3 ± 0.4 5 ± 0.2 9.0 ± 0.2 7.7 ± 0.2 -
Oct. 29, 19 20.4 ± 0.4 11.0 ± 0.4 3 ± 0.2 9.7 ± 0.2 7.3 ± 0.5 -
Nov. 12, 19 21.5 ± 0.8 14.2 ± 0.7 4 ± 0.2 9.9 ± 0.2 7.7 ± 0.2 -
Nov. 26, 19 25.0 ± 1.2 16.4 ± 0.8 6 ± 0.2 10.1 ± 0.4 7.9 ± 0.3 -
Dec. 10, 19 28.1 ± 0.8 17.4 ± 0.8 5 ± 0.3 10.9 ± 0.3 8.5 ± 0.2 -
Dec. 24, 19 27.3 ± 0.8 17.3 ± 0.6 6 ± 0.2 9.9 ± 0.3 7.9 ± 0.2 3.7 ± 0.4
Jan. 7, 20 28.3 ± 0.6 16.7 ± 0.7 7 ± 0.2 10.0 ± 0.3 8.1 ± 0.2 4.3 ± 0.1
Jan. 21, 20 29.0 ± 0.6 15.9 ± 0.5 7 ± 0.2 9.9 ± 0.3 8.2 ± 0.2 4.0 ± 0.1
Feb. 4, 20 28.6 ± 0.7 15.9 ± 0.4 8 ± 0.2 10.1 ± 0.3 8.1 ± 0.2 3.4 ± 0.1
Feb. 18, 20 28.8 ± 0.7 15.8 ± 0.5 7 ± 0.3 10.3 ± 0.3 8.2 ± 0.2 3.3 ± 0.1
March 17, 20 28.4 ± 0.8 15.9 ± 0.4 7 ± 0.2 10.1 ± 0.4 8.3 ± 0.3 3.5 ± 0.0
March 31, 20 27.7 ± 0.8 19.3 ± 0.4 9 ± 0.3 9.5 ± 0.4 7.5 ± 0.2 3.5 ± 0.2
April 14, 20 31.9 ± 0.9 19.7 ± 0.6 10 ± 0.3 9.4 ± 0.2 7.9 ± 0.2 3.7 ± 0.5
April 28, 20 35.4 ± 0.5 21.5 ± 0.6 10 ± 0.3 9.9 ± 0.2 7.9 ± 0.3 3.9 ± 0.2
In this study, the average air relative humidity and soil moisture content were 73.7 ‑ 93.2% and 22.8 ‑ 35.0%, respectively (Fig. 2) . The relative humidity (RH) inside greenhouses is usually higher than outside, resulting in long periods of dew persistence (Yunis et al., 1990). The soil EC was controlled manually and was higher on September 17, 2019 and January 21, 2020 than on the other days. The average CO
2concentration increased until January 7, 2020 and then decreased. The net photosynthetic rate of the strawberry leaves is saturated at 600 µ mol·mol
-1CO
2(Keutgen et al., 1997). Strawberry fruit yield is highest at 720 µ mol·mol
-1CO
2(Sun et al., 2012). Therefore, it can be assumed that, except during April 2020, the average CO
2concentration was adequate for photosynthesis and fruit production to occur. PAR decreased until February 4, 2020, after which it increased. Hidaka et al. (2013) reported that the light saturation point of strawberries is 400 µ mol·m
-2·s
-1at an air temperature of 25°C; however, the average air temperature during this study was below 25°C. Jun et al. (2017) illustrated that the net photosynthetic rate of strawberries during winter in South Korea is 25% lower than in autumn. The CO
2and PAR data from this study were inversely proportional, which coincides with the findings from many other studies (Nederhoff et al.,1992; Tartachnyk and Blanke, 2007; Qian et al., 2012).
Plant height dramatically increased on November 26 and December 10, 2019 as well as on April 14 and 28, 2020 (Table 2) . The crown diameter dramatically increased on November 12 and 26, 2019 as well as on March 31 and April 25, 2020 (Table 2) . These results indicate that plant height and crown diameter data were proportional. Odongo et al. (2008) illustrated that strawberry height increases may be due to crown diameter increases. Leaf size (e.g. leaf length and width) contributes to leaf temperature and photosynthesis. It also works to optimize photosynthesis and transpiration and is responsible for the differences between transpiration costs and photosynthetic profits (Parkhurst and Loucks, 1972;
Taylor, 1975; Givnish and Vermeij, 1976). In this study, leaf length and width increased until December 10, 2019 and
then slightly decreased after March 31, 2020 (Table 2) . Jurik et al. (1982) reported that large and small leaf size is due to
low and high radiation environments (or PAR in this study). The number of leaves did not show any trend until November
Table 3. Correlation coefficients between environmental and growth data of the strawberry plants
ADAT
zST RH SMC EC CO
2PAR VPD
Plant height ‑ 0.64** ‑ 0.66** ‑ 0.30 0.04 0.29 0.27 0.31 ‑ 0.05
Crown diameter ‑ 0.71** ‑ 0.68** ‑ 0.37 ‑ 0.18 0.07 0.16 0.26 ‑ 0.05
No. of leaves ‑ 0.47· ‑ 0.50· ‑ 0.45· 0.22 0.44· 0.15 0.48· 0.16
Leaf length ‑ 0.89*** ‑ 0.85*** 0.21 ‑ 0.65** ‑ 0.33 0.42 ‑ 0.37 ‑ 0.63**
Leaf width ‑ 0.91*** ‑ 0.89*** 0.14 ‑ 0.42 ‑ 0.15 0.44 ‑ 0.26 ‑ 0.57*
Leaf area index ‑ 0.16 ‑ 0.11 0.13 ‑ 0.14 0.34 0.16 ‑ 0.13 ‑ 0.13
z
ADAT: average daily air temperature, ST: soil temperature, RH: relative humidity, SMC: soil moisture content, EC: electrical conductivity, PAR: photosynthetic active radiation, VPD: vapor pressure deficit
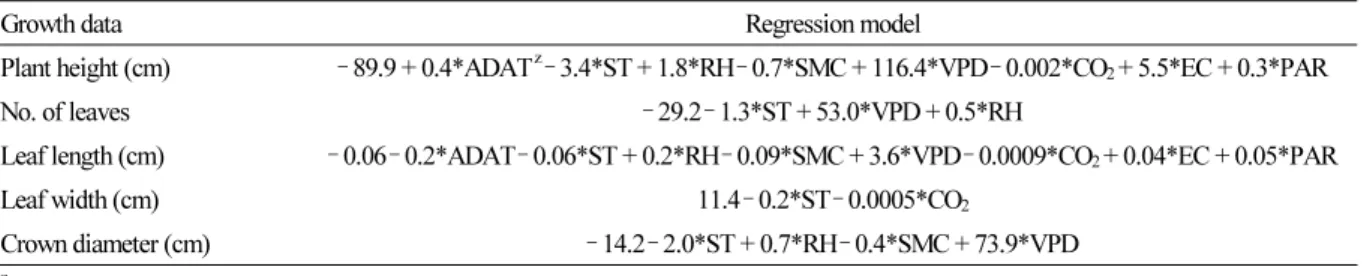
Table 4. Regression model for growth responses of the strawberry plants based on environmental data
Growth data Regression model
Plant height (cm) ‑ 89.9 + 0.4*ADAT
z‑ 3.4*ST + 1.8*RH ‑ 0.7*SMC + 116.4*VPD ‑ 0.002*CO
2+ 5.5*EC + 0.3*PAR
No. of leaves ‑ 29.2 ‑ 1.3*ST + 53.0*VPD + 0.5*RH
Leaf length (cm) ‑ 0.06 ‑ 0.2*ADAT ‑ 0.06*ST + 0.2*RH ‑ 0.09*SMC + 3.6*VPD ‑ 0.0009*CO
2+ 0.04*EC + 0.05*PAR
Leaf width (cm) 11.4 ‑ 0.2*ST ‑ 0.0005*CO
2Crown diameter (cm) ‑ 14.2 ‑ 2.0*ST + 0.7*RH ‑ 0.4*SMC + 73.9*VPD
z
ADAT: average daily air temperature, ST: soil temperature, RH: relative humidity, SMC: soil moisture content, EC: electrical conductivity, PAR: photosynthetic active radiation, VPD: vapor pressure deficit
26, 2019, at which point the leaves increased in number as a result of leaf thinning from September 18 ‑ 30, October 16
‑ 28, and November 13 ‑ 25, 2019.
The average daily air temperature and soil temperature data showed high correlation coefficients for most of the obtained strawberry plant growth data but not for the other environmental data (Table 3) . The low correlation coefficients between leaf number and LAI might be due to the leaf thinning. Sønsteby et al. (2016) illustrated that air temperatures of about 24°C are optimal for strawberry plant growth, but the air and soil temperatures during this study were below 24°C.
This leads to the conclusion that temperature data can be a major factor for the prediction of plant growth and strawberry fruit yields.
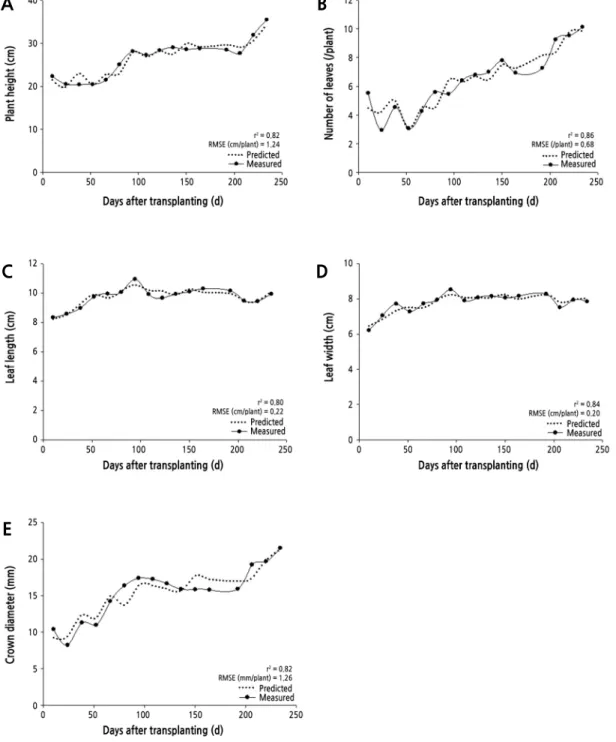
The environmental data presented in the regression model are listed in order of the most relevant variables (Table 4) . As in Table 3 , the average daily air temperature and soil temperature data were highly correlated with the growth data. The predicted data displayed a correlation coefficient of 0.8 or higher and RMSE of 0.20 ‑ 1.26 with the measured data (Fig.
3) . Growth data predictions may be used to predict fruit yields since the prediction of crop yields is generally associated with certain agronomic variables (e.g. size and vigor) (Al-Gaadi et al., 2016). For instance, Bartczak et al. (2010) reported that the fresh weight of a strawberry plant showed a high correlation coefficient of 0.8 with the total and marketable fruit yields.
PAR, vapor pressure deficits, and RH showed the highest correlation coefficients with the fruit yield data among the
environmental data (Table 5) . The soil-related data, such as soil moisture content and EC, had lower correlation
coefficients than the ambient related data. Strawberry fruit weight and yield are related to soil conditions because they
decline 50% or more under water stress conditions (Adak et al., 2018). Our results indicate that the soil in our greenhouses
A B
C D
E
Fig. 3. Multi-regression analysis by environmental data affecting growth data and comparison of predicted and measured data. The figures showed plant height (a), number of leaves (b), leaf length (c), leaf width (d), and crown diameter (e) of strawberry plants.
was well managed, as the strawberry fruit was not affected much by the soil conditions. The plant height and crown diameter data showed higher correlation coefficients with the yield data than the leaf length and width data (Table 5) . Human (1999) reported that strawberry fruit yield was correlated to crown diameter.
The environmental and growth data presented in the regression model are listed in order of the most relevant variables
(Table 6) . As in Table 5 , the soil moisture content data were highly correlated with the fruit yield data; however, the
Table 5. Correlation coefficients between fruit yield and environmental data and fruit yield and growth data of the strawberry plants
ADAT
zST RH SMC EC CO
2PAR VPD
Fruit yield 0.82** 0.80** ‑ 0.93*** 0.74* 0.30 ‑ 0.72* 0.96*** 0.93***
P H CD LL LW
Fruit yield 0.66* 0.67* ‑ 0.58· ‑ 0.54
z
ADAT: average daily air temperature, ST: soil temperature, RH: relative humidity, SMC: soil moisture content, EC: electrical conductivity, PAR: photosynthetic active radiation, VPD: vapor pressure deficit, PH: plant height, CD: crown diameter, LL: leaf length, LW: leaf width.
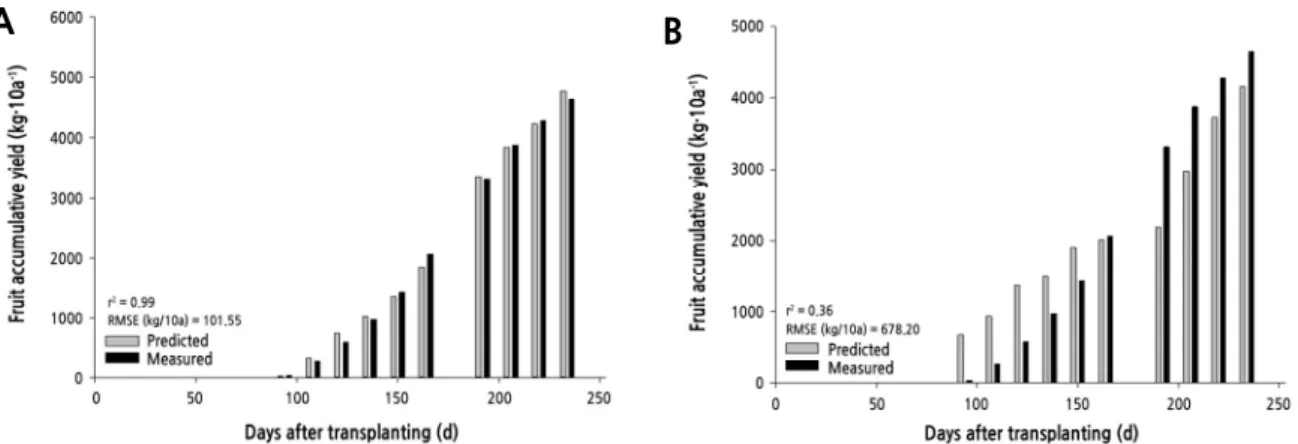
Table 6. Regression model for fruit yield of the strawberry plants based on environmental and growth data
Yield data Used data Regression model
Fruit yield (kg·10a
-1)
Environment ‑ 52771.5 + 1194.2*ADAT
z‑ 2223.2*ST + 685.0*RH + 56896.3*VPD + 78.2*PAR Growth 8302.2 + 313.5*PH ‑ 1512.2*LL ‑ 335.7*LQ + 142.2*CD
z