The Ka-band Low Noise and Stable Receiver Design of Digital Correlation Radiometer for High Spatial Resolution
Junho Choi, Sunghyun Kim, Gumsil Kang, Hyuk Park, Sehwan Choi, Jing-Shan Jiang*, Yonghoon Kim
Department of Mechatronics, Kwangju Institute of Science and Technology 1 Oryong-dong, Buk-gu, Gwangju 500-712, Korea
Tel: +82-62-970-2427, Fax: +82-62-970-2384, E-mail: [email protected]
* National Microwave Remote Sensing Laboratory, CSSAR, China
ABSTRACT
The subsystems of two channel correlation radiometer such as RF front-end, IF and LF unit, LO unit, software based I/Q demodulator and complex correlator are characterized and their performance is analyzed in this paper. The limited hardware calibration method and receiver design consideration are discussed. The receiver architecture of 37GHz correlation radiometer is integrated. The designed radiometer employs a single- sideband superheterodyne receiver. The center frequency of the radiometer is 37 GHz and IF center frequency is 1.95 GHz with the equivalent noise bandwidth of 79.6 MHz. The receiver has less than 4.2 dB noise figure which is calculated by the Y-factor method and its gain can be adjusted from 60 dB to 80 dB.
INTRODUCTION
To obtain a high spatial resolution and a radiometric accuracy, an aperture synthesis concept of the array antenna has been received the special attention in recent years. Generally, to measure the water vapor and temperature profile of the atmosphere, the frequency band of 18, 21, 37, 90 and 183 GHz are used. Recently, new type of synthetic aperture radiometer using sub-Y array type antenna configuration has been proposed by [G. S. Kang et al. 2002] to get high spatial resolution in 2-D without scanning mechanism. This type radiometer improves more than 40 % spatial resolution compared with conventional type of synthetic aperture radiometer [1]. In this paper, the frequency band of 37 GHz is selected for atmospheric applications. The 37 GHz
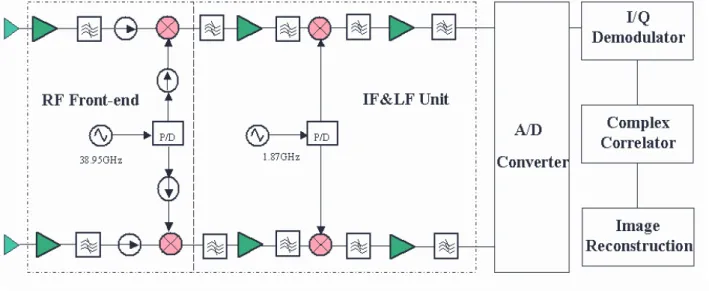
Fig. 1. Block diagram of the Ka-band correlation radiometer.
receiver that is developed for the demonstration model of 2-D interferometric radiometer to evaluate the performance of sub-Y array type interferometric synthetic aperture radiometer is presented.
DESIGN CONSIDERATION OF TWO CHANNEL RADIOMETER
A. Image frequency suppression
The atmospheric noise and astronomical noise source in the image band contaminate noise figure and noise temperature of receiver. To obtain the image suppression, image rejection filter ahead of mixer, phase switching and image rejection mixer can be used [2]. A filter is a convenient method to remove image frequency.
The total noise figure including image response is calculated by (1) [3].
10 log 1 e 1 i
d
T G
NF
Tο G
= + +
(1) where Te and To are equivalent noise temperature and ambient temperature. Gi and Gd are gain in the image band and desired gain. Added noise figure is deeply depended on the filter performance of RF front-end. To reduce added noise figure less than 0.1 dB to the total noise figure, image frequency have to be suppressed more than 16 dB. To the good image suppression, it is required more than 30 dB. When the image frequency rejection is 30 dB, the added noise temperature of receiver in this system compared with ideal image frequency rejection is 0.556 K (0.003 dB noise figure is added). The simulation data is presented by Fig. 2. When the image rejection of RF front-end is more than 30 dB, this simulation shows that added noise temperature is less than 0.6 K.
B. Gain and phase balance of two channels
Gain and phase difference of two channels generate amplitude and phase errors which degrade temperature sensitivity [4][5]. These errors have already been studied
by [F. Torres et al. 1997] and can be hardware calibrated initially by using the attenuator and phase shifter.
C. Thermal noise effect of local oscillator
The correlated noise coming from the local oscillator derive offset residual errors . Amplitude noise and phase noise are neglected by mixer operated saturation level and conjugate term of complex correlation respectively. Thermal noise of local oscillator can be reduced by using high-gain preamplifier, mixer with low conversion loss and high LO to IF isolation and LO filter [4][5]. To minimize its effect in this system, 20 dB isolator is inserted local input port. This offset error is 0.0094 K when preamplifier gain, conversion loss and LO to IF isolation is each 15 dB, 7 dB and 40 dB.
RECEIVER DESIGN
The two-channel correlation radiometer employs single-sideband dual IF superheterodyne receivers to obtain the high image suppression (or selectivity) and high stability of systems. The type of receiver is selected as conventional total power radiometer to obtain high sensitivity. The receiver is composed of RF front-end, IF and LF unit, local unit, calibration unit, A/D converter and software based I/Q demodulator and complex correlators. The RF center frequency is 37 GHz and IF frequency is 1.95 GHz. LF frequency is 80 MHz and Fig. 2. Added noise temperature being suppressed
image frequency.
20 30 40 50 60
0 2 4 6 8
RF X dB suppression and IF ideal suppression RF ideal suppression and IF X dB suppression RF 30 dB suppression and IF X dB suppression
Added Noise temperature [K]
Image frequency suppression [dB]
equivalent noise bandwidth is 79.6 MHz. The receiver was designed to obtain low noise figure, high stability and good gain/phase balance of two channels. The system block diagram is presented by Fig. 1.
A. RF front-end
The RF front-end consists of the two stage low noise amplifiers, the coupled line image rejection filter, isolator and single balanced mixer. Since noise figure degrade temperature sensitivity and receiver noise figure is dominantly determined by the preamplifier of RF front-end, the low noise amplifiers are used to reduce noise figure of receivers. The coupled line image rejection filter was designed to have more than 15 dB image suppression in the image band. A 20 dB isolator is inserted into the between coupled line image rejection filter and mixer to minimize the offsets generated by the correlation of the receivers noise radiated and coupled through the antennas. The isolator improves VSWR of RF front-end. In order to minimize reflected noise wave, VSWR must be less than 1.12 [5][6]. The isolator at the local port is inserted to provide high isolation between two channels. It reduces channel interference and thermal noise effect of local oscillator which cause offset residual errors [5][6][7]. The single balanced mixer was designed using 180ɉ hybrid coupler to increase LO to IF isolation and LO to RF isolation. It has 7 dB conversion loss and above 20 dB LO to RF and LO to IF isolation [8].
B. IF and LF unit
IF and LF unit consists of five LNAs, band-pass filters, mixer, two low-pass filters and attenuator to adjust gain and provide low VSWR. Five LNAs provide suitable gain to A/D converter. Two band-pass filter with the center frequency of 1.95 GHz and 79.6 MHz noise bandwidth is inserted for channel selection and image frequency rejection which is above 40 dB in the image band. IF mixer converts IF frequency of 1.95 GHz into LF frequency of 80 MHz to satisfy sampling frequency
(f<250 MHz ) of A/D converter. Low-pass filter with the bandwidth of 110 MHz was designed by the type of chebyscheff filter. Although it has high peak group delay(12 ns), it has been selected to obtain high channel selectivity. Since filters’ response mismatches result in non-separable errors [4][5], the performance of filters was confirmed and group delay was closely matched.
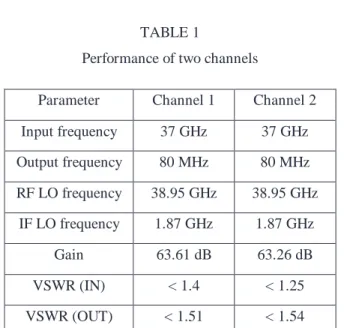
The performance of designed two channel receivers is presented by Fig. 3. and listed at the table 1. Gain difference of two channel is maximum 1.65 dB within bandwidth. This difference can be initially calibrated by attenuator.
TABLE 1
Performance of two channels
Parameter Channel 1 Channel 2 Input frequency 37 GHz 37 GHz Output frequency 80 MHz 80 MHz RF LO frequency 38.95 GHz 38.95 GHz
IF LO frequency 1.87 GHz 1.87 GHz
Gain 63.61 dB 63.26 dB
VSWR (IN) < 1.4 < 1.25 VSWR (OUT) < 1.51 < 1.54
0 20 40 60 80 100 120 140 160
-10 0 10 20 30 40 50 60 70
Channel 1 Channel 2
Conversion Gain
Freq [MHz]
Fig. 3. Gain characteristics of two channels.
C. LO unit
In the correlation techniques, all of the local oscillator signals must be coherent to measure the I/Q correlation between the input signals of two channels [9].
The coherent signal generator was used to provide LO signal in this system. To provide in-phase local signal between the two channels, the power divider was designed accurately. In-phase and equal gain injection is required to remove the gain and phase errors generated by local input [6]. High isolation is required to reduce channel interference [7]. The isolation resistance in the isolation ports adds correlated thermal noise at the output of the power splitter which cause the offset residual errors [4][5]. To remove resistance at the isolation ports, absorber material was used. The designed power splitter has the 0.056 dB gain difference, 3.5 dB phase difference and 31 dB isolation.
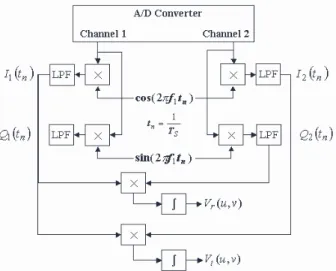
D. I/Q demodulator and Complex correlators
Fig. 4. Block diagram of software based I/Q demodulator and complex correlator.
The visibility function can be measured by an analog complex correlator or by an I/Q demodulator and a digital real correlator. The analog correlator has been mainly used for the 1-D interferometric synthetic aperture radiometer. For 2-D interferometric radiometer, the digital real correlator is used because it is difficult to realize a lot of analog complex correlators whose
characteristics should be same. The software based I/Q demodulator and real correlator are developed for the 37 GHz demonstration model. The description of algorithm used for I/Q demodulation and correlation is shown in Fig. 4. The I/Q demodulator can be used together with A/D of various sampling frequencies. It is possible to change the integration time of the correlator.
HARDWARE CALIBRATION
Although receiver is designed accurately, amplitude and phase errors must be reduced to the required radiometric accuracy for applications. Correlated noise source injection method is used to calibrate receiver channel errors or separable errors. Uncorrelated noise source injection method is used to calibrate baseline errors or nonseparable errors [4][9][10]. In this system, limited calibration was tested. To calibrate inphase errors of two channels, phase shifter was inserted between LF output and A/D converter. Until the imaginary part of the correlation value is zero, phase shifter is adjusted [10].
To calibrate gain difference of channel, attenuator is used. Attenuator is adjusted until the correlation value is maximum.
EXPERIMENT SETUP
For measuring frequency characteristics of I/Q demodulated signal and gain/phase difference of correlation value within bandwidth, as shown in the Fig.
5 and Fig. 6, two channel correlation radiometer was composed. Single signal source was used as RF input source and microwave phase stable cables were used to connect RF signal source with receivers. To provide RF front-end and IF & LF unit with coherence LO signal, signal generators with equal reference signal were used.
LF signal was connected to A/D converter of which the signal was used to soft-based I/Q demodulator and complex correlator. To ensure temperature stability of receivers, thermal box was designed. The measurement data is presented by Fig. 7 and Fig 8.
As shown the measurement data, the frequency
characteristics of I/Q demodulated signal and correlation value is constant through the frequency band when the I/Q demodulated signal is constant. The degrading of correlation value is resulted in the frequency characteristics of receiver. In this system, normalized correlation value is degraded as 0.3 and errors derived I/Q demodulator are neglected since software based I/Q demodulator do not generate I/Q demodulation error.
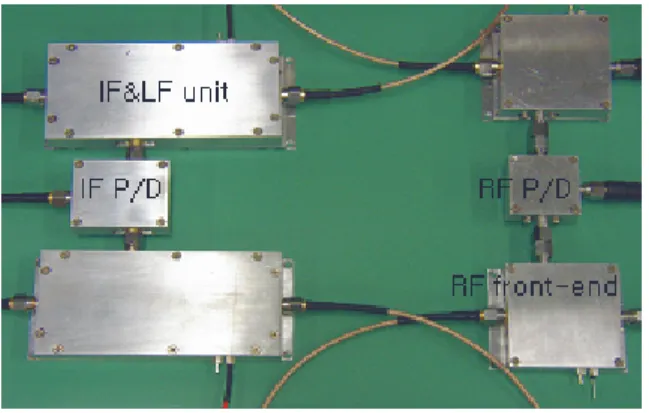
Fig. 5. Photograph of RF and IF & LF unit
Fig. 6. Photograph of experiment setup.
37.03 37.04 37.05 37.06 37.07 37.08 37.09
0.55 0.60 0.65 0.70 0.75 0.80 0.85 0.90 0.95 1.00
Channel 1 Channel 2 Correlation value
Normalized I/Q amplitude
Freq [GHz]
Fig. 7. Frequency amplitude characteristics of normalized I/Q signal and correlation value.
Fig. 8. Frequency phase characteristics of normalized I/Q signal and correlation value.
CONCLUSION
In this paper, the performance of designed receiver was introduced. Some consideration for hardware design and hardware calibration was discussed. This system will provide the consideration of hardware design and limited calibration method for developing sub-Y array type interferometric synthetic aperture radiometer. Further test are being conducted to evaluate the performance of the system.
ACKNOWLEDGEMENT
This work was supported in part by the international collaboration program with Center for Space Science and Applied Research (CSSAR), Chinese Academic of Science funded by MOST. The authors wish to acknowledge Prof. Jiang at CSSAR.
REFERENCES
[1] G. S. Kang, Y. H. Kim, 2002, “Spatial and Temperature Resolution of Sub-Y type Antenna Array Cnfiguration for High Resolution Interfermetric Synthetic Aperture Radiometer,” in Proc. IGARSS 2002.
[2] A. R. Kerr, “Image Frequency Suppression on the MMA,” MMA Memo 70. Dec. 1991.
[3] P. Wade, N1BWT, “Noise Measurement and Generation(Quality weak-signal reception requires a
37.03 37.04 37.05 37.06 37.07 37.08 37.09 -50
0 50 100 150 200
Channel 1 Channel 2 Correlation value
Phase [deg]
Freq [GHz]
low-noise system. Here’s how to calculate and measure the noise performance of your system ), Published by the American Radio Relay Leage. Inc, pp. 3-12, Nov. 1996 [4] F. Torres, A. Camps, J. Bara’, I. Corbella. “Impact of Receiver Errors on the Radiometric Resolution of Large Two-Dimensional Aperture Synthesis Radiometers,”
IEEE Radio Science, vol. 32, no. 2, pp. 629- 647, Mar- Apr. 1997.
[5] A. Camps, “Application of Interferometric Radiometery to Earth Observation,” Ph,D. thesis, Universitat Politecnica de Catalunya, Barcelona, Spain, Nov. 1996.
[6] I. Corbella, A. Camps, F. Torres, J. Bara’. “Analysis of Noise-Injection Networks for Interferometric- Radiometer Calibration,” IEEE Transactions on microwave theory and techniques, vol. 48, no. 4, pp.
545- 552, Apr. 2000.
[7] A. Camps, I. Corbella, F. Torres, J. Bara’, J.
Capdevila. “RF Interference Analysis in Aperture Synthesis Interferometric Radiometers: Application to L- Band MIRAS Instrument,” IEEE Transactions on geoscience and remote sensing, vol. 38, no. 2, pp. 942- 950, Mar. 2000.
[8] S. T. Choi, Y. H. Kim, " Design of Microstrip Balanced Diode Mixer For 38GHz Band," Spring Conference on Microwave and Wave propagation, vol.
22, no.1, pp.26-29, May. 1999.
[9] B. Laursen, N.Skou, “Calibration of the TUD Ku- band Synthetic Aperture Radiometer,” in Proc. IGARSS, pp812-814, 1995.
[10] A. Camps, F. Torres, J. Bara’, I. Corbella and X.soler. “Calibration and Experiment Results of a Two- Dimensional Interferometric Radiometer Laboratory Prototype,” IEEE Radio Science, vol. 32, no. 5, pp.
1821- 1832, Sept-Oct. 1997.