제 46 권 제 3 호 2009 년 6 월 ii. Vol. 46, No. 3, pp. 290-302, June 2009 DOI: 10.3744/SNAK.2009.46.3.290
Parametric Study of the Vibration Transmissibility for the Rubber Mount of the Seawater-Conveying Pipe in a Ship
Hyung Suk Han
*and Weui Bong Jeong
✝**Naval Sea System Center, Defense Agency for Technology and Quality
*Department of Mechanical Engineering, Pusan National University
**선박의 해수 이송 배관용 고무 마운트의 진동 전달률에 대한 파라미터 연구
한형석
*, 정의봉
✝**국방기술품질원 함정센터
*부산대학교 기계공학부
**A b s t r a c t
Pipe system widely used in a ship is usually attached to the hull of a ship, and its vibration lead to structure-borne noise. Rubber mount is usually used as a vibration isolator of a pipe in a ship. In this paper, the effects of several factors, besides the stiffness and damping of the rubber mount, on vibration-isolating performance are taken into consideration. The parameters considered in this paper are hardness of the rubber material, painting on the rubber and deformation from clamping. Through the results of parametric study, the effective specifications of rubber mount are suggested to improve vibration- isolating performance. The performance under fluid flowing condition is calculated numerically and verified experimentally.
※Keywords: Rubber mount(고무 마운트), Transmissibility(전달률), Accelerance(엑셀러런스), Receptance(리셉턴스), Seawater-conveying pipe(해수 이송 배관), Vibration-isolating performance(진동 절연 성능), Frequency response function(주파수 응답함수)
접수일: 2009 년 1 월 20 일, 승인일: 2009 년 4 월 2 일 g교신저자: [email protected], 051-510-2337
1. Introduction
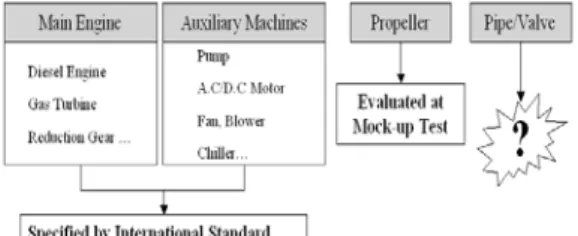
One of the main sources of URN(Underwater Radiated Noise) is the structure borne noise of the equipments established in a ship. Therefore, the vibration of the equipment is very important for reducing URN and widely restricted by the international standards such as MIL-Std-740- 2(Department of Defense 1986). The sources of the structure borne noise related to URN can be classified as Fig. 1. As shown in Fig. 1, the vibration from the main engine, auxiliary machines are severely restricted by international standard. And the fluid induced noise from the propeller system is also considered at the state of mock-up sample test before construction in a ship. But even though the pipe system is one of the main sources of the structure borne noise, it has not been severely restricted related to the protection of the vibration. Therefore, the countermeasure for reducing the vibration from the fluid flowing in a pipe is severely required in order to reduce URN.
Even though reducing mass flow rate and pressure level in a pipe are effective methods to reduce the structure borne noise from the pipe, they are very difficult to apply because of the requirements of the operating condition of the system. Simplifying the layout of the pipe system
Fig. 1 Classification of the sources of the structure borne noise related to URN
is also very effective method to reduce it but very difficult to apply because of the complex structure of a ship. In this paper, the vibration- isolating ability of the rubber mount of a pipe system is considered in order to reduce the transmitted vibration from the pipe to the hull in a ship. Usually, rubber material is widely used for the vibration-isolating material and many of researches are going on.
Chung et al.(2004) evaluated the vibration- isolating performance of the mount that developed by Engineering Experiment Station in U.S. The ratio of dynamic and static stiffness could be estimated with the load-deformation curve under the static and the dynamic load, and it was verified that the dynamic stiffness was higher than static one due to the effect of viscosity of a rubber.
Lee et al.(1990) studied the dynamic properties of the rubber material for the vibration isolation. And the dynamic and static stiffness as well as Young’ s modulus and loss factor were estimated according to KS M 6604(Korean Standard Association 2006) and 6665(Korean Standard Association 2001) for the neoprene rubber mount grading 40 and 60 durometer. Kim and Kim(2003) suggested the shear modulus of the rubber mount according to the various rubber materials and their hardness.
The performance of vibration isolator for the pipe system is very important at the high frequency range because the frequency of the exciting force from the fluid is laid on the high frequency range.
But almost all researches have not severely considered these frequency ranges because they were treated as the isolation region in the transmissibility curve. Therefore, in this research, the evaluation method of the vibration-isolating ability of the rubber for the pipe system is
suggested using frequency response function (accelerance) at the range of the high frequency.
The parametric studies are performed experimentally in order to improve the vibration- isolating ability of the rubber with accelerance.
And the FEM model is established to be coincident with the results from the parametric study. Through this FEM model, the vibration on the pipe is estimated numerically when the water is flowing in a pipe. Finally, the results of the vibration analysis of the FEM model are verified experimentally and the design of the mount from the parametric study is suggested.
2. Parametric study of vibration transmissibility
Rubber is the unique material that is both elastic and viscous. Therefore, it is widely used for the vibration-isolating material in the industry.
Because the rubber material is sensitive to the environmental conditions such as temperature and oils, they should be considered when the isolator is installed. In this research, neoprene (CR) is applied for the material of rubber mount to the seawater-conveying pipes, and the vibration-isolating performance of it is evaluated with the stiffness of the rubber mount and the frequency response function (accelerance).
The stiffness of the mount is one of the important factors affected to the transmissibility as shown in Eq. (1) for the 1 degree of freedom model. In Eq. (1), the transmissibility is the function of stiffness and damping coefficient.
2 2 2
2
0 (1 ) ( )
) / ( 1
k c k m
k c F
T FT
ω ω
ω +
−
= +
=
(1)
-30 -20 -10 0 10 20 30
10 100 1000
Frequency[Hz]
Transmissibility
√2 fn fn
Amplication region
Isolation region Increasing stifness
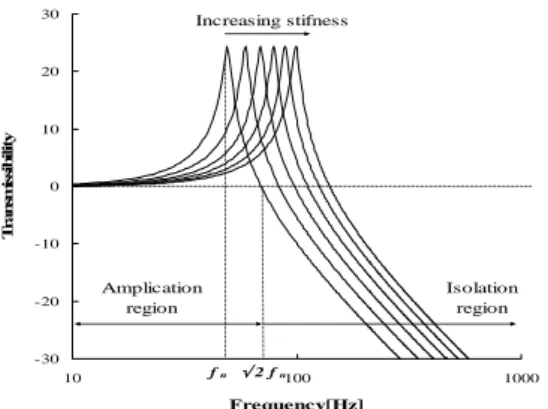
Fig. 2 Transmissibility curve as increasing the stiffness of the anti-vibration mount
Here, k and c are the stiffness and damping coefficient of the mount respectively, m is the mass, ω is the frequency(rad/s), FT is the transmitted force under the mount and F0 is the excited force upper the mount.
Fig. 2 is the transmissibility curve as increasing the stiffness of the anti-vibration mount. In Fig. 2, it can be known that the transmissibility is increased as increasing the stiffness of the anti-vibration mount.
From Eq. (1) and Fig. 2, it can be found that the stiffness of the mount should be low in order toreduce vibration transmissibility. In this research, the stiffness is simply calculated by the resonance frequency according to Eq. (2).
)2
2 ( fn m
k= π
(2)
Here, fn is the resonance frequency.
The frequency response function can show the characteristics of the mount how much force it transfers to the base for the input force and it can be represented as given in Eq. (3).
) (
) ( ) (
) ( ) (
) ( ) (
) ) (
( *
*
f G
f G f S
f S f A
f A f A
f f B H
AA AB AA
AB =
=
⋅
=
(3)
Here, A(f) is the input function, B(f) is output function, A*(f) is the complex conjugate of A(f), SAB(f) is the cross spectrum of A(f) and B(f), GAB(f) is one side form of SAB(f), SAA(f) is the auto spectrum of A(f) and GAA(f) is one side form of SAA(f).
In order to evaluate the vibration-isolating performance of the mount experimentally, test jig was manufactured as shown in Fig. 3(a). Impact force was applied using the impact hammer(PCB Type 6200S) on the pipe and the acceleration was measured on the pipe as well as the base and clamping support with the accelerometer (Dytran Type 3148D). Fig. 3(b) shows the schematic diagram of the modal test in this research.
The parametric studies of the mount performance are conducted considering that the main factors affecting to the mount performance are hardness of the rubber, painting on the mount and clamping force. The mount performance according to the main factors is evaluated with the accelerance and stiffness of the mount. In the modal testing, the frequency range was set from 0 to 2.5kHz because the input spectrum level of the impact force over 2.5kHz was suddenly decreased. Impact forces were loaded to the 8 points on the pipe in the horizontal and the vertical direction respectively as shown in Fig. 3(b). Here, the accelerance on the clamping support and base of the test jig are calculated as shown in Eq. (4).
∑
=⋅
=
8
1
*
*
) (
) ( ) (
) ( 8 ) 1 (
i i
ij i i
j F f
f A f F
f f F
H
(4)
Here, j denotes the measured point (1: point on the base, 2: point on the upside of the clamping support, 3: point on the bottom-side of the
(a) Test jig
(b) Schematic diagram Fig. 3 Experiment setup
clamping support), i denotes impact point on the pipe, Hj(f) is frequency response function, Aij (f) is the acceleration on the point “ j” of the test jig respect to the Fi(f), Fi(f) is the impact force on the point “ i” of the pipe, F*i(f) is the conjugate value of Fi(f).
The accelerance in Eq. (4) represents average acceleration level transferred through the rubber mount with respect to the normalized impact force at 8 points on the pipe. If the rubber mount can isolate the vibration from the input force of the pipe effectively, the acceleration level on the clamping support and base of the test jig should be low. Therefore, from Eq. (4), it can be evaluated how much acceleration is transfer to the clamping support and base for the force induced by the pipe system.
In the vertical direction, accelerance could be obtained from the response of the base for the vertical impact force on the pipe. And, in the horizontal direction, it could be obtained from the response of the upper and bottom side of the clamping support for the horizontal impact force on the pipe.
2.1 Effects of the hardness of the mount The material of the rubber mount used to the conventional pipe is neoprene (CR) and the hardness is shore “ A” 65.
Neoprene rubber is widely used in a ship because of the good performance against heating and oily environment. One of the main factors affecting vibration-isolating capability of the rubber mount is the hardness of the rubber.
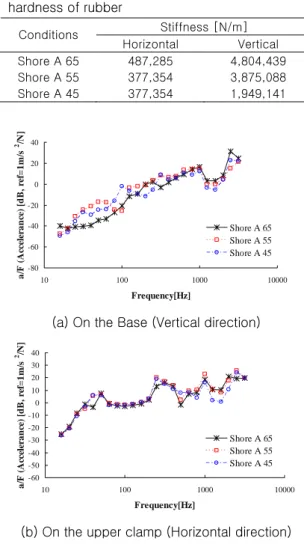
Therefore, the variation of stiffness and accelerance according to the hardness of the rubber mount is evaluated. In order to verify the effects of the hardness, rubber samples grading 45, 55 and 65 degree of shore “ A” hardness were manufactured with the same shape. Table 1 shows the variation of the stiffness. The stiffness is estimated from the natural frequency of accelerance with the vertical and horizontal direction respectively from Eq. (2).
In Table 1, it can be known that the stiffness is reduced about 33% when the hardness of the rubber material is reduced from 65 to 45 degree in the horizontal direction. In the vertical direction, the variation of the stiffness is much bigger than those in the horizontal direction. Comparing 45 with 65 degree, the stiffness is reduced about 59%. The results of the accelerance according to the stiffness variation referred to above are as given in Fig. 4, which shows the 1/3 octave spectrum of the accelerance according to the hardness of the rubber mount grading 45, 55 and 65 shore “ A” hardness when the pipe is
Table 1 Variation of the stiffness according to the hardness of rubber
Stiffness [N/m]
Conditions
Horizontal Vertical Shore A 65 487,285 4,804,439 Shore A 55 377,354 3,875,088 Shore A 45 377,354 1,949,141
-80 -60 -40 -20 0 20 40
10 100 1000 10000
Frequency[Hz]
a/F (Accelerance) [dB, ref=1m/s2/N]
Shore A 65 Shore A 55 Shore A 45
(a) On the Base (Vertical direction)
-60 -50 -40 -30 -20 -10 0 10 20 30 40
10 100 1000 10000
Frequency[Hz]
a/F (Accelerance) [dB, ref=1m/s2/N]
Shore A 65 Shore A 55 Shore A 45
(b) On the upper clamp (Horizontal direction)
-60 -50 -40 -30 -20 -10 0 10 20 30 40
10 100 1000 10000
Frequency[Hz]
a/F (Accelerance) [dB, ref=1m/s2/N]
Shore A 65 Shore A 55 Shore A 45
(c) On the bottom clamp(Horizontal direction)
Fig. 4 1/3 Octave accelerance according to the hardness of the rubber mount
loaded by the impact hammer. In Fig. 4, it can be known that the accelerance is reduced over the range of 1kHz according to the reduction of the hardness of the rubber. However, the accelerance is increased at the low frequency range.
The frequency of the fluid induced vibration in a pipe is generally high frequency and the main object of the rubber mount in this research is reducing the vibration from the fluid force.
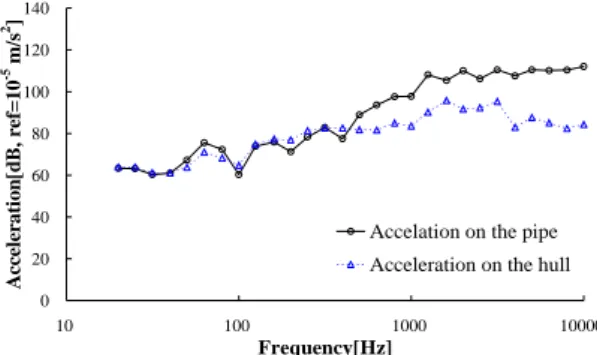
Fig. 5 shows the measured spectrum of the acceleration on the pipe for a typical ship and it can be found that the dominant frequency of the vibration on the pipe is high frequency range.
Therefore, in this research, the accelerance at the low frequency range is disregarded because the main object improving the performance of the rubber mount is reducing the transmitted vibration to the hull at the high frequency range.
0 20 40 60 80 100 120 140
10 100 1000 10000
Frequency[Hz]
Acceleration[dB, ref=10-5 m/s2]
Accelation on the pipe Acceleration on the hull
Fig. 5 1/3 Octave acceleration measured on the pipe for a typical ship
.
2.2 Effects of the painting
Painting on the rubber is usually restricted because it may stiffen the rubber material. The thickness of painting film is about 0.3~1mm and painting itself is sufficiently stiff. In spite of these problems, the painting on the rubber mount of
the seawater-conveying pipe in a ship is usually applied because of the difficulties of the production. Fig. 6 shows the schematic diagram of the transferred vibration from the paint film, and the painting on the rubber mount of the seawater-conveying pipe applied in a ship.
Therefore, it needs to evaluate how much level of the stiffness and accelerance increase when painting is applied on the rubber mount.
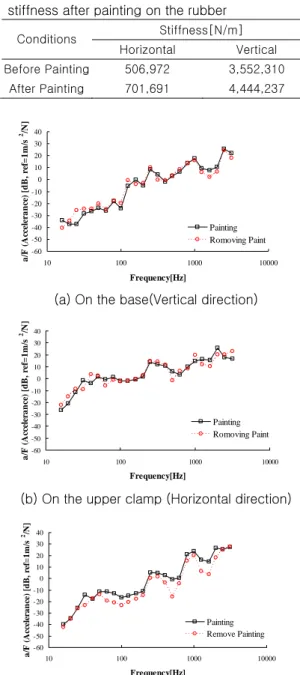
Table 2 shows the variation of the stiffness according to the painting(The rubber mount was65 degree of shore “ A” . The type of the paint was epoxy and the thickness of the painting was about 0.3mm). In Table 2, it can be found that the stiffness increases about 38% in the horizontal direction when the painting is applied. Also, in vertical direction, the stiffness increases about 25%.
(a)Schematic diagram of the paint film
Pipe
Clamp
Rubber Mount
(b)Typical application of painting on the rubber mount
Fig. 6 Painting on the rubber mount of the pipe applied in a ship
Table 2 Variation of the natural frequency and stiffness after painting on the rubber
Stiffness[N/m]
Conditions
Horizontal Vertical Before Painting 506,972 3,552,310
After Painting 701,691 4,444,237
-60 -50 -40 -30 -20 -10 0 10 20 30 40
10 100 1000 10000
Frequency[Hz]
a/F (Accelerance) [dB, ref=1m/s2/N]
Painting Romoving Paint
(a) On the base(Vertical direction)
-60 -50 -40 -30 -20 -10 0 10 20 30 40
10 100 1000 10000
Frequency[Hz]
a/F (Accelerance) [dB, ref=1m/s2/N]
Painting Romoving Paint
(b) On the upper clamp (Horizontal direction)
-60 -50 -40 -30 -20 -10 0 10 20 30 40
10 100 1000 10000
Frequency[Hz]
a/F (Accelerance) [dB, ref=1m/s2/N]
Painting Remove Painting
(c) On the bottom clamp (Horizontal direction) Fig. 7 1/3 Octave accelerance according to the painting
Fig. 7 shows the 1/3 octave spectrum of the accelerance according to the painting on the rubber mount. The accelerance is increased at
the range of high frequency according to the painting on the rubber. From the test results, it can be seen that the painting on the rubber mount should increase the transmitted vibration at the range of the high frequency.
2.3 Effects of the clamping force
Clamping of the rubber mount causes the compression of the rubber. The compression of the rubber increases its stiffness and reduces its vibration-isolating performance. In order to verify it, modal testing was performed by changing the dimension of clamping for the rubber mount (shore “ A” 45) as shown in Fig. 8. In Fig. 8, washer with thickness of 2.5mm and 5.0mm were inserted between upper and bottom clamp in order to adjust the compressed deformation of rubber.
Table 3 shows the variation of the stiffness according to the deformation of the rubber from clamping. It could be known that the deformation of rubber from clamping didn’t occur when 5mm washer was applied between upper and bottom clamp. Comparing the stiffness from the test results, applying 5mm washer can decreased the stiffness about 29% in the horizontal direction and 72% in vertical direction as shown in Table 3.
Fig. 8 Variation of clamping dimension of the mount for the seawater-conveying pipe applied in a ship.
Table 3 Variation of the natural frequency and stiffness according to the deformation of rubber mount
Stiffness[N/m]
Conditions
Horizontal Vertical No Washer 487,285 2,901,102 2.5mm Washer 430,565 2,445,003 5.0mm washer 377,354 1,685,812
-60 -50 -40 -30 -20 -10 0 10 20 30 40
10 100 1000 10000
Frequency[Hz]
a/F (Accelerance) [dB, ref=1m/s2/N]
No washer 2.5mm Washer 5mm washer
(a) On the base(Vertical direction)
-60 -50 -40 -30 -20 -10 0 10 20 30 40
10 100 1000 10000
Frequency[Hz]
a/F (Accelerance) [dB, ref=1m/s2/N]
No washer 2.5mm Washer 5mm Washer
(b) On the upper clamp(Horizontal direction)
-60 -50 -40 -30 -20 -10 0 10 20 30 40
10 100 1000 10000
Frequency[Hz]
a/F (Accelerance) [dB, ref=1m/s2/N]
No washer 2.5mm Washer 5mm Washer
(c) On the bottom clamp(Horizontal direction) Fig. 9 1/3 Octave accelerance according to the deformation of the rubber at clamping
Fig. 9 shows the 1/3 octave spectrum of the accelerance according to the deformation of rubber mount due to the clamping given in Fig. 8.
In Fig. 9, it can be seen that the accelerance is increased over the range of 500Hz according to the deformation of the rubber mount. Comparing Fig. 9 with Fig. 4 and Fig. 7, it can be found that the variation of accelerance from the deformation of rubber is more dominant than that from the hardness and painting.
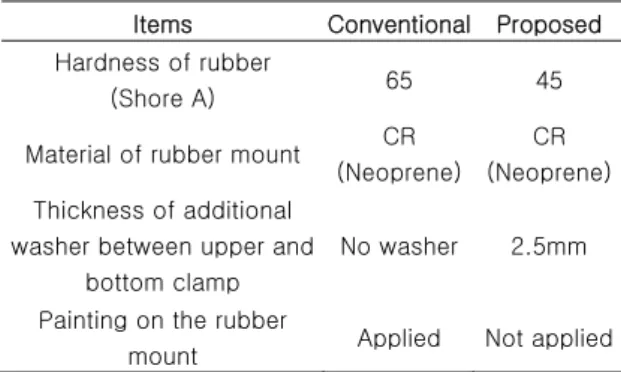
2.4 Proposed specification of the rubber mount
Through the parametric study of the rubber mount, the improved specifications of it can be suggested as shown in Table 4. Applying 5.0mm washer could reduce the accelerance most, but there could be clearance between the clamp and mount because of the tolerance of the dimensions. Therefore, 2.5mm washer inserting is suggested as shown in Table 4.
In the next chapter, the forced vibration of the rubber mount applying for the proposed specification as given in Table 4 will be evaluated by the forced vibration analysis numerically.
Table 4 Test conditions for the vibration test flowing water in a pipe
Items Conventional Proposed Hardness of rubber
(Shore A) 65 45
Material of rubber mount CR (Neoprene)
CR (Neoprene) Thickness of additional
washer between upper and bottom clamp
No washer 2.5mm
Painting on the rubber
mount Applied Not applied
3. Numerical analysis
In general, the stress-strain curve of the rubber material is not linear. But it has linearity within 2% elongations. The deformation of the vibration isolator is usually very low. Therefore, the rubber mount can be assumed to be a linear material. The finite element vibration analysis is conducted with MSC. Nastran to estimate the improvement of the vibration-isolating performance of the rubber mount at the fluid flowing condition when applying proposed specification in Table 4.
Fig. 10 shows the FEM model of the pipe. The beam element is used to model the pipe. And rubber mount including clamp and support are modeled with solid tetra element. The clamping support welded to the base assumed to have fixed boundary condition as shown in Fig. 10(b).
And the impact force is assumed to apply on the pipe as shown in Fig. 10(c).
(a) FEM model
(b) Boundary condition
(c) Impact force
Fig. 10 FEM model of the pipe jig
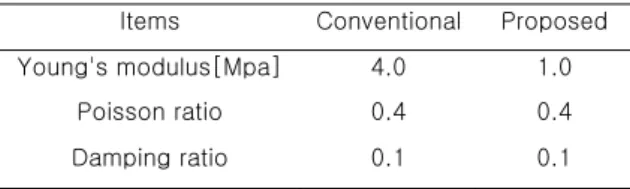
3.1 Frequency response function (accelerance) Table 5 shows the material properties of the rubber mount in this analysis. The material properties of the conventional rubber mount were basically referred to the researches in the reference(Cyril and Harris 1961, Lee et al. 1990).
Fig. 11 shows the comparison of test and FEM results of receptance at the clamping support in the horizontal direction. The level and pattern of the FEM results shows similar to those of the test.
Fig. 12 shows calculated 1/3 octave spectrum of the accelerance at the clamping support in the horizontal direction. It can be found that the FEM results of accelerance at the high frequency range are similar to the test results.
Table 5 Material property of the rubber and calculating natural frequency
Items Conventional Proposed Young's modulus[Mpa] 4.0 1.0
Poisson ratio 0.4 0.4
Damping ratio 0.1 0.1
Pipe
Clamping Support Rubber
Clamp
Multi Point Constraint
Fixed
1.E-08 1.E-06 1.E-04 1.E-02 1.E+00
0 500 1000 1500 2000 2500
Frequency [Hz]
X/F[mm/kfg] Test(Each point)
Test(Average)
1.E-08 1.E-06 1.E-04 1.E-02 1.E+00
0 500 1000 1500 2000 2500
Frequency [Hz]
X/F[mm/kfg] FEM
(a) Conventional
1.E-08 1.E-06 1.E-04 1.E-02 1.E+00
0 500 1000 1500 2000 2500
Frequency [Hz]
X/F[mm/kgf]
Test(Each point) Test(Average)
1.E-08 1.E-06 1.E-04 1.E-02 1.E+00
0 500 1000 1500 2000 2500
Frequency [Hz]
X/F[mm/kgf] FEM
(b) Proposed
Fig. 11 Comparison of receptance by FEM and Test
-120 -100 -80 -60 -40 -20 0 20 40 60
10 100 1000 10000
Frequency[Hz]
a/F (Accelerance) [dB, ref=1m/s2/N]
Conventional Proposed
(a) FEM
-120 -100 -80 -60 -40 -20 0 20 40 60
10 100 1000 10000
Frequency[Hz]
a/F (Accelerance) [dB, ref=1m/s2/N]
Conventional Proposed
(b) Test
Fig. 12 1/3 octave accelerance at the clamping support
Fig. 13 shows the measured spectrum of the acceleration on the pipe in the radial direction.
The pressure of a fluid in a pipe is 5.0bar and the flow rate of a fluid is 60m3/hr.
Assuming that the acceleration from the test is concentrated to the center of the pipe, the forced vibration analysis was performed. Fig.
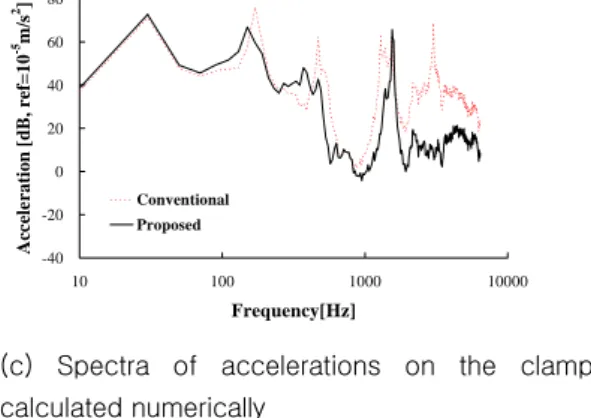
14(a) and (b) show the average vibration (displacement) contour from 2kHz to 6.4kHz for conventional and proposed mounts and Fig.
14(c) shows the acceleration level on the clamp from 0 to 6.4kHz calculated numerically. In Fig.
14(a) and (b), it can be seen that the vibration level transferred to the clamp can be reduced applying the proposed mount much more than conventional one. And in Fig. 14(c), the acceleration level at the high frequency range over 2kHz is estimated to be reduced when the proposed mount is applied. Through the results from the analysis, it can be estimated that the vibration-isolating performance could be improved when the proposed rubber mount is applied. These analysis results will be verified experimentally in the next chapter.
20 30 40 50 60 70 80 90 100
10 100 1000 10000
Frequency[Hz]
Acceleration [dB, ref=10-5m/s2]
Fig. 13 Measured spectrum of the acceleration on the pipe in radial direction
(a) Vibration contour for conventional mount
(b) Vibration contour for proposed mount
-40 -20 0 20 40 60 80
10 100 1000 10000
Frequency[Hz]
Acceleration [dB, ref=10-5m/s2]
Conventional Proposed
(c) Spectra of accelerations on the clamp calculated numerically
Fig. 14 Results of forced vibration analysis
4. Experimental verification
The effectiveness of proposed rubber mount was verified experimentally. The experimental setup of pump-pipe system conveying seawater is given in Fig. 15(a), and the schematic diagram of pump test is given in Fig. 15(b). Test conditions are the same as Table 4.
Accelerations of the 12 points at the clamping- support and 8 points at the base were measured.
Accelerations at the 6 points of the pipe were also measured in order to monitor the variation of the fluid force. The frequency range of the test was set form 0 to 6.4kHz. The pressure and mass flow rate in a pipe were set to 5.0bar and 60m3/hr respectively.
Fig. 16 shows the measuring accelerations on the clamping support and the base. Here, the acceleration on the pipe is denoted only when the conventional mount is applied because it was almost same as the acceleration on the pipe when the improved mount was applied. The acceleration on the clamp for the proposed one is lower than that of the conventional one over all frequency range as shown in Fig. 16, which is similar to the FEM results in section 3.2.
Pipe Test Jig Seawater input Seawater
Pump Flow direction
(a) Test jig for pump test
(b) Schematic diagram of the pump test Fig. 15 Experiment setup
30 40 50 60 70 80 90
10 100 1000 10000
Frequency[Hz]
Acceleration[dB, ref=10-5m/s2]
Conventional Proposed Acc. on the pipe
(a)On the clamping support(Horizontal direction)
30 40 50 60 70 80 90
10 100 1000 10000
Frequency[Hz]
Acceleration[dB, ref=10-5m/s2]
Conventional Proposed Acc. on the pipe
(a) On the Base (Vertical direction) Fig. 16 1/3 Octave acceleration measured from pump test
5. Conclusion
The vibration-isolating performance of the seawater-conveying pipe is evaluated numerically and experimentally, and the following conclusions are obtained.
1> Painting on the rubber, deformation from the clamping and hardness of the rubber material are main factors to affect the vibration transmissibility of the rubber mount.
2> Among the hardness, painting and the clamping of the rubber mount, the clamping is most effective one on the vibration transmissibility of the rubber mount.
3> Vibration-isolating performance under the fluid flowing condition can be estimated from the frequency response function of the impact test.
4> Proposed design of the rubber mount and clamp from the parametric study and numerical analysis should be able to reduced the vibration transmissibility of the pipe
system.
Because this reach was performed with the test jig not in real pipe systems, it should be verified more in a ship. The other factors affecting to the performance of the vibration isolating such as the shape of the rubber mount should be reviewed additionally.
Reference
• Chung, J.H., Kim, B.H., Kwak, J.S., Jeong, J.A.
and Lee, H.Y., 2004, “ An Experimental Study on the Characteristics of Rubber Mounts for Naval Shipboard Application,” Proceedings of the Annual Spring Meeting, SNAK, pp. 402- 409.
• Cyril, M. and Harris, 1961, Shock and Vibration Handbook, 4th edition, McGraw-Hill.
• Department of Defense, 1986, MIL-S-740-2:
Structure Borne Vibratory Acceleration Measurements and Acceptance Criteria of Shipboard Equipment, USA.
• Kim, W.D. and Kim, W.S., 2003, “ Estimation and Evaluation of the Mechanical Property for Vibration Isolating Rubber Material,” KSNVE, Vol. 13, No. 5, pp. 319-325.
• Korean Standard Association, 2001, KS-M- 6665: Testing Method of Dynamic Properties of rubber materials for vibration isolators, Korea.
• Korean Standard Association, 2006, KS-M- 6604: Testing Method for Rubber Vibration Isolator, Korea.
• Lee, G.S., Lee, S.Y. and Ryu, C.H., 1990,
“ Test and Analysis for Dynamic Properties of Rubber Materials for Vibration Isolation (1),”
KSNVE Autumn Conference, pp. 27-32.
< 한 형 석 > < 정 의 봉 >
![Fig. 11 Comparison of receptance by FEM and Test -120-100-80-60-40-200204060 10 100 1000 10000 Frequency[Hz]](https://thumb-ap.123doks.com/thumbv2/123dokinfo/5387067.412982/10.892.145.403.232.750/fig-comparison-receptance-fem-test-frequency-hz.webp)