• 검색 결과가 없습니다.

CRDS Study of Tropospheric Ozone Production Kinetics : Isoprene Oxidation by Hydroxyl Radical

N/A
N/A
Protected

Academic year: 2021

Share "CRDS Study of Tropospheric Ozone Production Kinetics : Isoprene Oxidation by Hydroxyl Radical"

Copied!
6
0
0

로드 중.... (전체 텍스트 보기)

전체 글

(1)

CRDS Study of Tropospheric Ozone Production Kinetics : Isoprene Oxidation by Hydroxyl Radical

Ji-Ho Park

Department of Environmental Health, Korean National Open University, Seoul 110-791, Korea

(Received November 4, 2009/Revised November 20, 2009/Accepted December 5, 2009)

ABSTRACT

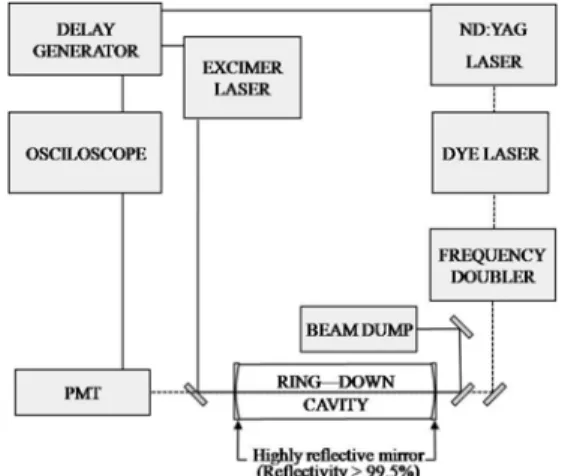
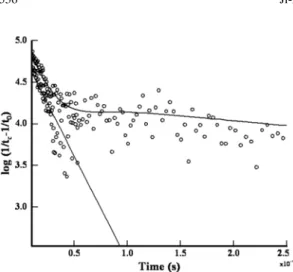
The tropospheric ozone production mechanism for the gas phase additive oxidation reaction of hydroxyl radical (OH) with isoprene (2-methyl-1,3-butadiene) has been studied using cavity ring-down spectroscopy (CRDS) at total pressure of 50 Torr and 298 K. The applicability of CRDS was confirmed by monitoring the shorter (~4%) ring- down time in the presence of hydroxyl radical than the ring-down time without the photolysis of hydrogen peroxide.

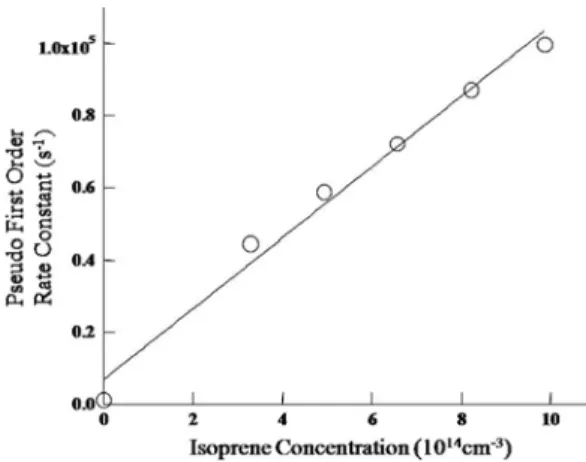
The reaction rate constant, (9.8±0.1)×10

−11

molecule

−1

cm

3

s

−1

, for the addition of OH to isoprene is in good agreement with previous studies. In the presence of O

2

and NO, hydroxyl radical cycling has been monitored and the simulation using the recommended elementary reaction rate constants as the basis to OH cycling curve gives reasonable fit to the data.

Keywords: cavity ring-down spectroscopy, ozone, isoprene, oxidation, rate constant

I. Introduction

Among the issues in regional air quality, the tropospheric ozone production through the photo- chemical oxidation of unsaturated hydrocarbons has been drawing attention of many atmospheric scientists. Isoprene (2-methyl-1,3-butadiene, C 5 H 8 ) is the most abundant non-methane biogenic organic compound emitted by vegetation into the atmosphere (~450 Tg/yr) and its oxidation serves as a major source of tropospheric ozone. 1,2) During the day time, isoprene reacts predominantly with the hydroxyl radical (OH) which has tropospheric lifetime of a few seconds or less and the concentration of OH in the sunlit troposphere is near 10 6 molecules·cm −3 . 3)

In the metropolitan city, the atmosphere is polluted by automobile exhaust gases including nitrogen oxides (NO x ) 4) and isoprene is oxidized by OH in the presence of moderate concentration of NO as well as O 2 . The OH regeneration during

isoprene oxidation in the presence of NO and O 2 is abbreviately shown in Fig. 1. The first intermediate radical product, hydroxy alkyl radical (HOC 5 H 8 ), reacts with O 2 to produce the hydroxy peroxy radical (HOC 5 H 8 O 2 ). The reaction between hydroxy peroxy radicals and NO yields alkoxy radical (HOC 5 H 8 O) and nitrogen dioxide. The decomposition of alkoxy radicals, followed by the HO 2 + NO reaction regenerates OH radical. It is worth noting that each cycle of the isoprene oxidation produces two molecules of ozone from the reaction between O 2 and O followed by photolysis of nitrogen dioxide.

Corresponding author : Department of Environmental Health, Korean National Open University

Tel: 82-2-3668-4742, Fax: 82-2-741-4701 E-mail: [email protected]

Fig. 1. Schematic diagram showing the OH initiated iso-

prene oxidation cycle which results in ozone pro-

duction.

(2)

Furthermore, the following oxidation processes of isoprene oxidation products such as methyl vinyl ketone, methacrolein, acrolein, and 3-methylfurane produce more ozone in the troposphere. It is also crucial to determine the yield distribution of those first oxidation products since the impacts on the elevation of the tropospheric ozone concentration by each of them are different. In this regard, careful tracing of isoprene oxidation process through theoretical or experimental kinetic studies is important for understanding detail isoprene oxidation mechanism which reveals the end product distribution. From the kinetic study, the rates of elementary reactions are determined and the informa- tion on the dominant reaction path can be provided by comparing the reaction rates when there are several possible reactions competing.

Initial reaction of isoprene and OH can result in four possible adducts and the initial branching ratios among these hydroxy alkyl radicals strongly influence the final product distribution. There have been several theoretical and end product analysis studies 5-10) suggesting a preference for OH addition to the terminal carbons although a recent mass spectrometry study 11) indicates comparable yields of all four radicals. Despite the discrepancy in the initial branching ratios, there is general consensus regarding the rate constant of (1.0 ± 0.1) × 10 −10 molecule −1 cm 3 s −1 at 298 K. 11-15)

In the presence of O 2 , the hydroxy alkyl radicals react with O 2 forming peroxy radicals (RO 2 ). The reported overall reaction rate constants 16,17) are in the range from 1 × 10 −13 to 8 × 10 −11 molecule -1 cm 3 s −1 and there is little of direct measurement studies on the formation rate of RO 2 due to the difficulty in monitoring RO 2 . A direct measurement study by Zhang et al . 18) using fast flow reactor coupled to chemical ionization mass spectrometry detection determined the rate constant of (7 ± 3) × 10 −13 molecule −1 cm 3 s −1 and it is more than an order of magnitude larger than the previous report of (2.8 ± 0.7) × 10 −15 molecule −1 cm 3 s −1 which was obtained by detecting the loss of hydroxy alkyl radicals by the same group. 19) Although the authors claim the interference by the RO 2 decomposition resulted in the previous low value, the differences still remain between their recent value and the other suggested rate constants range from 2 × 10 −12 to 8 × 10 −11 molecule −1

cm 3 s −1 obtained by indirect OH cycling experiments.

In this regard, UV absorption spectroscopy shall be considered as a efficient method to determine RO 2 formation rate using OH cycling experiments.

There have been difficulties in monitoring the fluorescence of OH due to the high fluorescence quenching efficiency of O 2 when laser photolysis/

laser-induced fluorescence (LP/LIF) spectroscopy is used with high concentration of O 2 . High concentration of O 2 provides more dramatic OH signal rise (cycling) at earlier time of the isoprene + OH + O 2 reaction and this gives more detail information of O 2 addition to hydroxy alkyl radical.

On the contrary, the absorption method is free from the quenching problem and the temporal profile of OH can be efficiently detected. Recently, various studies 20-23) using cavity ring-down spec- troscopic (CRDS) detection method which basically uses absorption property of the object species have been adopted due to its simplicity: absorption is derived from the increased decay rate of laser radiation within a stable optical cavity induced by absorbing species. Especially, CRDS is an excellent detection method for measuring kinetics of radical species and the sensitivity of CRDS is very high.

Lin et al . 24,25) have used CRDS for kinetics measurement for phenyl radical and Atkinson and Hudgens 26-28) have adopted CRDS for ethyl radicals, propargyl radicals and chloroally radicals.

In this study, a CRDS apparatus has been tested for measuring the rate constant of OH + isoprene addition reaction and it has been found the rate constant is in good agreement with previously reported values. OH cycling experiment also has been performed in the presence of O 2 and NO at the total pressure of 50 Torr and 295 K and early OH cycling has been monitored with O 2 partial pressure of 6 Torr.

II. Experimental Section

The experimental determination of the rate

constants was performed using a slow flow cavity

with a length of 60 cm and two highly reflective

mirrors (reflectivity > 99.5%) which have a 0.56 m

radius of curvature were installed at the both ends

of the reaction cavity. The cavity was evacuated

by a mechanical pump and argon was used as a

(3)

buffer gas. Throughout the experiment, the total pressure and temperature were maintained at 50 Torr and 295 K, respectively. 90~95% hydrogen peroxide (H 2 O 2 ) was prepared by vacuum distillation by checking the density of the solution and H 2 O 2

was transferred into the cavity by flowing argon through a bubbler containing concentrated H 2 O 2 . Isoprene buffered with argon gas was prepared in a 5L bulb via freeze-pump-thaw method and introduced into the cavity using a mass flow controller to yield typical concentrations of 1 × 10 14 molecules cm −3 . The NO was buffered with argon in a 5L bulb to known concentrations and was introduced into the cavity through a flow controller.

The concentrations of NO were varied from 0 to 1.6 × 10 15 molecules cm −3 and O 2 concentration was fixed at 6 Torr (1.96 × 10 17 molecules cm −3 ).

Fig. 2 is a schematic diagram of cavity ring- down apparatus. The frequency doubled probe beam was generated by the Nd:YAG pumped dye laser with a pulse duration of 6~8 ns and OH from H 2 O 2 photolysis was produced by the 248 nm beam from the excimer laser. The delay between the pump (excimer laser) and probe (dye laser) beam was adjusted by a delay generator. The probe beam leaking out of the exit mirror has been pointed to a photomultiplier tube which transferred analog signal proportional to the photon density to a digital oscilloscope. A computer was interfaced to the oscilloscope to analyze the ring down time.

The temporal photon decay can be described by the equation

(1) where I is the number of photons detected by the photomultiplier tube, I 0 is the number of photons injected into the cavity, L' is the length of the absorbing medium which is the same as the length of cavity ( L ) in this study, c is the speed of light, and R and α are mirror reflectivity and the absorption coefficient, respectively. When the averaged waveform is transformed to a log[intensity]

vs. time profile, it was fit to a line using a least squares algorithm. The resulting slope of the line is the inverse of the time constant for the single exponential decay of light intensity from the cavity and it can be written as

(2) where intrinsic ring-down time (without absorbing species) is given as

(3) Fig. 3 shows the temporal the ring-down profiles obtained in the absence (probe beam only) and the presence (pump and probe beam) of OH and the intrinsic ring-down time ( t 0 ) of 546 ns which corresponds mirror reflectivity of 99.6% with a cavity length of 60 cm was measured whereas the shorter (~4%) ring-down time of 527 ns was

I t ( ) I 0 e

1 R – + L′α --- L

⎝ ⎠

⎛ ⎞ct

⋅ –

=

1 t

--- L′αc + ( 1 R )c

--- L

=

1 t 0

--- ( 1 R )c

--- L

=

Fig. 2. Schematic diagram of the experiment.

Fig. 3. The temporal probe beam intensity leaking out of

the cavity with (upper) and without (lower) H

2

O

2

photolysis.

(4)

monitored due to the absorption by OH.

III. Results and Discussion The absorption coefficient ( α ) is the product of the extinction coefficient ( σ ) and the concentration of the hydroxyl radical, [OH] t , at a time, t , after the firing of the pump or photo-dissociation beam from the excimer laser and an initial concentration of hydroxyl radical, [OH] 0 , decays exponentially in the pseudo-first-order reaction condition.

(4) where k' is the pseudo-first order reaction rate constant.

From the above equations, a relation can be expressed as

(5) or

(6) Fig. 4 shows the plot of Eq. (6) as a function of the delay time between pump and probe beam in the presence of excess isoprene compared with OH which satisfies the pseudo-first order reaction condition. As the isoprene concentration increases, the slope gets steeper and the trend is similar to

the previous results obtained by the laser photolysis / laser-induced fluorescence (LP/LIF) method. 9)

The absolute value of bimolecular reaction rate constant, k , was obtained from the slopes of the linear plots of k' versus isoprene concentration and it is depicted in Fig. 5. The pressure dependence of the isoprene + OH reaction rate has been reported by a number of groups 9,13,14,17) and it is generally accepted that the reaction is in high pressure limit regime even at 10 Torr. Hence, it is assumed that the reaction condition with the pressure of 50Torr is in high pressure limit regime.

The determined rate constant of (9.8 ± 0.1) × 10 −11 molecule −1 cm 3 s −1 is in good agreement with the previous recommendation of 1.0 × 10 −10 molecule −1 cm 3 s −1 by Atkinson et al . 29)

As shown in Fig. 1, OH regeneration process happens in the presence of NO and O 2 , and Fig. 6 shows a OH cycling data using concentration of isoprene and O 2 of 5.6 × 10 14 molecules cm −3 and 2.0 × 10 17 molecules cm −3 , respectively. A numerical program, KINTECUS, was used to simulate the data from the experiments and the previously reported 14 reactions 17) and corresponding reaction rate constants given in Table 1 were used in the simulation. The fits of the simulation to the data are shown as solid lines in Fig. 6. The upper curve was obtained with NO concentration of 2.0 × 10 15 molecules cm -3 and exhibits the typical exponential decay at early times until the onset of recovery signal at around 50 µ s. 17,30) Although there is

α σ OH = ⋅ [ ] t = σ OH ⋅ [ ] 0 ⋅ e k′t

1 t c --- 1

t 0 ---

– σ OH [ ] 0 cL′

--- e L ⋅ k′t

=

ln 1 t

c

--- 1

t 0 ---

⎝ – ⎠

⎛ ⎞ = ln ⎝ ⎛ σ OH --- [ L ] 0 cL′ ⎠ ⎞ k′t –

Fig. 4. Log plot of ring-down rate difference for a series of isoprene concentrations.

Fig. 5. Plot of pseudo-first-order reaction rate constants versus isoprene concentration for the isoprene+

OH reaction at 50 Torr and 295 K.

(5)

apparent signal regeneration due to the cycling of OH, relatively large signal to noise needs to be improved to obtain a set of data showing the concentration effect of O 2 and NO on the recovery time. In the absence of NO (lower line), the observed decay shows pseudo-first order kinetics with a rate of 1.0 × 10 −10 molecule −1 cm 3 s −1 , consistent with the recommendation value. 29)

IV. Conclusion

This work focuses on the verification of CRDS

measurements for reaction kinetics of isoprene oxidation which results in the elevation of ozone concentration in the troposphere. The measured initial rate constant for the isoprene+OH reaction is in excellent agreement with previously reported value and OH cycling was successfully monitored.

Although a direct monitoring of hydroxy peroxy radicals was not available in this study due to the lack of adequate highly reflective mirrors ranging 210~260 nm where the UV absorptions of typical peroxy radicals appear, 31) CRDS could be utilized to study the reaction kinetics by monitoring the ring-down time of radical species whose absorption is in the visible range in the future.

Acknowledgement

This work was supported by Korea National University Research Fund (2008). The author thank Prof. Simon North for helpful advises.

References

1. Chameides, W. L., Fehsenfeld, F., Rodgers, M. O., Cardelino, C., Martinez, J., Parrish, D., Lonneman, W., Lawson, D. R., Rasmussen, R. A., Zimmerman, P., Greenberg, J., Middleton, P., Wang, T. : Ozone precursor relationships in the ambient atmosphere.

Journal of Geophyscal Research , 97 , 6037-6055, 1992.

2. Rasmussen, R. A., Khalil, M. A. : Isoprene over the amazon basin. Journal of Geophyscal Research , 93 , 1417-1421, 1988.

3. Atmospheric Chemistry and Global Change: Bras- seur, G. P., Orlando, J. J., Tyndall, G. S., New York Oxford, Oxford University Press, 1999.

4. Fenger, J. : Urban air quality. Atmospheric Envi- ronment , 33 , 4877-4900, 1999.

5. Jenkin, M. E., Hayman, G. D. : Kinetics of reac- tions of primary, secondary and tertiary beta- hydroxy peroxyl radicals-Application to isoprene degradation. Journal of the Chemical Society-Fara- day Transactions , 91 , 1911-1922, 1995.

6. Atkinson, R., Aschmann, S. M., Tuazon, E. C., Arey, J., Zielinska, B. : Formation of 3-methylfuran from the gas phase reaction of OH radicals with isoprene and the rate constant for its reaction with OH radical. International Journal of Chemical Kinetics , 21 , 593-604, 1989.

7. Paulson, S. E., Seinfeld, J. H. : Development and evaluation of photooxidation mechanism for iso- prene. Journal of Geophyscal Research , 97 , 20703- 20715, 1992.

Fig. 6. Log plot of ring-down rate difference in the pres- ence (upper line) and in the absence (lower line) of NO.

Table 1. Reaction mechanism and corresponding rate constants (molecules −1 cm

3

s −1 unless the unit is noted)

Reaction Rate constant

1. OH + C

5

H

8

HOC

5

H

8

2. HOC

5

H

8

+ O

2

→ HOC

5

H

8

O

2

3. HOC

5

H

8

+ NO HOC

5

H

8

NO 4. HOC

5

H

8

O

2

+ NO → HOC

5

H

8

ONO

2

5. HOC

5

H

8

O

2

+ NO → HOC

5

H

8

O + NO

2

6. HOC

5

H

8

O → HOC

5

H

7

OH

7. HOC

5

H

8

O products +CH

2

OH 8. HOC

5

H

8

O → products +CH

2

OH 9. HOC

5

H

8

O + NO HOC

5

H

8

ONO 10. HOC

5

H

7

OH + O

2

→ HO

2

+ products 11. HOC

5

H

7

OH + NO → HOC

5

H

7

OHNO 12. CH

2

OH + O

2

→ HO

2

+ HCHO 13. CH

2

OH + NO CH

2

OHNO 14. HO

2

+ NO → OH + NO

2

1.0 × 10

−10

2.3 × 10

−12

1.5 × 10

−11

4.5 × 10

−13

8.6 × 10

−12

prompt (32%) prompt (63%) 5.0 × 10

5

s

−1

(5%)

3.0 × 10

−11

1.0 × 10

−11

3.0 × 10

−11

9.1 × 10

−12

1.2 × 10

−11

8.9 × 10

−12

(6)

8. Francisco-Marquez, M., Alvarez-Idaboy, J. R., Gal- ano, A., Vivier-Bunge, A. : Theoretical study of the initial reaction between OH and isoprene in tro- pospheric conditions. Physical Chemistry Chemical Physics , 5 , 1392-1399, 2003.

9. McGivern, W. S., Suh, I. S., Clinkenbeard, A. D., Zhang, R., North, S. W. : Experimental and com- putational study of the OH-isoprene reaction: Iso- meric branching and low-pressure behavior.

Journal of Physical Chemistry A , 104 , 6609-6016, 2000.

10. Zhang, R. Y., Suh, I., Lei, W., Clinkenbeard, A. D., North, S. W. : Kinetic studies of OH-initiated reac- tions of isoprene. Journal of Geophyscal Research- Atmospheres , 105 , 24627-24635, 2000.

11. Stevens, P. S., Seymour, E., Li, Z. J. : Theoretical and experimental studies of the reaction of OH with isoprene. Journal of Physical Chemistry A , 104 , 5989-5997, 2000.

12. Lei, W. F., Zhang, R. Y. : Theoretical study of hydroxyisoprene alkoxy radicals and their decom- position pathways. Journal of Physical Chemistry A , 106 , 3808-3815, 2001.

13. Kleindienst, T. E., Harris, G. W., Pitts, J. N. : Rates and temperature dependences of the reaction of OH with isoprene, its oxidation-products, and selected terpenes. Environmental Science & Technology , 16 , 844-846, 1982.

14. Chuong, B., Stevens, P. S. : Kinetic study of the OH plus isoprene and OH plus ethylene reactions between 2 and 6 torr and over the temperature range 300-423 K. Journal of Physical Chemistry A ,

104 , 5230-5237, 2000.

15. Iida, Y., Obi, K., Imamura, T. : Rate constant for the reaction of OH radicals with isoprene at 298 ± 2K.

Chemistry Letters , 8 , 792-793, 2002.

16. Lei, W. F., Zhang, R., McGivern, W. S., Derecskei- Kovacs, A., North, S. : Theoretical study of OH-O

2

- isoprene peroxy radicals. Journal of Physical Chemistry A , 105 , 471-477, 2001.

17. Park, J., Jongsma, G., Zhang, R., North, S. : OH/

OD Initiated oxidation of isoprene in the presence of O

2

and NO. Journal of Physical Chemistry A ,

108 , 10688-10697, 2004.

18. Zhang, D., Zhang, R., Church, C., North, S. : The- oretical study of OH-O

2

-isoprene peroxy radicals.

Chemical Physcs Letter A , 343 , 49-54, 2001.

19. Zhang, D., Suh, I., Clinkenbeard, A., Lei, W., North, S. : Kinetic studies of OH-initiated reactions of isoprene. Journal of Geophyscal Research-Amo- spheres , 105 , 24627-24635, 2000.

20. O'Keefe, A., Deacon, D. A. : Cavity ring-down optical spectrometer for absorption measurements using pused laser sources. Review of Scientific

Instruments , 59 , 2544-2551, 1988.

21. Pushkarsky, M. B., Zalyubovsky, S. J., Miller, T.

A. : Detection and characterization of alkyl peroxy radicals using cavity ringdown spectroscopy. Jour- nal of Chemical Physics , 112 , 10695-10698, 2000.

22. Rupper, P., Sharp, E. N., Tarczay, G., Miller, T. A.

: Investigation of ethyl peroxy radical conformers via cavity ringdown spectroscopy of the elec- tronic transition. Journal of Physical Chemistry A ,

111 , 832-840, 2007.

23. Liu, Y. D., Morales-Cueto, R., Hargrove, J., Medina, D., Zhang, J. S. : Measurements of peroxy radicals using chemical amplification-cavity ringdown spec- troscopy. Environmental Science & Technology , 43 , 7791-7796, 2009.

24. Choi, Y. M., Xia, W. S., Park, J., Lin, M. C. : Kinet- ics and mechanism for the reaction of phenyl rad- ical with formaldehyde. Journal of Physical Chemistry A , 104 , 7030-7035, 2000.

25. Park, J., Tokmakov, I. V., Lin, M. C. : Experimental and computational studies of the phenyl radical reaction with Allene. Journal of Physical Chem- istry A , 111 , 6881-6889, 2007.

26. Atkinson, D. B., Hudgens, J. W. : Chemical kinetic studies using ultraviolet cavity ring-down spectro- scopic detection: Self-reaction of ethyl and eth- ylperoxy radicals and the reaction O

2

+C

2

H

5

-

>C

2

H

5

O

2

. Journal of Physical Chemistry A , 101 , 3901-3909, 1997.

27. Atkinson, D. B., Hudgens, J. W., Orr-Ewing, A. J. : Kinetic studies of the reactions of IO radicals deter- mined by cavity ring-down spectroscopy. Journal of Physical Chemistry A , 103 , 6173-6180, 1999.

28. Atkinson, D. B., Hudgens, J. W. : Chlorination chemistry. 2. Rate coefficients, reaction mecha- nism, and spectrum of the chlorine adduct of allene.

Journal of Physical Chemistry A , 104 , 811-818, 2000.

29. Summary of Evaluated Kinetic and Phtochemical Data for Atmospheric Chemistry. IUPAC Subcom- mittee on Gas Kinetic Data Evaluation for Atmo- spheric Chemistry : Atkinson, R., Baulch, D. L., Cox, R. A., Crowley, J. N., Hampson, R. F. Jr., Kerr, J. A., Rossi, M. J., Troe, J., London, Black- well, 2002.

30. Chen, X. H., Hulbert, D., Shepson, P. B. : Mea- surement of the organic nitrate yield from OH reac- tion with isoprene. Journal of Geophyscal Research-Atmospheres , 109 , 25563-25568, 1998.

31. Wallington, T. J., Dagaut, P., Kurylo, M. J. : Ultra- violet absorption cross sections and reaction kinet- ics and mechanisms for peroxy radicals in the gas phase. Chemical Review , 92 , 667-710, 1992.

A ˜ – B ˜

수치

Fig. 1. Schematic diagram showing the OH initiated iso- iso-prene oxidation cycle which results in ozone  pro-duction.
Fig. 2.  Schematic diagram of the experiment.
Fig. 4.  Log plot of ring-down rate difference for a series of isoprene concentrations
Fig. 6.  Log plot of ring-down rate difference in the pres- pres-ence (upper line) and in the abspres-ence (lower line) of NO.

참조

관련 문서