250
Systolic Long Axis Function of the Left Ventricle, as Assessed by 2-D Strain, is Reduced in the Patients Who Have Diastolic Dysfunction and a Normal Ejection Fraction
Jin-Oh Choi, MD, Soo Jin Cho, MD, Ji Hyun Yang, MD, Jung Hyuk Kim, MD, Bong Keun Song, MD,
Young Whan Park, MD, Seung Min Choi, MD, Sang Yeob Lee, MD, Sang-Chol Lee, MD and Seung Woo Park, MD Division of Cardiology, Cardiac and Vascular Center, Department of Medicine, Samsung Medical Center,
Sungkyunkwan University School of Medicine, Seoul, Korea ABSTRACT
Background and Objectives: Echocardiographic evaluation of the long axis left ventricle (LV) function has been re- ported to be useful for understanding heart failure in those patients with a preserved ejection fraction (EF). The global and segmental peak LV systolic longitudinal strain (PSLS), as determined by the 2D speckle tracking method, may be related with the conventional diastolic parameters. We sought to determine whether the PSLS could reveal LV systolic dysfunction in those patients who have a normal EF and diastolic dysfunction. Subjects and Methods: A total of 168 patients who underwent a routine echocardiographic examination were evaluated. Echocardiographic evaluations were performed and the patients were grouped according to the grade of their diastolic dysfunction. The global and segmental PSLS were analyzed off-line. Results: Measurements of the LV PSLS were successfully obtained in 83% of the patients. The mid and basal PSLS values were significantly lower in the patients with grade I and II diastolic dysfunction (-17.5±2.0% and -17.5±2.3%, respectively) versus the normal healthy controls (-20.6±1.9%, p<0.001). The mid and basal PSLS values were found to be well related to the early diastolic mitral annular velocity (r=0.510, p<0.001) and the left atrial volume index (r=-0.422, p<0.001). Conclusion: The systolic LV long-axis function, as determined by 2D strain and especially in the mid and basal LV segments, is reduced in the patients with diastolic dysfunction in spite of their normal LV EF. (Korean Circ J 2008;38:250-256)
KEY WORDS: Diastole; Systole; Echocardiography; Heart ventricles; Cardiac funtion tests.
Introduction
Echocardiographic evaluation of the left ventricle (LV) long axis function has been reported to be useful for understanding heart failure (HF) with a preserved ejec- tion fraction (EF).1-3) LV peak systolic longitudinal strain (PSLS), as determined using the 2-D speckle tracking method, is a novel indicator of the LV long axis func- tion.4-6) Recently, measurement of the PSLS could be assisted by a newly-developed semi-automated algorithm for automated function imaging (AFI).7) This method can
provide quantitative measurements of the global and seg- mental PSLS and it utilizes a simple bull’s eye display.
Diastolic dysfunction (DD), which is regarded as a primary feature of diastolic HF, has been previously evaluated using Doppler studies of mitral inflow and pulmonary venous flow, the left atrial volume indexes (LAVI) and tissue Doppler imaging (TDI) of the mitral annulus.8) Of these parameters, the early diastolic mitral annular (E’) velocity and LAVI are commonly regarded as noninvasive indexes of LV relaxation.9)10)
We hypothesized that the patients with a normal EF and DD would have subclinical systolic dysfunction and this could be revealed by measuring the PSLS with using the AFI technique. In the present study, we sought to determine whether the 2-D speckle tracking method could detect subtle change of the LV systolic long axis function via evaluation of the global and segmental PSLS of the LV, and correlation analysis of the PSLS with the conventional parameters that were used to evaluate the diastolic function, such as E’ and LAVI.
Received: January 2, 2008
Revision Received: February 26, 2008 Accepted: March 8, 2008
Correspondence: Seung Woo Park, MD,Division of Cardiology, Cardiac and Vascular Center, Department of Medicine, Samsung Medical Center, Sungkyunkwan University School of Medicine, 50 Irwon-dong, Gangnam- gu, Seoul 135-710, Korea
Tel: 82-2-3410-3419, Fax: 82-2-3410-3849 E-mail: [email protected]
Subjects and Methods
Study subjects
Comprehensive echocardiographic evaluations were performed in 218 patients. The inclusion criteria used were as follows: 1) stable vital signs, 2) a LV EF >50%, 3) a normal sinus rhythm without left bundle branch block, 4) no regional wall motion abnormality, 5) valvu- lar heart disease (>mild grade) and 6) written informed consent was obtained to participate in the study. After excluding 50 patients who had documented ischemic heart disease with resting wall motion abnormality (n=2), valvular heart disease (n=24), or echocardiogra- phic images unsuitable for analysis (n=24), 168 patients were finally enrolled. This study was approved by the ethical committee of the institutional review board at our hospital.
Echocardiographic examination
Conventional echocardiographic examinations were performed using a Vivid 7® system [General Electrics (GE) Vingmed; Horten Norway] with a 3.5 MHz trans- ducer. Examinations included measurements of the car- diac dimensions, including the interventricular septal thickness (IVST), the LV end-diastolic dimension (EDD), the LV end-systolic dimension (ESD) and the LV poste- rior wall thickness (PWT) as measured by M-mode echo- cardiography at the chordae tendineae level. The LV EF was estimated by taking the square of the LV EDD and ESD, as previously described.11) The LAVI values were calculated using the ellipsoidal method.12) The LV mass was calculated by the following formula and it was in- dexed by the body surface area; LV mass=0.8×(1.04×
[LV EDD+IVST+LV PWT]3-[LV EDD]3)+0.6 [gm].11) The relative wall thickness was computed at diastole as fol- lows; (2×LV PWT)/LV EDD.11)
The DD grades were assessed with comprehensive eva- luations, i.e., pulsed-wave Doppler examinations of the mitral and pulmonary venous inflow, TDI of the mitral annular velocities (obtained at the septal annulus), and LAVI.12-16) Briefly, the ratio of the mitral inflow early di- astolic velocity (E) to the late diastolic velocity (A) was used for the initial DD grading. If the E/A was <0.75, then the patient was categorized into the abnormal re- laxation group (grade I DD). If the E/A ratio was in the range of 0.75 to 1.5 and the deceleration time was >140 ms, then the other parameters were used to determine if the diastolic function was normal or pseudonormal (grade II DD).
If there were two or more Doppler indexes suggestive of elevated filling pressures (a change in the E/A with Val- salva of >0.5, a pulmonary venous atrial reversal flow velocity greater than >0.35 m/sec or an E to E’ ratio of >
10), then the patient was allocated to the grade II DD group. The 168 study subjects were allocated to the grade
I DD (n=35), grade II DD (n=45) or normal diastolic function groups (n=59).
Measurement of peak systolic longitudinal strain The gray scale 2-D harmonic images were obtained in the apical long-axis, 4-chamber and 2-chamber views to determine the PSLS values. All the images were obtained at a frame rate of 60-90 frames/s without dual focus.
Three consecutive cardiac cycles were saved in the digital format for off-line analysis and the optimal tracking image was selected for analysis. Strain analysis was per- formed by one investigator, who was unaware of the patients’ DD grades, with using EchoPAC® (BT 06.6.
1.0, GE Vingmed) with the AFI technique (Fig. 1). The global PSLS was defined as an average value of the 16 segmental PSLSs of a LV. Additionally, the basal, mid or apical segmental PSLS was defined as an average value of the PSLS of each of the corresponding 6 segments (4 segments for the apex).
Statistical analysis
Statistical analysis was performed using an SAS sta- tistical package (version 9.1, SAS Institute, Cary, NC).
The data is presented as means±SDs or as frequencies.
One-way analysis of variance with the least significant difference method was used to compare the descriptive parameters after confirming the normal distributions.
The 2-tailed Pearson’s method was adopted to evaluate the correlations between the PSLS and the other echocar- diographic parameters. To investigate the intra- and in- terpersonal measurement variability, measurements were performed off-line by two investigators on 30 randomly selected cases. The intraclass correlation coefficient of the global PSLS for the intraobserver measurements was 0.90 [n=30, p<0.001, 95% confidence interval (CI) 0.81- 0.95], and for interobserver measurements it was 0.91 (n=30, p<0.001, 95% CI 0.81-0.95).
Results
The clinical characteristics and echocardiographic parameters
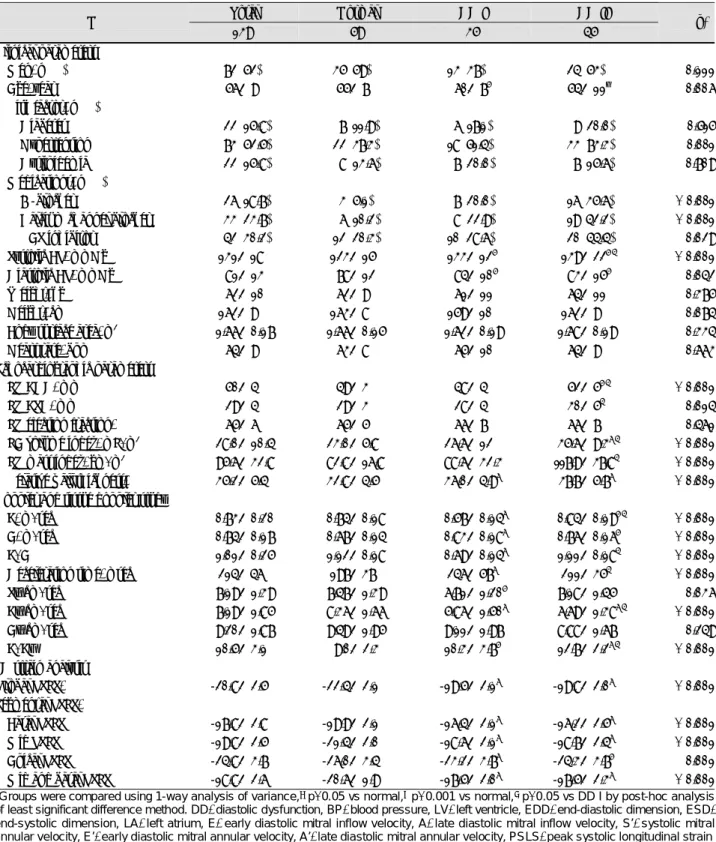
Of the 168 patients enrolled in this study, the PSLS was measured successfully with good tracking quality in 139 (83%) patients. Their clinical and echocardiographic characteristics according to the DD grade are shown in Table 1. The patients of DD grade I were older than those patients with a normal diastolic function or those pati- ents with grade II DD. Patients with hypertension were more frequently enrolled in the grade II DD group and the systolic blood pressures were higher in this group compared to the other group. The LV EDD and ESD were slightly higher in the grade II DD patients than those values in the grade I DD patients or the normal controls, but there was no significant difference between
the LV EF values of these 3 groups. However, the LAVI, the LV mass indexes and the relative wall thickness val- ues were significantly larger in the grade II DD patients as compared to the normal control group. The global and segmental PSLS values in each study group are presented in Table 1. The global and segmental PSLS values were lower in the patients with grade I or II DD than those values in the normal control group. Segmental analysis shows that reductions in the PSLS were more evident in the mid and basal segments (-20.6±1.9% in the nor-
mal controls vs. -17.5±2.0% in the DD I patients and -17.5±2.3% in the DD II patients, p<0.001).
Correlations between the segmental PSLS and the echocardiographic parameters
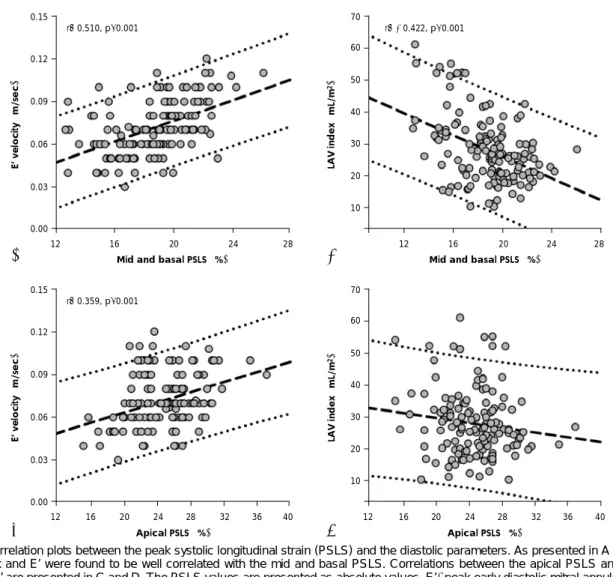
E’ was better correlated with the mid and basal PSLS (r=0.510, p<0.001) than with the apical PSLS (r=0.359, p<0.001, Fig. 2). The LAVI also showed a moderate cor- relation with the mid and basal PSLS (r=-0.422, p<
0.001). However, no relationship was found between the
A B
C D
E F
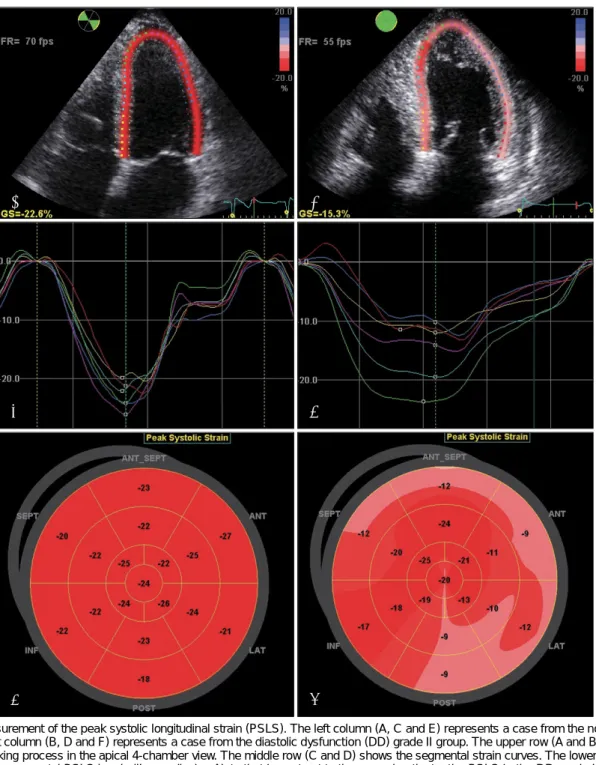
Fig. 1. Measurement of the peak systolic longitudinal strain (PSLS). The left column (A, C and E) represents a case from the normal group and the right column (B, D and F) represents a case from the diastolic dysfunction (DD) grade II group. The upper row (A and B) shows the speckle tracking process in the apical 4-chamber view. The middle row (C and D) shows the segmental strain curves. The lower row (E and F) shows the segmental PSLS in a bull’s eye display. Note that in contrast to the normal patients, the PSLS in the DD grade II patients is reduced, and especially in the mid and basal segments. FR: frame rate, SEPT: septum, ANT_SEPT: anterior septum, INF: inferior wall, ANT: anterior wau, LAT: lateral wall, POST: posterior wall.
LAVI and the apical PSLS (r=-0.137, p=0.109). The LV mass index and the relative wall thickness showed mode- rate correlation with the mid and basal PSLS (r=0.461, p<0.001 and r=0.507, p<0.001, respectively). However, there was no significant correlation between the relative wall thickness and the apical PSLS (r=0.103, p=0.229), and there was only weak correlation between the LV
mass index and the apical PSLS (r=0.191, p=0.024).
Discussion
In this study, we used a newly-developed AFI techni- que to measure longitudinal 2-D strain. The study de- monstrates that the longitudinal systolic functions of
Table 1. Clinical and echocardiographic data according to the grade of DD
Total Normal DD I DD II
N 139 59 35 45 p*
Clinical parameters
Men, n (%) 72 (52) 35 (59) 13 (37) 24 (53) 0.111
Age, year 56±9 55±7 60±7† 54±11§ 0.006
Risk factor, n (%)
Diabetes 22 (15.8) 07 (11.9) 06 (17.1) 09 (20.0) 0.515
Hypertension 73 (52.5) 22 (37.3) 18 (51.4) 33 (73.3) 0.001
Dyslipidemia 22 (15.8) 08 (13.6) 07 (20.0) 07 (15.6) 0.709
Medications, n (%)
β-blocker 26 (18.7) 03 (5.1) 07 (20.0) 16 (35.6) < 0.001 Calcium channel blocker 33 (23.7) 06 (10.2) 08 (22.9) 19 (42.2) < 0.001 RAS inhibitor 42 (30.2) 12 (20.3) 10 (28.6) 20 (44.4) 0.029
Systolic BP, mmHg 131±18 123±15 133±12† 139±22†§ < 0.001
Diastolic BP, mmHg 81±13 78±12 84±10† 83±15† 0.042
Weight, kg 62±10 62±9 61±11 64±11 0.375
Height, cm 162±9 163±8 159±10 162±9 0.074
Body surface area, m2 1.66±0.17 1.66±0.15 1.62±0.19 1.68±0.19 0.334
Heart rate, bpm 64±9 63±8 65±10 64±9 0.663
Echocardiographic parameters
LV EDD, mm 50±4 49±3 48±4 52±5†§ < 0.001
LV ESD, mm 29±4 29±3 28±4 30±5§ 0.014
LV ejection fraction, % 65±6 65±5 66±7 66±7 0.461
LA volume index, mL/m2 28.0±10.4 23.0±5.8 26.6±12 35.6±9.3‡§ < 0.001 LV mass index, gm/m2 95.6±32.8 82.8±16.8 88.6±32.3 117.9±37.8§ < 0.001 Relative wall thickness, % 35.2±5.4 32.8±4.5 36.0±4.9‡ 37.7±5.7‡ < 0.001 Doppler and tissue doppler study
E, m/sec 0.73±0.20 0.74±0.18 0.57±0.14‡ 0.84±0.19†§ < 0.001 A, m/sec 0.74±0.17 0.67±0.14 0.83±0.18‡ 0.76±0.16† < 0.001
E/A 1.01±0.25 1.12±0.18 0.69±0.14‡ 1.11±0.18§ < 0.001
Deceleration time, msec 214±46 197±37 246±57‡ 211±35§ < 0.001
S’, cm/sec 7.19±1.39 7.47±1.39 6.71±1.20† 7.18±1.45 0.036
E’, cm/sec 7.19±1.85 8.36±1.66 5.86±1.50‡ 6.69±1.38‡§ < 0.001
A’, cm/sec 9.20±1.87 9.49±1.95 9.11±1.97 8.88±1.67 0.249
E/E’ 10.5±3.1 9.0±2.3 10.3±3.7† 12.7±2.2‡§ < 0.001
2D strain analysis
Global PSLS, % -20.8±2.5 -22.4±2.1 -19.5±2.1‡ -19.8±2.0‡ < 0.001 Segmental PSLS, %
Basal PSLS -17.8±2.8 -19.9±2.1 -16.4±2.1‡ -16.2±2.5‡ < 0.001 Mid PSLS -19.8±2.5 -21.4±2.0 -18.6±2.1‡ -18.7±2.4‡ < 0.001 Apical PSLS -24.8±3.7 -26.0±3.4 -23.2±3.7‡ -24.3±3.7† 0.001 Mid and basal PSLS -18.8±2.6 -20.6±1.9 -17.5±2.0‡ -17.5±2.3‡ < 0.001
*Groups were compared using 1-way analysis of variance, †p<0.05 vs normal, ‡p<0.001 vs normal, §p<0.05 vs DD I by post-hoc analysis of least significant difference method. DD: diastolic dysfunction, BP: blood pressure, LV: left ventricle, EDD: end-diastolic dimension, ESD:
end-systolic dimension, LA: left atrium, E: early diastolic mitral inflow velocity, A: late diastolic mitral inflow velocity, S’: systolic mitral annular velocity, E’: early diastolic mitral annular velocity, A’: late diastolic mitral annular velocity, PSLS: peak systolic longitudinal strain
the patients with DD, but who had a normal LV EF are lower, in terms of the PSLS, than those of the patients with a normal diastolic function. Furthermore, the glo- bal and segmental PSLS are well correlated with the E’
velocity and the LAVI, which are commonly used to de- termine the severity of DD.
HF was previously classified as systolic or diastolic HF with using systolic parameters like the EF and fractional shortening.17) However, there is some debate concerning the diagnosis of diastolic HF and DD. For example, iso- lated DD can be erroneously diagnosed in a case that displays subtle systolic dysfunction when this is assessed using an imprecise echocardiographic technique, such as the LV EF or fractional shortening by performing M- mode echocardiography. Therefore, a continuum of sys- tolic function was suggested as truly normal function, mildly impaired function that is labeled as diastolic HF, and obviously abnormal LV systolic function.1)18) In these studies, the LV long axis function was measured using LV systolic atrioventricular plane displacement as deter- mined by M-mode echocardiography or the TDI of the mitral annulus.18) The result of our study concerning a
decrease in the global PSLS in those patients with DD in the grade I and II groups versus the normal group agree well with those results of the previous studies.
The 2D strain measurements, as determined by speck- le tracking, have recently been used for the quantitative evaluation of LV function, and this method has been validated for the evaluation of longitudinal function.5)19) In the current study, we used a semi-automated techni- que, which has been reported to provide useful rapid measures of the global and segmental PSLS in a routine clinical setting.7) Moreover, the segmental analysis fin- dings can be presented on bull’s eye displays by using the AFI technique.
In the present study, the mid and basal segmental PSLS were found to be well correlated with the E’, the LV mass index, the relative wall thickness and the LAVI, which are all closely related to the LV diastolic function.
These segmental relationships with diastolic function may be due to the fact that the inner myocardium, which is known to be importantly involved in the long axis func- tion, has an oblique fiber orientation.20) This helical ori- entation might result in the parallel alignment of the
0.15
0.12
0.09
0.06
0.03
0.00
E’ velocity (m/sec)
12 16 20 24 28 Mid and basal PSLS (%)
r=0.510, p<0.001 70
60 50 40 30 20 10 LAV index (mL/m2)
12 16 20 24 28 Mid and basal PSLS (%)
r=-0.422, p<0.001
0.15
0.12
0.09
0.06
0.03
0.00
E’ velocity (m/sec)
12 16 20 24 28 32 36 40 Apical PSLS (%)
r=0.359, p<0.001 70
60 50 40 30 20 10 LAV index (mL/m2)
12 16 20 24 28 32 36 40 Apical PSLS (%)
A B
C D
Fig. 2. Correlation plots between the peak systolic longitudinal strain (PSLS) and the diastolic parameters. As presented in A and B, the LAV index and E’ were found to be well correlated with the mid and basal PSLS. Correlations between the apical PSLS and the LAV index or E’ are presented in C and D. The PSLS values are presented as absolute values. E’: peak early diastolic mitral annular velocity, LAV: left atrial volume.
longitudinal axis and the inner myocardium only at the mid LV or the base of the LV. On the contrary, the cir- cular fiber orientation of the apical myocardium might result in an intimate relationship between the average clockwise twisting and untwisting rates, which also sug- gests a close link between systolic contraction and diastolic relaxation.21) DD is a well-known predictor of the clinical outcome in many clinical situations, which include HF with a preserved or reduced EF.22)23) The LV long-axis function, as measured using the systolic amplitude, was recently found to be an independent predictor for sur- vival in HF patients after adjusting for age, gender, heart rate, blood pressure and the EF.24) Considering the good correlations between the diastolic parameters and the quantitative nature of the PSLS, further clinical evalua- tion of the PSLS with the long-term follow-up is warran- ted, and especially for the HF patients with a normal EF.
This study has some limitations that should be consi- dered. We could not evaluate the LV diastolic function using invasive parameters such as tau because we consi- dered that cardiac catheterization could not be justified based on the evaluation of diastolic function alone.
Secondly, we did not evaluate the strain rate because this could not be obtained using AFI software. However, as strain is a fundamental parameter that can be directly measured using the speckle tracking method, it might be a more relevant parameter than the strain rate, which is in contrast to TDI study. Last, there were no significant differences between the PSLS values in the grade I and II DD patients. Since our grading system for DD did not include an invasive gold standard method, this lack of significant differences might have resulted from the possible errors in the grading process. Therefore, further investigation is required in a future study to determine if PSLS might be useful in grading DD because it could be a sensitive marker for subclinical systolic dysfunction in the patients with DD.
Conclusion
The present study shows that PSLS provides additional information about the diastolic function and subtle systolic dysfunction, and especially concerning the mid and basal LV segments. Therefore, PSLS might be help- ful to measure the systolic dysfunction that could be pre- sent in the patients who have DD and a normal LV EF.
Acknowledgments
This study was supported by the Korean Institute of Medicine.
REFERENCES
1) Yip G, Wang M, Zhang Y, Fung JW, Ho PY, Sanderson JE. Left ventricular long axis function in diastolic heart failure is reduced in both diastole and systole: time for a redefinition? Heart 2002;
87:121-5.
2) Vinereanu D, Nicolaides E, Tweddel AC, Fraser AG. “Pure” dia- stolic dysfunction is associated with long-axis systolic dysfunction:
implications for the diagnosis and classification of heart failure.
Eur J Heart Fail 2005;7:820-8.
3) Ha JW, Oh JK. The pathophysiology and diagnostic approaches for diastolic left ventricular dysfunction: a clinical perspective.
Korean Circ J 2005;35:865-76.
4) Park KH, Song JK, Suh IW, et al. The usefulness of 2-dimensional longitudinal strain for prediction of the postoperative left ven- tricular systolic function in patients with valvular heart disease causing volume overloading. Korean Circ J 2006;36:272-8.
5) Reisner SA, Lysyansky P, Agmon Y, Mutlak D, Lessick J, Fried- man Z. Global longitudinal strain: a novel index of left ventricular systolic function. J Am Soc Echocardiogr 2004;17:630-3.
6) Jung HO, Youn HJ, Shin WS, et al. Differentiation of systolic and diastolic heart failure using strain and strain rate echocardiog- raphy. Korean Circ J 2004;34:1090-8.
7) Lowe BS, Tran H, Agler DA, Popovic ZB, Thomas JD, Grimm RA. Quantifying regional myocardial strain by online speckle tracking echocardiography: clinical feasibility and comparison with wall motion scoring. J Am Soc Echocardiogr 2007;20:584.
Abstract.
8) Chinnaiyan KM, Alexander D, Maddens M, McCullough PA.
Curriculum in cardiology: integrated diagnosis and management of diastolic heart failure. Am Heart J 2007;153:189-200.
9) Solomon SD, Janardhanan R, Verma A, et al. Effect of angiotensin receptor blockade and antihypertensive drugs on diastolic function in patients with hypertension and diastolic dysfunction: a rando- mised trial. Lancet 2007;369:2079-87.
10) Lim TK, Ashrafian H, Dwivedi G, Collinson PO, Senior R. Increa- sed left atrial volume index is an independent predictor of raised serum natriuretic peptide in patients with suspected heart failure but normal left ventricular ejection fraction: implication for diag- nosis of diastolic heart failure. Eur J Heart Fail 2006;8:38-45.
11) Lang RM, Bierig M, Devereux RB, et al. Recommendations for chamber quantification: a report from the American Society of Echocardiography’s Guidelines and Standards Committee and the Chamber Quantification Writing Group, developed in conjunction with the European Association of Echocardiography, a branch of the European Society of Cardiology. J Am Soc Echocardiogr 2005;
18:1440-63.
12) Pritchett AM, Jacobsen SJ, Mahoney DW, Rodeheffer RJ, Bailey KR, Redfield MM. Left atrial volume as an index of left atrial size:
a population-based study. J Am Coll Cardiol 2003;41:1036-43.
13) Khouri SJ, Maly GT, Suh DD, Walsh TE. A practical approach to the echocardiographic evaluation of diastolic function. J Am Soc Echocardiogr 2004;17:290-7.
14) Nishimura RA, Tajik AJ. Evaluation of diastolic filling of left ventricle in health and disease: Doppler echocardiography is the clinician’s Rosetta Stone. J Am Coll Cardiol 1997;30:8-18.
15) Pritchett AM, Mahoney DW, Jacobsen SJ, Rodeheffer RJ, Karon BL, Redfield MM. Diastolic dysfunction and left atrial volume:
a population-based study. J Am Coll Cardiol 2005;45:87-92.
16) Garcia MJ, Thomas JD, Klein AL. New Doppler echocardiogra- phic applications for the study of diastolic function. J Am Coll Cardiol 1998;32:865-75.
17) Vasan RS, Benjamin EJ, Levy D. Prevalence, clinical features and prognosis of diastolic heart failure: an epidemiologic perspective.
J Am Coll Cardiol 1995;26:1565-74.
18) Petrie MC, Caruana L, Berry C, McMurray JJ. “Diastolic heart fa- ilure” or heart failure caused by subtle left ventricular systolic dys- function? Heart 2002;87:29-31.
19) Becker M, Bilke E, Kuhl H, et al. Analysis of myocardial deforma- tion based on pixel tracking in two dimensional echocardiographic images enables quantitative assessment of regional left ventricular function. Heart 2006;92:1102-8.
20) Buckberg GD, Mahajan A, Jung B, Markl M, Hennig J, Ballester- Rodes M. MRI myocardial motion and fiber tracking: a confirma- tion of knowledge from different imaging modalities. Eur J Cardio- thorac Surg 2006;29(Suppl 1):S165-77.
21) Kim HK, Sohn DW, Lee SE, et al. Assessment of left ventricular rotation and torsion with two-dimensional speckle tracking echo- cardiography. J Am Soc Echocardiogr 2007;20:45-53.
22) Brucks S, Little WC, Chao T, et al. Contribution of left ventricular diastolic dysfunction to heart failure regardless of ejection fraction.
Am J Cardiol 2005;95:603-6.
23) Dokainish H, Zoghbi WA, Lakkis NM, et al. Incremental predic- tive power of B-type natriuretic peptide and tissue Doppler echo- cardiography in the prognosis of patients with congestive heart failure. J Am Coll Cardiol 2005;45:1223-6.
24) Svealv BG, Olofsson EL, Andersson B. Ventricular long axis func- tion is of major importance for long-term survival in heart failure patients. Heart 2008;94:284-9.