Assessment of Tissue Viability Using
Diffusion- and Perfusion-Weighted MRI in Hyperacute Stroke
Objective: The aim of this study was to investigate the relationship between the diffusion and perfusion parameters in hyperacute infarction, and we wanted to determine the viability threshold for the ischemic penumbra using diffusion- and perfusion-weighted imaging (DWI and PWI, respectively).
Materials and Methods: Both DWI and PWI were performed within six hours from the onset of symptoms for 12 patients who had suffered from acute stroke.
Three regions of interest (ROIs) were identified: ROI 1 was the initial lesion on DWI; ROI 2 was the DWI/PWI mismatch area (the penumbra) that progressed onward to the infarct; and ROI 3 was the mismatch area that recovered to normal on the follow-up scans. The ratios of apparent diffusion coefficient (ADC), the rel- ative cerebral blood volume (rCBV), and the time to peak (TTP) were calculated as the lesions’ ROIs divided by the contralateral mirror ROIs, and these values were then correlated with each other. The viability threshold was determined by using the receiver operating characteristic (ROC) curves.
Results: For all three ROIs, the ADC ratios had significant linear correlation with the TTP ratios (p < 0.001), but not with the rCBV ratios (p = 0.280). There was no significant difference for the ADC and rCBV ratios within the ROIs. The mean TTP ratio/TTP delay between the penumbras’ two ROIs showed a signifi- cant statistical difference (p < 0.001). The cutoff value between ROI 2 and ROI 3, as the viability threshold, was a TTP ratio of 1.29 (with a sensitivity and specificity of 86% and 73%, respectively) and a TTP delay of 7.8 sec (with a sensitivity and specificity of 84% and 72%, respectively).
Conclusion: Determining the viability thresholds for the TTP ratio/delay on the PWI may be helpful for selecting those patients who would benefit from the vari- ous therapeutic interventions that can be used during the acute phase of ischemic stroke.
n recent years, perfusion-weighted imaging (PWI) and diffusion-weighted imaging (DWI) have become routine examinations for acute stroke patients in many stroke centers. In general, the DWI abnormality represents the severely damaged tissue while the PWI abnormality represents the hemodynamically impaired tissue (1 4). Within the first few hours of stroke, the abnormal perfusion area is usually larger than the DWI lesion (3 6). These diffusion- perfusion mismatch patterns predict the subsequent expansion of an infarct and the so- called “tissue at risk”, which is the main target for delivering thrombolytic therapy during the acute phase of ischemic stroke. However, because PWI is very sensitive for detecting decreased perfusion, the DWI/PWI mismatch region may encompass not only the tissue at risk of infarction, but it may also include oligemic normal tissue (7).
Therefore, it is necessary to quantify the severity of the perfusion deficit within the Won-Jin Moon, MD1, 2
Dong Gyu Na, MD1, 3 Jae Wook Ryoo, MD1, 4 Hong Gee Roh, MD1 Hong Sik Byun, MD1 Yong Hwan Jeon, MD1 Eun Chul Chung, MD2
Index terms : Brain, diffusion Brain, infarction Brain, MR Brain, perfusion
Magnetic resonance (MR), diffusion study
Magnetic resonance (MR), perfusion study
Korean J Radiol 2005 ; 6 : 75-81 Received October 19, 2004; accepted after revision February 9, 2005.
1Department of Radiology and Center for Imaging Science, Samsung Medical Center, Sungkyunkwan University School of Medicine; 2Department of Radiology, Kangbuk Samsung Hospital, Sungkyunkwan University School of Medicine; 3Department of Radiology, Seoul National University Hospital;
4Department of Radiology, Gyeongsang National University College of Medicine
Address reprint requests to : Won-Jin Moon, MD, Department of Radiology, Kangbuk Samsung Hospital, Sungkyunkwan University School of Medicine, 108 Pyung-dong, Chongno-gu, Seoul 110-746, Korea.
Tel. (822) 2001-1034 Fax. (822) 2001-1030
e-mail: wonjin.moon@samsung.com
I
DWI/PWI mismatch area in order to discriminate the tissue at risk from the oligemic normal tissue (6).
Neumann-Haefelin et al. (6) have suggested the delay of the time to peak (TTP) as a useful parameter for differenti- ating tissue at risk from the oligemic normal tissue. Rohl et al. (8) have recently reported that a cutoff value derived from the relative cerebral blood flow (rCBF) and the mean transit time (MTT) can be used to predict the outcome of a DWI/PWI mismatch. Grandin et al. (9, 10) have reported that the threshold from the cerebral blood flow (CBF) and the cerebral blood volume (CBV) may help predict the expansion of an infarct.
The instant identification of the tissue at risk, which is treatable by thrombolytic therapy, is critical in imaging studies of hyperacute stroke patients. Unlike the CBF and MTT, the TTP and rCBV can be easily obtained from the PWI data without the time consuming post-processing and the operator intervention that is necessary for determining the arterial input function (6, 11, 12). From this point of view, only two perfusion parameters i.e. the rCBV and TTP, and the diffusion parameter apparent diffusion coeffi- cient (ADC) were evaluated in this prospective study.
The aim of this study was to correlate the DWI with the PWI parameters in hyperacute infarction, and we also wanted to determine the viability threshold for ischemic penumbras by using the DWI and PWI.
SUBJECTS AND METHODS
Patients
Twelve patients (four women and eight men, median age: 60, age range: 54 to 78 years) that had acute hemispheric stroke presenting within six hours from the onset of symptoms were prospectively recruited as study subjects at our stroke center from 1999 to 2001. The inclusion criteria were as follows: 1) the onset of symptoms was identified by the patient or by another person less than six hours before the MR study 2) the patients had a National Institutes of Health Stroke Scale score more than 4, 3) the patients hadn’t received thrombolytic therapy, 4) an identical MR protocol that included at least the T2WI, the fluid-attenuated inversion recovery (FLAIR) image, the DWI and the PWI sequences at the hyperacute phase, 5) the patients all had a positive PWI/DWI mismatch to exclude any partial or complete reperfusion prior to the initial MR study.
The selected patients presented with stroke in the middle cerebral artery territories (seven on the right side and five on the left side). The mean MR scan time was 1.2 hours after the onset of symptoms. All the patients underwent a follow-up MRI or CT within six days (mean = 2.1 days)
after the initial MR imaging while one patient underwent a follow-up CT 17 days after the initial imaging. MR angiog- raphy was also performed in all the patients simultane- ously. This study was approved by the review board of our institution, and the study was performed with obtaining an informed consent from each patient or a close relative.
MRI Protocol
MRI was performed using a 1.5 T imaging unit (Signa, GE Medical Systems, Milwaukee, WI) that had echo-planar capability. In each patient, the study included the DWI, PWI and conventional MR imaging. The conventional MR protocol consisted of 1) axial T1-weighted spin-echo images (467/9 [repetition time msec/echo time msec]), 2) the axial T2-weighted fast spin-echo image (3417/102 [effective echo time]), 3) the axial FLAIR image
(10000/400/2200 [inversion time]). The imaging parame- ters of the conventional MR imaging were a 256 192 matrix, a 23-cm field of view, and a 5 mm/1 mm slice thickness/intersection gap. In all patients, three-
dimensional time-of flight MR angiography was performed through the region of the circle of Willis prior to the perfusion MR imaging.
Diffusion-Weighted Imaging
The diffusion-weighted images were obtained with multisection single shot spin-echo echo planar imaging sequences. Each of the 20 sections was acquired with a b value of 0 and 1000 sec/mm2. The diffusion gradients were applied to the three orthogonal directions in space. An isotropic diffusion-weighted image was generated online by averaging the three orthogonal-axis images. The acquisition parameters of the DWI were as follows;
6500/96.8 (repetition time msec/echo time msec), a 128 128 matrix, a 28-cm field of view and a 5 mm/1 mm slice thickness/intersection gap. After the MR data were transferred to a workstation, the apparent diffusion coeffi- cient (ADC) maps were calculated from the DWI data.
Perfusion-Weighted Imaging
The perfusion-weighted images were obtained with dynamic gradient-echo echo planar imaging sequences following the administration of a bolus of gadopentetate dimeglumine (0.2 mmol/kg of body weight). The injection was performed at a rate of 4 ml/sec with a magnetic resonance-compatible power injector, and this was
followed by a 15-ml bolus of physiologic saline at the same injection rate. Fifty single-shot echo planar images were obtained in each of the 10 sections including the 15 sets of baseline images. The acquisition parameters used are as follows; TR/TE, 2500/50 msec; flip angle 90 , field of view,
28 28 cm; 128 128 matrix; and 5 mm/2 mm section thickness/gap.
For postprocessing, all the perfusion MR data were transferred to a workstation. The perfusion maps of the relative cerebral blood volume (rCBV), and the time-to- peak (TTP) were generated off-line at a workstation. For each voxel, the time-intensity curve for the dynamic images was converted to a time-concentration curve ( R2). After eliminating the contrast agent recirculation by gamma-variate curve fitting, the rCBV was computed by a numeric integration of the curve. A TTP map was
generated by calculating the arrival time of the contrast material to the maximum concentration after injecting the contrast agent.
Data Analysis
For the quantitative analysis, the lesion volumes were measured on the initial DWI, PWI and follow-up MRI or CT scans by the consensus of two experienced neuroradiol- ogists. After the imaging data were transferred to a workstation, the regions of interest (ROI) were delineated by the manual contouring of the DWI and TTP images. The DWI lesion volumes were determined by manually tracing the edge of the hyperintense signal on each slice of the trace DWI scans obtained at b = 1000 s/mm2. The TTP lesion volumes were determined by manually tracing the area of the prolonged TTP as a hemodynamically disturbed area.
We defined the penumbra as the difference between the tissue volume with a reduced blood flow, as shown on the
A B C
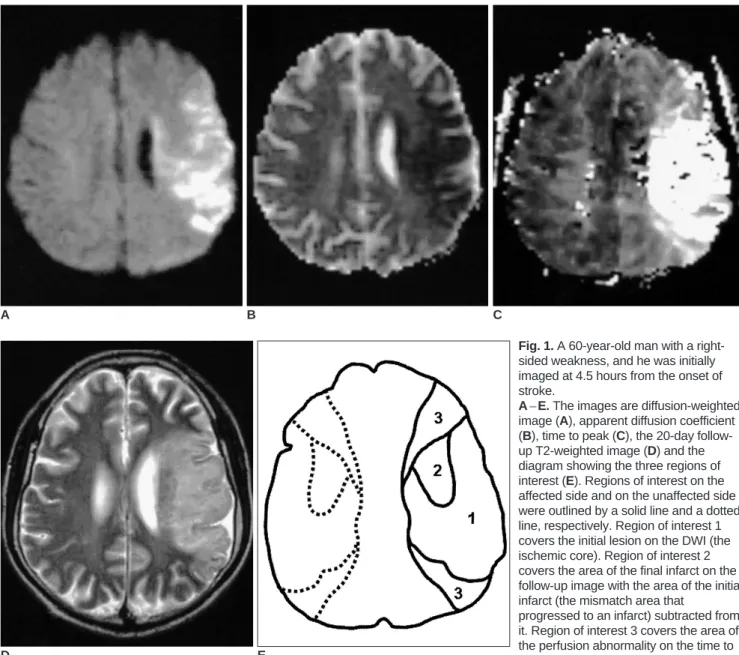
Fig. 1. A 60-year-old man with a right- sided weakness, and he was initially imaged at 4.5 hours from the onset of stroke.
A E. The images are diffusion-weighted image (A), apparent diffusion coefficient (B), time to peak (C), the 20-day follow- up T2-weighted image (D) and the diagram showing the three regions of interest (E). Regions of interest on the affected side and on the unaffected side were outlined by a solid line and a dotted line, respectively. Region of interest 1 covers the initial lesion on the DWI (the ischemic core). Region of interest 2 covers the area of the final infarct on the follow-up image with the area of the initial infarct (the mismatch area that
progressed to an infarct) subtracted from it. Region of interest 3 covers the area of the perfusion abnormality on the time to peak with the area of the final infarct (the mismatch area that recovered to normal on the follow-up) subtracted from it.
D E
map of TTP, and the ischemic lesion volume on the initial DWI image (i.e. the DWI/PWI mismatch). Three ROIs were placed manually on the TTP maps, as shown in Figure 1.
ROI 1 covered the ischemic core, as was detected from the DWI. ROI 2 covered the diffusion/perfusion mismatch volume that (by visual inspection) progressed to an infarc- tion, as was defined by the follow-up FLAIR or CT images.
ROI 3 covered the mismatch volume that appeared as normal on the follow-up images. The ROIs were applied to all the affected TTP slices. All 3 ROIs were mirrored to the contralateral unaffected hemisphere. Finally, all the ROIs were copied to the rCBV and the ADC maps. The ratios between the physiological estimates (rCBV, TTP and ADC) of the lesion and the contralateral mirror ROIs were then determined. The value of the TTP delay, which was defined as the difference between the TTP value of the lesion and that of the contralateral mirror ROI, was also obtained.
Statistical Evaluation
All the results are presented as means SD. Pearson’s linear correlation was used to examine the relationship of the different types of parameters in the DWI and PWI.
One-way ANOVA with Bonferroni posthoc test was used to compare the mean ADC ratios within the ROIs of the 12 patients. Kruskal-Wilcoxon tests were used to compare the mean CBV ratios, the TTP ratios and the TTP delays within the ROIs of the 12 patients. Comparisons between
the ROIs were performed by the student t-test, with the Bonferroni correction for multiple tests being performed on the same sample. The receiver operating characteristic (ROC) curves were used to define the optimal cutoff value, which was chosen as the value with the highest possible sensitivity and specificity.
RESULTS
Relationships between the ADC Ratios and the TTP and CBV Ratios
Analysis of the Pearson correlation coefficients
demonstrated a statistically significant correlation between
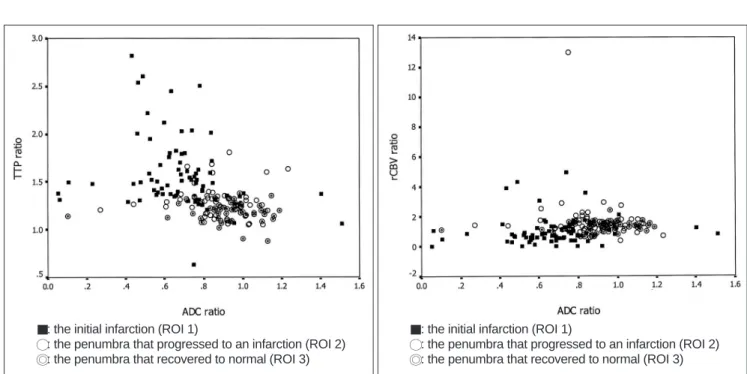
Fig. 2. A. The scatterplot showing the relationship between the apparent diffusion coefficient ratios and the time to peak ratios. The apparent diffusion coefficient ratios showed a weak negative correlation with the time to peak ratios (r2 = 0.092, F = 17.84, p < 0.001).
B. The scatterplot showing the relationship between the apparent diffusion coefficient ratios and the cerebral blood volume ratios ratios.
The apparent diffusion coefficient ratios showed no significant correlation with the relative cerebral blood volume ratios (r2 = 0.007, F = 1.17, p = 0.280).
A B
: the initial infarction (ROI 1)
: the penumbra that progressed to an infarction (ROI 2) : the penumbra that recovered to normal (ROI 3)
: the initial infarction (ROI 1)
: the penumbra that progressed to an infarction (ROI 2) : the penumbra that recovered to normal (ROI 3)
Table 1. Diffusion and Perfusion Parameters Measured in the 3 Different ROIs on the Initial DWI/PWI
Ischemic Progressed to Recovered to Core (ROI 1) Infarction (ROI 2) Normal (ROI 3) TTP delay (sec) 16.1 8.60 8.8 6.0 5.2 2.5
TTP ratio 1.58 0.38 1.29 0.17 1.19 0.10
rCBV ratio 1.01 0.94 1.64 0.66 1.35 0.32
ADC ratio 0.67 0.23 0.87 0.17 0.93 0.18
Note. Values are means SD. For the TTP delay and the TTP ratio, all pairwise comparisons of the subgroups are significantly different; and for the CBV ratio and the ADC ratios, all pairwise comparisons of the subgroups are significantly differrent, except between ROI 2 and ROI 3.
ROI = region of interest, TTP = time to peak, rCBV = relative cerebral blood volume, ADC = apparent diffusion coefficient
the ADC ratio and the TTP ratio of the initial diffusion and perfusion-weighted images. The scatterplot (Fig. 2A) shows that the ADC ratios displayed significant negative correla- tion with the TTP ratios (r2= 0.092, F = 17.84, p < 0.001).
There was no statistically significant correlation between the ADC ratios and the CBV ratios (r2= 0.007, F = 1.17, p
= 0.28) (Fig. 2B).
Quantification of Perfusion Parameters
The mean ratios for the 3 ROIs determined from the different perfusion and ADC maps are shown in Table 1.
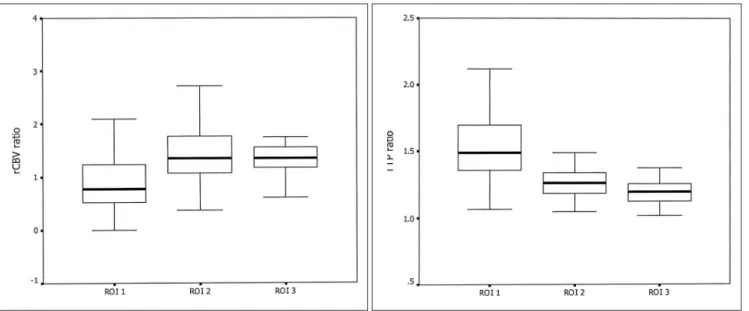
All the lesion/contralateral ratios of the ROIs for the rCBV, TTP and ADC maps are shown in Figure 3. The mean rCBV ratio of 1.01 0.94 was found for the ischemic core. The rCBV ratio of 1.64 0.66 was found for the penumbra that progressed to an infarction, and the rCBV
ratio of 1.35 0.32 was found for the penumbra that recovered to normal. There was no significant statistical difference between the two penumbral regions (p = 0.107).
Because of the wide overlap of the calculated rCBV ratios within the subgroups, the cutoff value for the ischemic penumbra could not be obtained.
The mean ratio of the TTP for the 3 ROIs showed a significant difference, with the lower value being observed for the less ischemic area and the higher value being observed for the more ischemic area (p < 0.001). The mean TTP ratio was 1.58 0.38 for the core (ROI 1), 1.29 0.17 for the penumbra that progressed to an infarct (ROI 2), and 1.19 0.10 for the penumbra that recovered to normal (ROI 3). The mean TTP ratio was significantly different between ROI 2 and ROI 3 (p < 0.001). The cutoff value between the two parts of the penumbra was a TTP
A B
Fig. 3. Box plots of the mean values of the lesion-contralateral normal regions’ ratios for all the patients.
A. The relative cerebral blood volume ratios, B. The time to peak ratios, and C. The apparent diffusion coefficient ratios. The line through the center of each box represents the mean value. The ends of the boxes represent the 1st and 3rd quartiles. The end points of each graph represent the smallest and largest values.
Region of interest 1 covers the initial lesion on the diffusion- weighted image (ischemic core). Region of interest 2 covers the area of the final infarct on the follow-up image with the area of the initial infarct (the mismatch area that progressed to infarct) subtracted from it. Region of interest 3 covers the area of the perfusion abnormality on the time to peak with the area of the final infarct (the mismatch area that recovered to normal on follow-up) subtracted from it.
C
ratio of 1.29, with a sensitivity of 86% and a specificity of 73.4%. For the TTP delay, the cutoff value between the two parts of the penumbra was 7.8 sec with a sensitivity of 83.9% and sensitivity of 72%.
Quantification of the Diffusion Parameters This result showed a lower ADC ratio for the more severe ischemia. The mean ADC ratio for the core was 0.67
0.23, and the mean ADC ratios for the parts of the penumbra that progressed to an infarction and the parts of the penumbra that recovered were 0.87 0.17 and 0.93 0.18, respectively. The mean ADC ratios for all three regions were significantly different (p = 0.01). However, the p-values for the penumbra that progressed to an infarction versus the penumbra that recovered were equal to 0.11.
DISCUSSION
In this study, the ADC ratios had a linear correlation with the TTP ratios, but not with the CBV ratios. This result suggests that the TTP can represent the degree of tissue ischemia as well as tissue perfusion if an accurate cutoff value for the TTP of the ischemic penumbra is known (13 16). Although ischemic stroke is characterized by a decrease in the CBF and CBV, initial compensatory vasodilatation causes a temporary increase in the CBV (8, 17, 18). Therefore, there is a certain point when the CBV is increased despite the decreased perfusion pressure. This bimodal pattern of the CBV ratio might explain its poor correlation with the ADC ratio, which is a marker of ischemic injury.
It is interesting that in our study, a higher CBV ratio was observed for the penumbra that progressed to an infarction than for the penumbra that recovered to normal.
According to a combined PWI/SPECT study (15), the increased rCBV had a protective effect on the progression of an infarct, but the rCBV reduction < 0.70 predicted irreversible damage. Contrary to the results of our study, Rohl et al. (8) have reported that the mean CBV ratios for the core, for the penumbra progressing to infarction and for the penumbra that recovered were 0.55, 0.84, and 0.94, respectively, and these values were also consistent with other studies (9, 19). However, Schlaug et al. (4) have reported an increased CBV ratio for the penumbra that later progressed to infarction, and this is in good agreement with our study. Schaefer et al. (20) have demonstrated that both the penumbra that progressed to an infarction and the penumbra that recovered to normal displayed individual mean rCBV ratios > 1.0. The increased CBV ratio in the penumbra that later progressed to an infarction may be caused by an early compensatory response to a reduced
cerebral perfusion pressure (4, 8, 17, 18). As rCBV = rCBF MTT, an elevated rCBV ratio with a markedly higher MTT or TTP may represent vulnerable tissue that may progress onward to an infarction.
This study found a longer TTP delay/higher TTP ratio in those cases having more severe ischemia. These findings are in accordance with other human studies in which the MTT or TTP was inversely correlated with the perfusion pressure (8, 13 16, 21). In our study, the cutoff value between the two parts of the penumbra was a TTP ratio of 1.29 with a sensitivity of 86% and specificity of 73%. For the TTP delay, the cutoff value between the two parts of the penumbra was 7.8 sec with a sensitivity of 84% and a sensitivity of 72%. This result was similar to the findings that a TTP delay of > 6s in the mismatch between the initial and follow-up MRIs was associated with the growth of an infarct (6). Rohl et al. (8) suggested that those patients potentially benefiting from treatment are the patients for whom the MTT ratio exceeds 1.63.
In this study, the mean ADC ratios were not significantly different between the penumbra that progressed and the penumbra that recovered (0.87 0.17 and 0.93 0.18, respectively). Rohl et al. (8) have also found no significant statistical difference in the ADC ratios between the penumbras that recovered and the penumbras that progressed. However, our results are in contrast with those results of other recent studies (20, 22, 23), in which the ADC ratios were significantly reduced in the regions of the penumbra that progressed to an infarction compared to those regions of the penumbra that remained normal.
Although it was statistically insignificant, the slightly lower mean ADC ratios might represent an incomplete ischemia or a heterogeneity of ischemia at presentation (20) and an intravoxel inhomogeneity.
There were several limitations of this study. First, only 12 cases of hyperacute stroke were studied, and this is a small number of subjects for generalizing these results.
Second, a large ROI instead of voxel-by-voxel analysis was used to determine the thresholds. As Rohl et al. (8) have noted, this is a severe problem when making therapeutic decisions that would be based on the voxel value rather than on the large ROIs. However, in the near future, better technical progress such as coregistration will solve this problem. Third, the initial diffusion abnormality was regarded as a permanent ischemic core. In most cases, the initial diffusion abnormality represents irreversible nonviable tissue. However, a reversible diffusion
abnormality has been occasionally reported in animal and human studies (24 26). Even this assumption could be wrong, which is foreseeable because there is no alternative to using a diffusion abnormality to define an irreversible
ischemic core. Finally, ischemic lesions are subject to dynamic processes and not static processes. Stroke progres- sion is related not only to the residual blood flow, but also to the duration of the decreased blood flow (26).
Therefore, a single measurement and evaluation of the DWI and PWI may not provide adequate information on the ischemic penumbra.
In conclusion, while the ADC and rCBV did not correlate with each other, the ADC and TTP showed a significant correlation. The TTP ratio and the delay showed a statistically significant difference between ROI 2 and ROI 3. Therefore, the viability thresholds for the TTP
ratio/delay on the PWI may be helpful for selecting those patients who are suitable for therapeutic interventions during the acute phase of ischemic stroke.
References
1. Barber PA, Darby DG, Desmond PM, Yang Q, Gerraty RP, Jolley D, et al. Prediction of stroke outcome with echoplanar perfusion- and diffusion-weighted MRI. Neurology 1998;51:
418-426
2. Lovblad KO, Laubach HJ, Baird AE, Curtin F, Schlaug G, Edelman RR, et al. Clinical experience with diffusion-weighted MR in patients with acute stroke. AJNR Am J Neuroradiol 1998;19:1061-1066
3. Warach S, Dashe JF, Edelman RR. Clinical outcome in ischemic stroke predicted by early diffusion-weighted and pergusion magnetic resonance imaging: a preliminary analysis. J Cereb Blood Flow Metab 1996;16:53-59
4. Schlaug G, Benfield A, Baird AE, Siewert B, Lovbald KO, Parker PA, et al. The ischemic penumbra operationally defined by diffusion and perfusion MRI. Neurology 1999;53:1528-1537 5. Sorensen AG, Copen WA, Ostergaard L, Buonanno FS,
Gonzales RG, Rordorf G, et al. Hyperacute stroke: simultaneous measurement of relative cerebral blood volume, relative cerebral blood flow, and mean tissue transit time. Radiology 1999;210:519-527
6. Neumann-Haefelin T, Wittsack HJ, Wenerski F, Siebler M, Seitz RJ, Modder U, et al. Diffusion- and perfusion-weighted MRI.
The DWI/PWI mismatch region in acute stroke. Stroke 1999;30:
1591-1597
7. Baird AE, Warach S. Magnetic resonance imaging of acute stroke. J Cereb Blood Flow Metab 1998;18:583-609 8. Rohl L, Ostergaard L, Simonsen CZ, Vestergaard-Poulsen P,
Andersen G, Sakoh M, et al. Viability thresholds of ischemic penumbra of hyperacute stroke defined by perfusion-weighted MRI and apparent diffusion coefficient. Stroke 2001;32:1140- 1146
9. Grandin CB, Duprez TP, Smith AM, Mataigne F, Peeters A, Oppenheim C, et al. Usefulness of magnetic resonance-derived quantitative measurements of cerebral blood flow and volume in prediction of infarct growth in hyperacute stroke. Stroke 2001;32:1147-1153
10. Grandin CB, Duprez TP, Smith AM, Oppenheim C, Peeters A, Robert AR, et al. Which MR-derived perfusion parameters are the best predictors of infarct growth in hyperacute stroke?
Comparative study between relative and quantitative measure-
ments. Radiology 2002;223:361-370
11. Neumann-Haefelin T, Wittsack HJ, Fink GR, Wenserski F, Li TQ, Seitz RJ, et al. Diffusion- and perfusion-weighted MRI:
influence of severe carotid artery stenosis on the DWI/PWI mismatch in acute stroke. Stroke 2000;31:1311-1317 12. Yamada K, Wu O, Gonzalez RG, Bakker D, Ostergaard L,
Copen WA, et al. Magnetic resonance perfusion-weighted imaging of acute cerebral infarction: effect of the calculation methods and underlying vasculopathy. Stroke 2002;33:87-94 13. Ferrari M, Wilson DA, Hanley DF, Traystman RJ. Effects of
graded hypotension on cerebral blood flow, blood volume, and mean transit time in dogs. Am J Physiol 1992;262:H1908-1914 14. Zaharchuk G, Mandeville JB, Bogdanov AA Jr, Weissleder R,
Rosen BR, Marota JJ. Cerebrovascular dynamics of autoregula- tion and hypoperfusion. An MRI study of CBF and changes in total and microvascular cerebral blood volume during hemorrhagic hypotension. Stroke 1999;30:2197-2204 15. Gibbs JM, Leenders KL, Wise RJ, Jones T. Evaluation of
cerebral perfusion reserve in patients with carotid-artery occlusion. Lancet 1984;1:182-186
16. Schumann P, Touzani O, Young AR, Morello R, Baron JC, Mackenzie ET. Evaluation of the ratio of cerebral blood flow to cerebral blood volume as an index of local cerebral perfusion pressure. Brain 1998;121:1369-1379
17. Powers WJ. Cerebral hemodynamics in ischemic cerebrovascu- lar disease. Ann Neurol 1991;29:231-240
18. Sette G, Baron JC, Mazoyer B, Levasseur M, Pappata S, Crouzel C. Local brain haemodynamics and oxygen metabolism in cerebrovascular disease: positron emission tomography. Brain 1989;112:931-951
19. Liu Y, Karonen JO, Vanninen RL, Ostergaard L, Roivainen R, Nuutinen J, et al. Cerebral hemodynamics in human acute ischemic stroke: a study with diffusion- and perfusion-weighted magnetic resonance imaging and SPECT. J Cereb Blood Flow Metab 2000;20:910-920
20. Schaefer PW, Ozsunar Y, He J, Hamberg LM, Hunter GJ, Sorensen AG, et al. Assessing tissue viability with MR diffusion and perfusion imaging. AJNR Am J Neuroradiol 2003;24:436- 443
21. Heiss WD, Podreka I. Cerebrovascular disease. In: Wagner HN, Szabo Z, Buchanan JW, eds. Principles of nuclear medicine.
Philadelphia, Pa: WB Saunders Co; 1995:531-548
22. Desmond PM, Lovell AC, Rawlinson AA, Parsons MW, Barber PA, Yang Q, et al. The value of apparent diffusion coefficient maps in early cerebral ischemia. AJNR Am J Neuroradiol 2001;
22:1260-1267
23. Oppenheim C, Grandin C, Samson Y, Smith A, Duprez T, Marsault C, et al. Is there an apparent diffusion coefficient threshold in predicting tissue viability in hyperacute stroke?
Stroke 2001;32:2486-2491
24. Busch E, Kruger K, Allegrini PR, Kerskens CM, Gyngell ML, Hoehn-Berlage M, et al. Reperfusion after thrombolytic therapy of embolic stroke in the rat: magnetic resonance and biochemi- cal imaging. J Cereb Blood Flow Metab 1998;18:407-418 25. Davis D, Ulatowski J, Eleff S, Izuta M, Mori S, Shungu D, et al.
Rapid monitoring of changes in water diffusion coefficients during reversible ischemia in cat and rat brain. Magn Reson Med 1994;31:454-460
26. Hossmann KA. Viability thresholds and the penumbra of focal ischemia. Ann Neurol 1994;36:557-565