Kor. J. Hort. Sci. Technol. 28(5):777-782, 2010
Growth and Nutrient Uptake of ‘Seolhyang’ Strawberry (Fragaria × ananassa Duch) Responded to Elevated Nitrogen
Concentrations in Nutrient Solution
Jong Myung Choi1*, Ahmed Latigui2, and Moo Kyung Yoon3
1Department of Horticulture, Chungnam National University, Daejeon 305-765, Korea
2Faculty Agronomical and Veterinary Science, University of IBN Khaldoun, Tiaret, Algeria
3Vegetable Research Divisions, National Institute of Horticultural & Herbal Science, Suwon 440-706, Korea
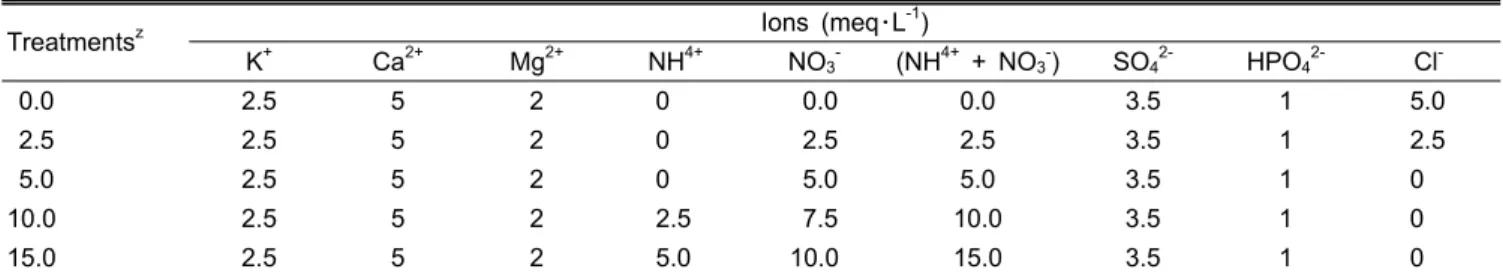
Abstract. This research tested five modified Hoagland solutions for proper fertility management of nitrogen in ‘Seolhyang’ strawberry cultivations. The changes of nutrient solutions were in total nitrogen concentrations (meq・L-1) such as 0 (NO-3), 2.5 (NO3-), 5 (NO3-), 10 (7.5NO3- + 2.5NH4+) and 15 (10NO3- + 5NH4+). The fresh weight and NO3-N concentrations in petiole sap responded to the elevated nitrogen concentrations in fertilizer solution in quadratic (y=7.10+2.668x-0.115x2, R2=0.7983***) and linear (y=26.14+5.245x, R2=0.6083
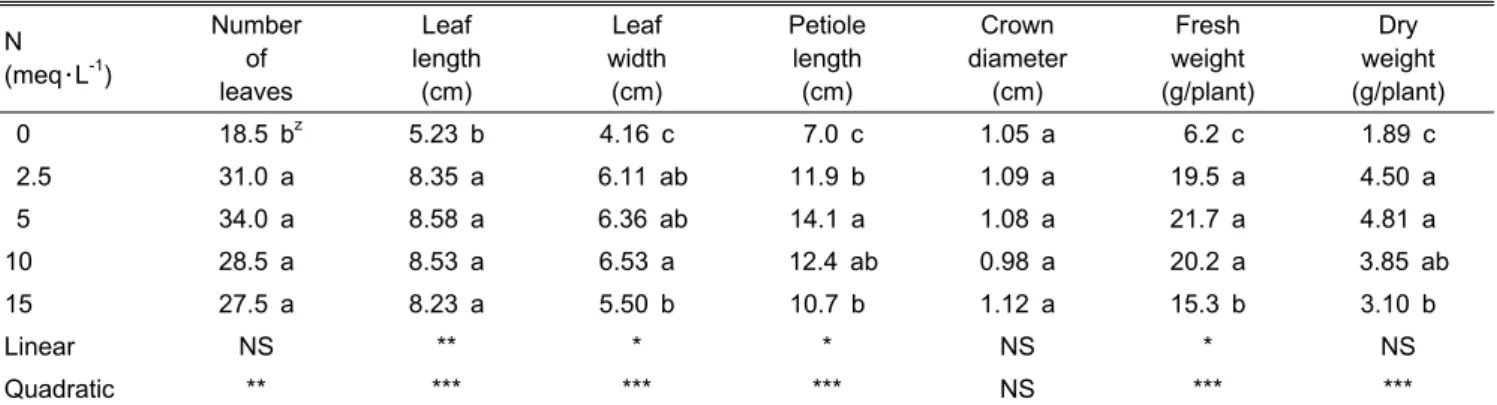
***), respectively. The dry weight and N content of the above ground plant tissue responded to the elevated nitrogen in quadratic (y=2.140+0.492x-0.022x2, R2=0.6110***) and linear (y=0.569+0.033x, R2=0.6952***), respectively. In our experiment the solution with 5 meq・L-1 of NO3- showed positive results in both dry and fresh weight productions. However, a future research about modification of this solution and growth and nutrient uptake response is necessary to achieve better growth of ‘Seolhyang’ strawberry.
Additional key words: dry weight, fresh weight, sap N concentration, tissue N content
*Corresponding author: [email protected]
※ Received 13 January 2010; Accepted 22 June 2010.
Introduction
The strawberry (Fragaria × ananassa Duch.), a member of the Rosaceae family, is one of the most important fruit crops cultivated worldwide (Yonghua et al., 2008). In Korea, most strawberry cultivation is in soil of protected plastic houses from fall to spring. The growers successively cultivate year after year in the same green houses because the construction cost of the houses is relatively high. However, sequential cropping results in salt accumulation in the soil and often leads to the spread of plant pathogens,forcing breeders to develop new varieties of strawberries which are highly tolerant to soil born diseases and soluble salts in soil solutions.
The ‘Seolhyang’ strawberry was bred in Korea by crossing
‘Akihime’ and ‘Red Pearl’ (Kim et al., 2004). This variety is resistant to powdery mildew and has very high productivity compared to others cultivated previously in Korea. In 2008, around 50% of strawberry cultivation areas were covered by this variety (unpublished data). However, recommendations for proper fertility management of this variety have not been available; therefore growers often experienced a decrease of yield and inferior fruit quality, mainly because of the lack
of information on nutrient uptake and optimum tissue mineral contents.
The strawberry has a relatively complex physiology, in particular, on the periodical distribution of physiological stages.
The floral stalks are composed of the primary, secondary, tertiary, and quaternary flowers (Risser and Navatel, 1997).
The single floral stalk overlaps several physiological stages such as the flowering stage, fruit setting stage, magnification stage, and maturation stage (Choi and Latigui, 2008). These characteristics are different frommost other crops.
Growers generally change the composition of nutrient solutions when the plants are in different physiological stages, because inherently each stage has its specific requirements in the ratio of proteosynthesis and photosynthesis needed (Latigui, 1992; Lieten and Misoten, 1992). In the case of the strawberry, it requires the fertilization to meet the 4 stages simultaneously. Hence, growers maintain specific composition of nutrient solutions through the full growing period of straw- berry production. On the other side, the needs of varieties are different especially for the ratio NH4+/ (NH4++ NO3-).
If not appropriate, it could affect the quality and quantity of products (Tabatabei et al., 2007).
The objective of this study was to determine the effect of N concentrations and the variation of N forms on growth
Table 1. Composition of nutrient solutions used to investigate the effect of nitrogen concentrations in fertilizer solution on growth and nutrient uptake of ‘Seolhyang’ strawberry.
Treatmentsz Ions (meq・L-1)
K+ Ca2+ Mg2+ NH4+ NO3-
(NH4+ + NO3-
) SO42-
HPO42-
Cl-
0.0 2.5 5 2 0 0.0 0.0 3.5 1 5.0
2.5 2.5 5 2 0 2.5 2.5 3.5 1 2.5
5.0 2.5 5 2 0 5.0 5.0 3.5 1 0
10.0 2.5 5 2 2.5 7.5 10.0 3.5 1 0
15.0 2.5 5 2 5.0 10.0 15.0 3.5 1 0
zAll treatment solutions contained equal concentration of micronutrient (mg・L-1): MnCl2・4H2O, 1.81; H3BO3, 2.86; ZnSO4・7H2O, 0.22; CuSO4・5H2O, 0.08; H2MoO4・H2O, 0.09; and Na2FeEDTA, 0.79.
and development of ‘Seolhyang’ strawberry in the physiological stage prior to flowering. Emphasis was placed on determining the threshold tissue N concentrations that cause growth reduc- tion and development of a deficiency symptom through the clarifying of the relationship between growth and tissue nitrogen content or that and the petiole sap nitrate concentrations.
Materials and Methods
Treatment Solution
We modified Hoagland (Hoagland and Arnon, 1950) solution to make five treatment solutions containing 0, 2.5, 5, 10 and 15 meq・L-1 of N (Table 1). All of the treatment solutions contained the fixed concentrations of other macro- nutrients (in meq・L-1: 2.5K+, 5 Ca2+, 2 Mg2+, 1 HPO42- and 3.5 SO42-) giving the equal ratio of K+/(Ca2+ + Mg2+) = 0.35.
The treatment solutions also contained equal concentrations of each micronutrient (in μM: 20 B, 0.5 Cu, 20 Fe, 10 Mn, 0.5 Mo and 4 Zn). The pHs of all solution were adjusted to 6.0. Each treatment was repeated 4 times with 2 plants per replication.
Plant Materials and Growth Conditions
The plastic pots with 15 cm in internal diameter and 1600 mL in volume were filled with the 1:1 mixture of coarse (2 to 5 mm) and fine perlite (smaller than 1 mm in diameter).
Then plug-grown ‘Seolhyang’ strawberry seedlings at their three leaf stage were planted. For the first 45 days after planting, the plants were irrigated with distilled water to decrease tissue nutrient levels accumulated during the raising of the seedlings. At 45 days after planting, the older leaves were removed leaving only 3 newly formed leaves per plant to make base line.
At 45 days after planting, plants were irrigated with 5 different solutions representing the 5 treatments (Table 1).
Then, plants were fertigated with the N treatment solutions once a week. Between weekly fertilizer applications, distilled water was used for watering. The amount of fertilizer solution
or water in each pot was adjusted to maintain about 30%
in leaching to avoid the accumulation of the elements in the substrate.
This experiment was conducted in a glasshouse with a controlled environment at Pai Chai University (36° 20' N, 127° 26' E), Daejeon, Korea. The mean day and night temperatures inside the glasshouse were 24 and 15℃, respectively, during the experimental period. The relative humidity was 60% to 70% and the average photoperiod was 15-h with photosynthetic photon flux density of 330-370 μmol・m-2・s-1.
Plant Sampling and Nutrient Analysis
The differences in plant growth was investigated at 120 days after planting by measuring the number of leaves, leaf length, leaf width, petiole length, crown diameter, and fresh and dry weights. All procedures in growth measurement followed the methods described by Choi et al. (2000).
The tissue of the entire above-ground plant parts were harvested for elemental analysis. The collected samples were washed with diluted detergent in distilled water, quickly rinsed in distilled water bath and oven dried at 70℃ for 48 hours. Dried tissue samples were ground, burned to ash, and analyzed using the procedure described by Fonteno and Nelson (1990).
Petioles of the fully grown young leaves were also collected at 120 days after planting for analysis. They were cut into 1 mm long segments, and then samples and distilled water were put into a vial at a ratio of 1:10 (w/w). The vial was gently shaken for 30 minutes by hand to allow electrolytes to leak out from the petiole sections. The samples were filtered with the Whatman No. 2 filter paper and the collected solution was used for NO3--N analysis following the procedures of Cataldo et al. (1975).
The instrument used for nitrogen analysis was Kjeldahl Digestion and Distillation unit (VELP Scientifica, Model UDK 132). Inductively Coupled Plasma (ICP) Optical Emission Spectrometer (Thermo Elemental Tracescan, USA) was used
N (meq・L-1)
Fig. 1. Differences in crop growth of ‘Seolhyang’ strawberry viewed 120 days after transplanting as influenced by nitrogen concentrations in the fertilizer solutions.
Table 2. Influence of elevated nitrogen concentrations in fertilizer solution on the growth characteristics of ‘Seolhyang’ strawberry at 120 days after transplanting.
N (meq・L-1)
Number of leaves
Leaf length
(cm)
Leaf width
(cm)
Petiole length
(cm)
Crown diameter
(cm)
Fresh weight (g/plant)
Dry weight (g/plant)
0 18.5 bz 5.23 b 4.16 c 7.0 c 1.05 a 6.2 c 1.89 c
2.5 31.0 a 8.35 a 6.11 ab 11.9 b 1.09 a 19.5 a 4.50 a
5 34.0 a 8.58 a 6.36 ab 14.1 a 1.08 a 21.7 a 4.81 a
10 28.5 a 8.53 a 6.53 a 12.4 ab 0.98 a 20.2 a 3.85 ab
15 27.5 a 8.23 a 5.50 b 10.7 b 1.12 a 15.3 b 3.10 b
Linear NS ** * * NS * NS
Quadratic ** *** *** *** NS *** ***
zMean separation by Duncan’s multiple range test at P ≤ 0.05. Values followed by the same letter within columns are not significantly different.
NS,*,**,***Nonsignificant or significant at P ≤ 0.05, 0.01 and 0.001, respectively.
for the elements: K, Ca, P, Mg, Fe, Mn, Zn and Cu. The NO3--N from petiole section was analysed by using spectro- photometer Model CE 5001 (Cecil, England).
Soil solution was also analyzed 120 days after planting.
It was extracted by the method of Warncke (1986). The pH and electrical conductivity were measured by a pH meter (Model 900A, Orion) and an EC meter (Model 122, Orion), respectively.
Statistical Analysis
Data from growth measurements, tissue analysis, soil solution pH and EC were subjected to a randomized complete block analysis of variance and treatment means were separated by LSD test. Data were also subjected to polynomial regression analysis. We regarded the equation with the highest R2 and incremental F value among linear and quadratic as the best equations. Data analyses were conducted using CoStat program (CoHort Software version 6.3, Monterey, CA).
Results and Discussions
Regarding the visual N deficiency symptoms, Figs. 1 and 2 showed that the new leaves that appeared from plants in treatment of 0 and 2.5 meq・L-1 NO3- were small and pale yellow green in color. The older leaves also became yello- wish with necrotic margins and died prematurely. Contrarily, the treatment solutions of 5, 10 and 15 meq・L-1 of T-N did not seriously restrict plant growth.
The growth characteristics of ‘Seolhyang’ strawberry in- fluenced by N treatment solutions are shown in Table 2.
The leaf numbers were not significantly different among treatments from 2.5 to 15 meq・L-1 N. The least leaf number was obtained in T0. The crown diameters were also not affected by the N concentrations in the nutrient solutions.
The treatments of T2.5, T5, T10 and T15 had statistically the same length of leaves with 8.35, 8.58, 8.53 and 8.23 cm, respectively. However, the relatively lower length 5.23 cm was obtained by T0. Also, the addition and elevation of NH4+ from 2.5 to 5 meq・L-1 in T10 and T15 decreased significantly the leaf widths from 6.53 to 5.50 cm. This change also resulted in the decrease of the petiole length from 14.1 to 10.7 cm.
The fresh weights of T2.5, T5 and T10 were 19.5, 21.7 and 20.2 g per plant, respectively, which were not signi- ficantly different among treatments but were heavier than those of T0 and T15 (Table 2). The response in the fresh weight production to the elevated nitrogen concentrations in fertilizer solution was quadratic with the equation of y
= 7.10+2.668x-0.115x2 (R2=0.7983***) (Table 2 and Fig.
3). The NO3--N concentrations in petiole sap to the elevated nitrogen concentrations in fertilizer solution showed linear increase with the equation y=26.14+5.245x (R2=0.6083***) (Fig. 3).
The highest dry weights of 4.50 and 4.81 g per plant were obtained in T2.5 and T5. However, the extra addition of NH4+ in T10 and T15 resulted in a decrease in dry weights
T-N (meqL-1)
Fresh weight (g/plant)
0 5 10 15 20 25 30
NO3-N Conc. (mg.kg-1 petiole sap) 0 20 40 60 80 100 120 140 160 Fresh weight: y = 7.0998 + 2.6681x - 0.1145x2, R2 = 0.7983***
NO3-N Conc.: y = 26.143 + 5.2446x, R2 = 0.6083***
0.0 2.5 5.0 10.0 15.0 T-N (meq・L-1)
Fig. 3. Influence of elevated nitrogen concentrations in fertilizer solution on changes in fresh weight and nitrogen concentrations in petiole sap of ‘Seolhyang’ strawberry at 120 days after transplanting.
Table 3. Influence of elevated nitrogen concentrations in fertilizer solution on the tissue nutrient content of ‘Seolhyang’ strawberry based on whole above ground plant tissue at 120 days after transplanting.
N (meq・L-1)
T-N P K Ca Mg Na Fe Mn Zn Cu
--- (%) --- --- (mg・kg-1) ---
0 0.49 cz 0.48 c 1.63 b 1.85 a 0.52 d 0.07 a 261.1 b 127.6 a 39.0 a 9.61 b
2.5 0.81 bc 0.73 ab 2.58 a 1.77 a 0.67 ab 0.03 b 140.7 c 90.4 b 23.8 b 10.37 ab
5 1.28 ab 0.77 a 2.73 a 1.85 a 0.75 a 0.05 ab 160.5 c 89.5 b 24.5 b 9.78 ab
10 1.36 a 0.76 ab 2.68 a 1.54 b 0.62 bc 0.05 ab 280.4 b 98.4 b 18.0 b 11.00 ab
15 1.52 a 0.69 b 2.48 a 1.47 b 0.57 cd 0.07 a 340.5 a 88.8 b 23.8 b 11.73 a
Linear *** * * *** NS NS NS * ** *
Quadratic *** *** *** ** *** * * ** *** NS
zMean separation by Duncan’s multiple range test at P ≤ 0.05. Values followed by the same letter within columns are not significantly different.
NS,*,**,***No significant or significant at P ≤ 0.05, 0.01 and 0.001, respectively.
Deficient Normal
N 0 meq・L-1 N 2.5 meq・L-1 N 10 meq・L-1
Fig. 2. Induced nitrogen deficiency symptoms in ‘Seolhyang’ strawberry. The growth was seriously restricted in N deficient plants (upper left and middle). The new leaves were small and pale yellow green in color whilst the older leaves became yellow (lower left).
to 3.85 and 3.10 g per plant, respectively (Table 2). The response in dry weight of the whole above ground plant tissue to the elevated nitrogen concentrations in fertilizer solution was quadratic with the equations of y=2.140+0.492x- 0.022 x2 (R2=0.6110***) (Fig. 4). The tissue N contents based on whole above ground plant tissue increased from 0.49% in T0 to 1.52% in T15 as total N concentrations in the nutrient solutions were elevated (Table 3 and Fig. 4).
The tissue N content increased lineally with the equations of y=0.569+0.032x (R2=0.6952***) (Table 3 and Fig. 4).
It should be noted that the plants fertigated with 0 meq・L-1 of N (T0) had 0.49% in tissue N content (Table 3). The reason for high N contents is that the nitrogen-induced increase in growth rate is accompanied by a decrease in N content in the dry matter. This is referred as the Piper-Steenbjerg effect
T-N (meqL-1)
Dry weight (g/plant)
0.0 1.0 2.0 3.0 4.0 5.0 6.0
N content (% dry weight)
0.0 0.2 0.4 0.6 0.8 1.0 1.2 1.4 1.6 1.8 Dry weight: y = 2.1403 + 0.4915x - 0.0223x2, R2 = 0.6110***
T-N: y = 0.5687 + 0.0325x, R2 = 0.6952***
0.0 2.5 5.0 10.0 15.0 T-N (meq・L-1)
Fig. 4. Influence of elevated nitrogen concentrations in fertilizer solution on changes in dry weight and nitrogen content of the whole above ground plant tissue of ‘Seolhyang’ strawberry at 120 days after transplanting.
T-N (meqL-1)
pH
0.0 5.5 6.0 6.5 7.0 7.5 8.0
Electrical conductivity (dS
-1. m)
0.0 0.8 1.0 1.2 1.4 1.6 1.8
pH: y = 6.7272 + 0.0841x - 0.0055x2, R2 = 0.5658***
EC: y = 1.1303 - 0.0417x + 0.0032x2, R2 = 0.8796***
0.0 2.5 5.0 10.0 15.0 T-N (meq・L-1)
Fig. 5. Influence of elevated nitrogen concentrations in the fertilizer solution on changes in pH and EC in soil solution of root media at 120 days after transplanting of ‘Seolhyang’ strawberry.
(Lieten and Misoten, 1992). Since the plants received no nitrogen during the 165 days of experimentation, this explains the high capacity of the strawberry to conserve the N for a long period.
Elevated nitrogen concentrations higher than 5 meq・L1 resulted in a decrease of tissue P and Mg contents from 0.77 to 0.69% and from 0.75 to 0.57%, in T5 and T15, respectively (Table 3). The Ca content is also affected by the incorporation of an inappropriate amount of NH4+ in the nutrient solution, decreasing from 1.85% in T5 to 1.47%
in T15. Ganmore-Neumann and Kafkafi (1980, 1983) indicated that ammonium nutrition decreases the plants uptake of other cations such as Ca2+, Mg2+ and K+. For this reason, a reasonable K/N ratio and the release of H+ from plant roots must be considered when NH4 is involved in a nitrogen fertilizer.
In spite of no addition during the experimental period, we found that the tissue Na contents were different from 0.03 to 0.07% (Table 3), explaining the high capacity of the strawberry to accumulate the nutrients. As the ratio of NH4+ were elevated in the nutrient solutions, the tissue content of Fe increased showing 340.5 mg・kg-1 in T15 (Table 3). The ammonium assimilation in roots produced about one proton per molecule ammonium taken up which has to be excreted into an external medium. Tissue Fe contents increase in low external pH (Marschner, 1995). Even though the form of nitrogen supply has an impact on tissue nutrient contents, the combined supply of ammonium and nitrate with a reaso- nable ratio promote plant metabolism such as proteosynthesis, thereby increasing plant yield, compared to only the sole nutrition of ammonium or nitrate (Heller et al., 1989). Sas et al (2007) obtained similar results in research about straw- berries. They also found that NH4+ is an undesirable source
of nitrogen for strawberries when the temperature in the root zone is higher than 30℃ due to its adverse effect on root growth and pant development. In T10 and T15 the rate of NH4+ in total nitrogen supply were 25% and 33%, respectively (Table 1). Imas et al. (1997) recommended combined supply of NH4+ with 20% and NO3- with 80%.
The EC increased to 1.6dS・m-1 as the concentration of total nitrogen were elevated to 15 meq・L-1 in the nutrient solution (Fig. 5). The responses of EC to the elevated nitrogen concentrations in fertilizer solutions was quadratic with the equations of y=6.727+0.084x-0.006x2 (R2=0.5658***). The pH 6 which is the most favorable in nutrient solution culture was obtained in treatments of 10 and 15 meq・L-1. The trend of pH response to the elevated nitrogen concentrations in fertilizer solution was also quadratic with the equations of y=1.130-0.042x+0.003x2*** (R2=0.8796), respectively. The presence of 2.5 and 5 meq・L-1 of NH4+ were favored for lowering the soil solution pH and the proper absorption of trace elements.
The results of changes in pH and EC as well as the growth response to elevated nitrogen concentrations indicate that the
‘Seolhyang’ strawberry is very susceptible to both high soluble salt levels in fertilizer solutions and the elevation of NH4+. Awang (1995) and Awang et al. (1993) showed that unsui- table environments of root rhizosphere such as high salinity in substrate can cause a series of morphological, physiological, biochemical and molecular changes that adversely affect plant growth and productivity. In our experiment, high soluble salt levels higher than 1.2 dS・m-1 resulted in a decrease of crop growth in fresh and dry weights.
Literature Cited
Awang, Y.A. 1995. Growth and fruiting responses of strawberry
질소 시비농도가 ‘설향’ 딸기(
Fragaria
xananassa
Duch)의 생장과 무기원소 흡수에 미치는 영향최종명1*ㆍ아흐메드 라티기2ㆍ윤무경3
1충남대학교 원예학과, 2알제리 티아렛 IBN Khaldoun 대학교 농과대학, 3국립원예특작과학원 채소재배과 (*교신저자)
초 록. ‘설향’ 딸기의 영양생리를 구명하기 위한 연구의 일환으로 Hoagland 용액의 질소 수준을 변화시킨 용액으로 재배하
면서 생장 및 무기원소 흡수에 미치는 영향을 구명하기 위해 본 연구를 수행하였다. 본 연구에서 적용한 관비용액의 질소 수준(meq・L-1)은 0(NO3-), 2.5(NO3-), 5(NO3-), 10(7.5NO3- + 2.5NH4+), 그리고 15(10NO3- + 5NH4+) 였다. 정식 120일 후의 지상부 생체중과 엽병추출액의 질산태질소 농도는 관비용액의 질소 시비수준이 높아짐에 따라 각각 2차곡선회귀적(y=7.10+
2.668x-0.115x2, R2=0.7983***) 또는 직선적(y=26.14+5.245x, R2=0.6083***)으로 증가하였다. 지상부 건물중과 건물내 질소 함량도 각각 2차곡선회귀적(y=2.140+0.492x-0.022x2, R2=0.6110***) 또는 직선적(y=0.569+0.033x, R2=0.6952***)으로 증가
하는 반응을 보였다. 식물체의 지상부 건물중과 생체중을 고려할 때 본 연구에서 적용한 관비용액의 질소농도 중 5meq・L-1
처리의 생장이 가장 우수하였지만 ‘설향’ 딸기의 최적 생장을 위해 5meq・L-1 처리 용액을 변화시켜야 하며 추후 관련 연구가
필요하다고 판단하였다.
추가 주요어 : 건물중, 생체중, 생체즙액 질소 농도, 건물 질소 함량 plants grown on rockwool to shading and salinity. Scientia
Hort. 62:25-31.
Awang, Y.B., J.G. Atherton, and A.J. Taylor. 1993. Salinity effects on strawberry plants grown in rockwool. II. Fruit quality. J.
Hort. Sci. 68:791–795
Cataldo D.A., M. Haren, L.E. Schrader, and V.L. Young. 1975.
Rapid colorimetric determination of nitrate in plant tissue by nitration of salicylic acid. Commun Soil Sci. Plant Anal.
6:71-80.
Choi J.M., S.K. Jeong, K.H. Cha, H.J. Chung, and K.S. Seo.
2000. Deficiency symptom, growth characteristics, and nutrient uptake of ‘Nyoho’ strawberry as affected by controlled nitrogen concentration in fertilizer solution. J. Kor. Soc. Hort. Sci.
41:339-344.
Choi J.M. and A. Latigui. 2008. Effect of various Mg con- centrations on the quantity of chlorophyll of 4 varieties of strawberry (Fragaria ananassas D) cultivated in inert media.
J. Agr. 7:244-250.
Fonteno, W.C. and P.V. Nelson. 1990. Physical properties of and plant response to rock-wool amended media. J. Amer.
Soc. Hort. Sci. 115:375-381.
Ganmore-Neumann, R. and U. Kafkafi. 1980. Root temperature and percentage NO3-/NH4+ effect on tomato plants. I. Mor- phology and growth. Agron. J. 72:758-761.
Ganmore-Neumann, R. and U. Kafkafi. 1983. Root temperature and percentage NO3-/NH4+ effect on strawberry plants. I. Growth, flowering and root development. Agron. J. 75:941-947.
Heller, R., R. Esnault, and C. Lance. 1989. Plant physiology : Nutrition. Masson, Paris.
Hoagland, D.R. and D.I. Arnon. 1950. The water culture method for growing plants without soil. Univ. of Calif. Agri. Exp.
Sta. Circular 347.
Imas, P., B. Bar-Yosef, U. Kafkafi, and R. Ganmore-Neumann.
1997. Release of carboxylic anions and protons by tomato roots in response to ammonium nitrate ratio and pH in nutrient solution. Plant and Soil 191:27-34.
Kim, T.I., W.S. Jang, J.H. Choi, M.H. Nam, W.S. Kim, and S.S.
Lee. 2004. Breeding of ‘Maehyang’ strawberry for forcing culture. Kor. J. Hort. Sci. & Tech. 22:434-437.
Latigui, A. 1992. Effect of different fertilizations of the eggplant and tomatoes grown in inert media on the biotic potential of Macrosiphum euphorbiae. PhD Diss, Univ. Aix Marseille III, France.
Lieten, F. and C. Misoten. 1992. Nutrient uptake of strawberry plants (CV. Elsanta) grown on substrate. Acta Hort. 348:299-306.
Marschner, H. 1995. Mineral nutrition of higher plants. Academic Press Limited, London.
Risser, G. and J.C. Navatel. 1997. Monographie: la fraise plants et variedit, CTIFL, France. p. 103.
Sas, L., H. Marschner, V. Roheld and S. Mercik. 2007. Effect of nitrogen forms on growth and chemical changes in the rhizosphere of strawberry plants. Acta Physiol. Plant 25:241- 247.
Tabatabei, S.J., M. Yusefi, and J. Hajiloo. 2007. Effect of shading and NO3:NH4 ratio on the yield, quality and N metabolism in strawberry. Sci. Hort. 116:264-272.
Warncke, P.D. 1986. Analysing greenhouse growth media by the saturation extraction method. HortScience 21:223-225.
Yonghua, Q., A.B. Jaime, A. Teixeira da Silva, D. Lingxiao Zhang, and A. Shanglong Zhang. 2008. Transgenic strawberry state of the art for improved traits. Biotechnol Adv. 26:219-232.