Korean J. Breed. Sci. 52(1):25-31(2020. 3) https://doi.org/10.9787/KJBS.2020.52.1.25
복숭아 Genomic DNA의 FT-IR 스펙트럼을 이용한 대목 육성용 야생종 복숭아의 다변 량통계분석
송승엽⋅남은영⋅윤석규⋅김성종⋅권정현* 국립원예특작과학원 과수과
Multivariate Analysis of Wild Peach Accessions for Rootstock Breeding Using FT-IR Spectroscopy of Genomic DNA Data
Seung-Yeob Song, Eun-Young Nam, Seok-Kyu Yun, Sung-Jong Kim, and Jung-Hyun Kwon*
Fruit Research Division, National Institute of Horticultural & Herbal Science, Rural Development Administration, Wanju 55365, Republic of Korea
Abstract FT-IR spectroscopy, combined with multivariate analysis, was used to determine whether 67 different wild and rootstock peach accessions could be discriminated from each other. Genomic DNA was isolated from leaves, and the purified genomic DNA was analyzed by FT-IR spectroscopy in the spectral region from 1800 to 800 cm
-1. FT-IR spectra showed that typical spectral differences existed in the frequency regions of N-H stretching (amide I), C=O stretching vibrations (amide II), and PO
2−ionized asymmetric and symmetric stretching.
Principal component analysis (PCA) was able to discriminate three groups. The partial least squares discriminant analysis (PLS-DA) yielded more clear discrimination among the three groups of peach accessions. The FT-IR spectral differences might be directly related to subtle changes in the base functional group and backbone structures of genomic DNA. This technique could provide a research foundation for FT-IR spectral-based rapid diagnosis, selection, and discrimination of peach accessions for rootstock.
Keywords Wild peach, Rootstock, Principal component analysis (PCA), Partial least square discriminant analysis (PLS-DA), Genomic DNA
Received on October 22, 2019. Revised on October 25, 2019. Accepted on November 26, 2019.
* Corresponding Author (E-mail: [email protected], Tel: +82-63-238-6734, Fax: +82-63-238-6705)
ⓒ 2020 by the Korean Society of Breeding Science
서 언
복숭아는 장미과, 자두나무속에 속하는 온대 낙엽성 과수로 중국이 원산지이다. 복숭아는 교배 육종, 돌연변이 등으로 많은 품종들이 존재하지만, 자가수분과 반복적인 모본의 사용 등으로 유전적 다양성이 낮은 편이다(Scorza et al. 1985). 복숭아의 유전 적 다양성을 분석하기 위해서 형태적, 분자생물학적 방법이 쓰이 고 있으며, 화기 모양, 과일 솜털의 유무, 과육색 등 다양한 질적 형질을 통해 복숭아의 형태적 분류가 가능하다(Kwon et al. 2015).
유전적 다양성을 분석할 수 있는 분자생물학적인 방법으로는 Randomly amplified polymorphic DNA (RAPD) (Warburton
& Bliss 1996, Casas et al. 1999), Amplified fragment length polymorphism (AFLP) (Hu et al. 2005, Xu et al. 2006), Simple sequence repeats (SSR) (Yoon et al. 2006, Bouhadida et al. 2009, Cheng & Huang 2009), Sequence-related amplified polymorphism (SRAP) (Ahmad et al. 2004)와 같은 다양한 DNA마커들이 있다.
이러한 분자마커를 이용한 분석은 비교적 정확하지만, 정확한 염기서열 정보가 필요하기 때문에 정확하고 빠른 비파괴적인 분석법이 개발될 필요가 있다.
대사체 분석법인 Fourier transform ion cyclotron resonance mass spectrometry (FT-ICR MS)는 유전자 변화를 확인할 수 있는 기술이지만(Mungur et al. 2005), 비용이 높아 일반적으로 잘 사용되지 않는다(Lei et al. 2011). 이에 비해 Fourier transform infrared (FT-IR)은 분자 구조의 화학결합 형태를 확인할 수 있는 기술로 화학, 농업, 제약, 식품 산업 등 다양한 연구 분야에서 널리 사용되고 있는 방법이다.
분자내의 특징적인 화학 작용기의 진동에 따라 FT-IR의 스펙 트럼이 다르게 나타나는데, 세포내의 지질, 단백질, 다당류, 그리 고 핵산 등의 화학구조를 구체적으로 분석할 수 있다(Lee &
Chapman 1986, Naumann et al. 1991). FT-IR을 이용한 분석법은 미생물(Ngo-Thi et al. 2003), 균류(Naumann et al. 2005, Fischer et al. 2006), 박테리아(Preisner et al. 2007, Sundaram et al. 2012)의
Accession No Origin Collected
year Collected location Rootstock or variety
BY94p6050 OP2 USA
BY94p6050 OP4 USA
Heiligoutao China
Heiligoutao (Superior line) China
K157306 OP1 Pakistan
Nemaguard USA
P. davidiana China
P. ferganensis USA
Paloro USA
Tukuba No.4 Japan
Tukuba No.7 Japan
Tukuba No.10 Japan
Tzim Pee Tao China
Yaebenishidare Japan
Table 1. List of 67 peach accessions used in this study.
Accession No Origin Collected
year Collected location Wild peach
PH006 Korea 1982 Okcheon
PH008 Korea 1982 Hamyang
PH019 Korea 1984 Uiseong
PH020 Korea 1984 Danyang
PH032 Korea 1985 Goseong
PH040 Korea 1985 Seoul
PH046 Korea 1986 Unknown
PH048 Korea 1986 Unknown
PH058 Korea 2000 Jeju
PH062 Korea 2000 Jeju
PH065 Korea 2000 Jeju
PH066 Korea 2000 Jeju
PH067 Korea 2000 Seogwipo
PH068 Korea 2000 Seogwipo
PH069 Korea 2000 Seogwipo
PH070 Korea 2000 Seogwipo
PH078 Korea 2000 Yeongdong
PH079 Korea 2000 Yeongdong
PH080 Korea 2000 Okcheon
PH082 Korea 2000 Okcheon
PH090 Korea 2000 Wonju
PH097 Korea 2000 Inje
PH099 Korea 2000 Yanggu
PH101 Korea 2000 Yanggu
PH105 Korea 2000 Hapcheon
PH106 Korea 2000 Hapcheon
PH107 Korea 2000 Geochang
PH108 Korea 2000 Haman
PH114 Korea 2000 Geoje
PH115 Korea 2000 Geoje
PH118 Korea 2000 Ulsan
PH124 Korea 2000 Gyeongsan
PH128 Korea 2000 Hongcheon
PH132 Korea 2000 Jeongseon
PH142 Korea 2000 Uiseong
PH143 Korea 2000 Yecheon
PH144 Korea 2000 Danyang
PH147 Korea 2000 Sokcho
PH148 Korea 2000 Inje
PH156 Korea 2000 Namhae
PH169 China 2000 Imported seed
PH170 China 2000 Imported seed
PH176 China 2000 Imported seed
PH184 Korea 2001 Wanju
PH185 Korea 2001 Wanju
PH193 Korea 2001 Suncheon
PH197 Korea 2001 Yeosu
PH200 Korea 2001 Geochang
PH201 Korea 2001 Geochang
PH202 Korea 2001 Chungju
PH210 Korea 2001 Uljin
PH710 Korea 1986 Unknown
PH712 Korea 1986 Unknown
Table 1. Continued
식별 연구, 생식 세포질의 대사 평가(Yesudas et al. 2013), 암과같은 질병 진단(Argov et al. 2002, Malins et al. 2005, Sahu et al. 2008) 등에 다양하게 쓰이고 있다. 또한, 옥수수와 벼(Emura et al. 2006), 차나무(Song et al. 2017) 등의 식물체에서도 FT-IR 을 이용하여 DNA 수준에서의 유전적 차이를 분석한 바 있다.
국립원예특작과학원에서는 복숭아의 유전적 다양성을 확보 하기 위해 국내에 분포하고 있는 야생 복숭아를 수집하였으며, 이러한 계통들은 국내 환경 적응성이 뛰어나기 때문에 대목 육종의 소재로서 활용가치가 높을 것으로 보인다. 본 연구는 genomic DNA의 FT-IR 스펙트럼을 이용하여 야생 복숭아 계통 들의 다양성을 확인하고 유연관계를 분석함으로서 우량한 대목 계통을 선발할 수 있는 식별 시스템을 구축하고자 수행되었다.
재료 및 방법
복숭아 재료 및 DNA 분리
본 연구는 국립원예특작과학원 시험 포장에 재식 되어 있는 53점의 야생 복숭아 계통과 14점의 대목용 복숭아 품종을 이용하 였다(Table 1). 동결 건조된 잎 시료 10 mg을 DNeasy Plant Mini Kit (QIAGEN, Dusseldorf, Germany)를 이용하여 추출하였으 며 NanoDrop 2000 (Thermo Scientific, Wilmington, DE, USA)을 이용하여 추출된 DNA의 농도와 순도를 확인하였다. AE buffer 를 이용하여 DNA 최종 농도를 20ng/㎕으로 조정하였으며 아가 로스 겔 전기영동을 통해 DNA를 확인한 후 -20℃에 보관하여 분석에 사용하였다(Song et al. 2014).
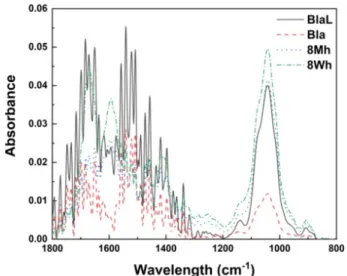
Fig. 1. Representative FT-IR (Fourier transform infrared) spectral from genomic DNA of wild peach. FT-IR spectral ranges showed quantitative information of N-H stretching (amide I) and C=O stretching vibrations (amide II) (1750-1600 cm
-1), purine and pyrimidine ring (1550-1400 cm
-1), and PO
2−ionized asymmetric and symmetric stretching (110-950 cm
-1). BlaL: Heiligoutao (Sup), Bla: Heiligoutao, 8Mh: Yaebenishidare, 8Wh: Yaebenishidare (W).
Genomic DNA의 FT-IR 스펙트럼 분석
FT-IR 스펙트럼 분석은 Tensor II (Bruker Optics GmbH, Ettlingen, Germany)를 사용하였고, deuterated triglycine sulfate (DTGS) 검출기로 분석하였다. 추출된 genomic DNA 시료 5 ㎕를 384-well ZnSe plate에 분주하여, 37℃에서 약 20~30분간 건조하 였다. 건조된 ZnSe plate에 Tensor II에 장착된 HTS-XT (Bruker Optics GmbH) 고효율 자동화 장치를 이용하여 스펙트럼을 조사 하였다. 각 시료의 스펙트럼은 4 cm-1간격으로 4,000~400 cm-1범 위에서 총 128회 반복 측정하였고, 측정된 스펙트럼의 평균 스펙 트럼을 분석에 사용하였다. 각 시료의 FT-IR 스펙트럼은 통계적 분석을 위해 각각 3반복 측정하였다. FT-IR 스펙트럼 조사 및 데이터 변환에 사용된 프로그램은 Bruker에서 제공하는 OPUS Lab (ver. 7.0, Bruker Optics Inc.)를 사용하였다. IR 스펙트럼은 control plate 스펙트럼(background) 값을 뺀 후 샘플의 스펙트럼을 나타냈다. 다변량통계분석을 위해 기본 FT-IR 스펙트럼을 OPUS software (ver. 7.0)를 사용하여, baseline correction, normalization 그리고 smoothing을 실시하여 전처리 하였다. Python (ver. 2.7) 을 통해 전처리 된 스펙트럼을 2차 미분을 하였으며 이를 이용하여 다변량통계분석을 실시하였다(Song et al. 2014).
FT-IR 스펙트럼의 다변량통계분석
다변량통계분석은 전체 스펙트럼에서 1,800-800 cm-1영역의 FT-IR 스펙트럼 데이터를 이용하여 principal component analysis (PCA), hierarchical clustering analysis (HCA) 그리고 partial least squares discriminant analysis (PLS-DA)을 실시하였다.
2차 미분된 FT-IR 스펙트럼 데이터는 R 통계 분석 프로그램 (ver. 3.1.2, Auckland, New Zealand)을 통해 분석되었다. PCA및 PLS-DA는 non-linear iterative partial least squares (NIPALS) 알고리즘(Wold 1966)에 따라 R 프로그램(ver. 3.1.2)을 사용하여 분석되었다. PCA 및 PLS-DA에서 얻어진 값을 unweighted pair group method with arithmetic mean analysis (UPGMA)를 사용 하여 Euclidean distance를 측정하고 각 시료의 유연관계를 HCA dendrogram으로 나타내었다.
결과 및 고찰
야생 복숭아의 FT-IR 스펙트럼 분석
복숭아 야생 계통과 대목 품종의 genomic DNA로부터 FT-IR 스펙트럼을 확인한 결과, 1,750-1,600, 1,550-1,400, 1,150-950 cm-1 부위에서 특징적인 스펙트럼 변화를 볼 수 있었다(Fig. 1).
핵산의 FT-IR 스펙트럼은 그 구조와 상호작용에 의해 3개의 파장 범위에서 특징적으로 나타난다(Banyay et al. 2003, Gonzalez-Ruiz et al. 2011). 1,750-1,600 cm-1 범위는 DNA의 염기 구조인 C=O, C=N 그리고 C=C 형태와 –NH2 결합 형태를 나타내며(Brewer et al. 2002, Banyay et al. 2003), 1,550-1,400 cm-1 범위는 퓨린과 피리미딘의 링 구조와 관련되어 있으며(Falk et al. 1963, Liquier et al. 1991, Zhou-Sun et al. 1997), 1,100-950 cm-1범위는 phosphodiester-deoxyribose backbone 내의 PO2- 그 룹의 대칭적 또는 비대칭적 구조와 관련되어 있다(Falk et al.
1963, Zhou-Sun et al. 1997). 또한 이러한 3가지 주요 파장 범위에서 스펙트럼의 차이는 DNA구조의 backbone과 sugar pucker 사이의 base pairing, base stacking 그리고 glycosidic bond 회전과 밀접하게 연관되어 있다(Brewer et al. 2002, Gonzalez-Ruiz et al. 2011). 본 실험 결과의 해당 파장에서의 FT-IR 스펙트럼의 특징적 차이는 복숭아 야생 계통 간 genomic DNA의 구조적 차이가 있음을 의미하며, 이는 고유한 genomic DNA 특성에 나타날 수 있다는 것을 의미한다. 이는 대목용 복숭아와 야생 복숭아가 분류가 다르게 나타나도 genomic DNA 가 고유한 스펙트럼을 갖고 있기 때문에 유사한 DNA 배열을 확인할 수 있음을 나타낸다. 따라서, FT-IR 스펙트럼 분석은 대목으로 사용되고 있는 복숭아와 유사한 DNA 스펙트럼을 나타 내는 야생 복숭아 간의 분류를 통해 복숭아 대목을 선발하는
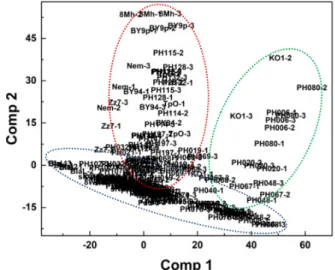
Fig. 2. PCA (principal component analysis) scores (A) and loading values plot (B) of PCA scores from FT-IR (Fourier transform infrared) data of wild peach.
Fig. 3. PLS-DA (partial least square discriminant analysis) score plot of FT- IR (Fourier transform infrared) data from wild peach.
새로운 도구로 적용 할 수 있는 것으로 보인다.
야생 복숭아의 FT-IR 스펙트럼 다변량통계분석
야생 및 대목 복숭아로부터 얻은 FT-IR 데이터를 이용하여 다변 량통계 분석을 실시 하였다(Fig. 2). PC 1과 2의 변이량은 각각 94.0%와 4.1%의 설명력을 나타냈고 이는 전체 변이량의 약 98.1%
에 해당하였다. PCA 분석을 통해 복숭아 계통이 3개의 그룹으로 나뉘는 것을 확인할 수 있었다. 좌측 그룹에는 Yaebenishidare (8Mh), BY94P6050 OP2 (BY94), BY94P6050 OP4 (BY9p), Nemaguard (Nem), Paloro (Pal), Tzim Pee Tao (TpO)와 Tsukuba No.7 (Zz7)가 분포하였으며, 우측 그룹에는 K157306 OP1 (KO1) 가 분포하였다. 또한 하단 그룹에는 Heiligoutao (Bla)와 Heiligoutao (Sup) (BlaL), P. davidiana (Pdd)와 P. ferganensis (Fer)가 분포하 였다. 이렇게 3 그룹으로 나뉘어진 대목 복숭아 그룹을 중심으로 야생 복숭아 계통들이 분포하는 것으로 나타났으며, 이를 통해 야생 복숭아가 복숭아 대목과 유사한 유전적 정보를 갖고 있는 것으로 확인되어 야생 복숭아 계통을 대목용으로 활용이 가능할 것으로 보인다.
PCA를 구분하는 중요한 요인을 확인하기 위해 loading value를 분석하였다. Loading value에서도 1,750-1,600, 1,550-1,400 그 리고 1,150-950 cm-1의 세 범위에서 차이가 나타남을 알 수 있었다 (Fig. 2B). 이 결과는 스펙트럼 결과와 마찬가지로 DNA의 염기 구조인 C=O, C=N 그리고 C=C 형태와 –NH2 결합 형태, 퓨린과 피리미딘 모델, 그리고 phosphodiester-deoxyribose backbone내 에서 PO2- 그룹의 대칭 또는 비대칭 구조가 품종 간 분류에 중요하 게 작용함을 알 수 있었다.
PLS-DA score plot는 PCA 분석 보다 더욱 분명한 그룹 식별이 가능하였다(Fig. 3). PCA결과와 동일하게 Yaebenishidare (8Mh), BY94P6050 OP2 (BY94), BY94P6050 OP4 (BY9p), Paloro (Pal), Nemaguard (Nem), Tzim Pee Tao (TpO)와Tsukuba No.7 (Zz7)이 함께 좌측 그룹에 분포하였고, K157306 OP1 (KO1)이 우측 그룹에 분포하였다. 하단 그룹에는 Heiligoutao (Bla)와 Heiligoutao (Sup) (BlaL), P. davidiana (Pdd)와 P. ferganensis (Fer)이 분포하 였다(Fig. 3). 이 결과를 통해 대목 품종과 야생 복숭아 사이의 유전적 유사성을 판별할 수 있고, 추후 우수한 복숭아 대목 육성에 이용될 수 있을 것이다.
야생 복숭아의 유연 관계 분석
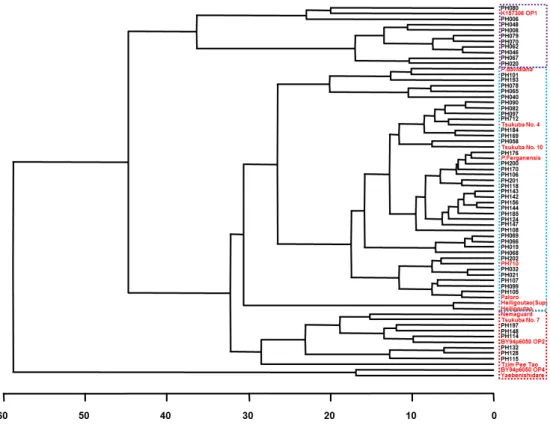
FT-IR 스펙트럼 데이터의 PCA로부터 얻은 HCA dendrogram은 Fig. 4와 같다. Paloro, Nemaguard, Tsukuba No.7, Yaebenishidare,
Fig. 4. HCA (hierarchical clustering analysis) dendrograms from PCA (principal component analysis) of wild peach.
Fig. 5. HCA (hierarchical clustering analysis) dendrograms from PLS-DA (partial least square discriminant analysis) of wild peach.
BY94P6050 OP2, BY94P6050 OP4와 Tzim Pee Tao가 그룹을 형성하였고, Nemaguard, Tsukuba No.7, BY94P6050 OP4와 Yaebenishidare, BY94P6050 OP2와 Tzim Pee Tao의 유연관계 가 각각 높은 것으로 나타났다. Heiligoutao와 Heiligoutao (Sup), Yaebenishidare, P. davidiana 그리고 P. Ferganensis이 그룹을 형성하였으며, Heiligoutao와 Heiligoutao (Sup)의 유연관계가 높은 것으로 나타났다. 또한, K157306 OP1 (KO1)이 그룹을 형성 하였다. PLS-DA에서 얻은 HCA dendrogram에 의하면(Fig. 5), BY94P6050 OP4와 Yaebenishidare, Nemaguard와 Tsukuba No.7는 PCA결과와 마찬가지로 유연관계가 높았지만, BY94P6050 OP2와 Tzim Pee Tao는 다른 결과를 나타냈다. Heiligoutao와 Heiligoutao (Sup)는 동일한 유연관계를 나타냈다. 이상의 결과 들을 통해 HCA dendrogram에서 대목 복숭아의 유전적 유사성 을 확인 할 수 있었다.
기존 보고에서는 대목 복숭아와 야생 복숭아의 유전적 유사도 가 0.370~0.978로 나타났고, 수집 지역에 따른 유전적 다양성이 낮은 것으로 확인되었다(Cho et al. 2012). FT-IR 스펙트럼 분석 을 이용하여 genomic DNA 수준에서 야생 복숭아와 대목 복숭아 간의 유전적 유사성을 확인한 본 연구를 통하여, 대목 복숭아 품종과 유사한 야생 복숭아 계통을 선택할 수 있어서 빠르고 정확한 복숭아 대목 계통 선발에 이용될 수 있을 것이다.
적 요
복숭아 대목 14품종과 야생 복숭아 53계통의 genomic DNA를 이용하여 FT-IR 스펙트럼을 분석하고 다변량통계분석을 수행하 였다. 핵산의 구조적 차이를 확인할 수 있는 세개의 주요 파장 범위(1,750-1,600 cm-1, 1,550-1,400 cm-1, 1,100-950 cm-1)에서 FT-IR 스펙트럼의 차이를 확인할 수 있었다. 이를 통해 야생 및 대목 복숭아의 DNA의 구조적 차이 및 유전정보의 차이가 있음을 알 수 있었다. 주성분분석(PCA)과 부분최소제곱분류법 (PLS-DA)을 통해 대목 품종들이 세개의 그룹으로 분류되는 것을 확인하였고, 야생 복숭아 계통도 유사한 패턴으로 분포하였다.
이러한 결과는 복숭아 대목 육종 과정에서 우수 대목 계통 선발 시 유용하게 적용될 것으로 판단된다.
사 사
본 연구는 농촌진흥청 연구사업(세부과제번호: PJ01272501) 의 지원에 의해 수행하였습니다.
REFERENCES