54
Trends in the Gender and Age-specific Mortality among Adults with Type 2 Diabetes Mellitus in Korea between 2009 and 2012
Won-Chang Lee, Ph.D.1, Hyeong-Ae Bang, Ph.D.2, Myeong-Jin Lee, Ph.D.3, Won-Hak Kim, M.D.4, Young Hwan Kwon, M.D.5
1Public Health in College of Veterinary Medicine, Konkuk University, Seoul, Korea, 2The Korea Public Health Association,
3Public Health in Department of Health and Nutrition, Otemae University, Osaka, Japan, 4Department of Nephrology, Asan Medical Center, Ulsan University, 5Aeromedical Center, Korean Air, Seoul, Korea
The objective of this study was to study the epidemiological trends in the gender and age-specific mortality of type 2 diabetes mellitus (T2DM) among adults in Korea between 2009 and 2012. Raw data were obtained from the website of “the Mortality of Diabetes” of Annual Report on the Cause of Death Statistic between 2009 and 2012 managed by the Korea Statistics promotion Institute (KSPI). There were a total of 6,239 nationwide case-fatalities (CF) with T2DM a mortality rate (MR) of 20.3 per 100,000 populations in 2009, and a total of 8,132 CF with a MR of 24.5 in 2012; the MR of T2DM increased (P<0.01).
Moreover, the MR per 100,000 in both male and female had significantly increased in T2DM from 2009 (male: 21.3 vs. Female: 19.2) to 2012 (male: 25.6 vs. female: 23.4), respectively (P<0.01). The distribution of the MR with T2DM by age-specific groups was the higher in the age group of over 70 years old group that clearly showed higher occurrences both in 2009 and 2012. We expect to observe trends in the mortality of T2DM until the key (E11.0∼E11.9) of ICD are present for long enough in our society, at which point we would except to start observing a more gradual increase mortality of T2DM in Korea.
Key words: Epidemiology, T2DM, Case-fatalities, Mortality rate, ICD
Received: May 11, 2016, Accepted: May 25, 2016
Correspondence: Young Hwan Kwon, Aeromedical Center, Korean Air, 260 Haneul-gil, Gangseo-gu, Seoul 07505, Korea Tel: 82-2-2656-7150, Fax: 82-2-2656-3848 E-mail: [email protected]
I. INTRODUCTION
People with diabetes are an increasing global public health problem. The increased prevalence is likely attributable to rapid economic development, improved living standards, an aging, urbanization, and an increasing prevalence of obesity and physical inactivity [1,2]. Especially, Type 2 diabetes mellitus (T2DM:
non-insulin-dependent) of diabetes and its complications have become a major cause of morbidity and mortality in Korea [2-4].
In addition, diabetes is still the fifth leading cause of death in Korea in the last decade [2,4,5]. Moreover, T2DM complications as stated by the International Classification Diseases (ICD-10) [6]
such as with coma (E11.0), ketoacidosis (E11.1), renal (E11.2), ophthalmic (E11.3), neurological (E11.4), peripheral circulatory
(E11.5), other specified (E11.6), multiple (E11.7), unspecified (E11.8) and without complications (E11.9) are associated with increased medical costs and reduced life expectancy.
In the present a limitation of the study is that we investigated epidemiological trends in the mortality of T2DM among adults by the ICD-10 (WHO) in Korea between 2009 and 2012, in order to stimulate future strategies for improving public health epidemiology.
II. MATERIALS AND METHODS 1. Data
In order to analyze epidemic trends in the mortality of T2DM among adults (over the age of 30 whose death certificates) in Korea between the years of 2009 and 2012, we used raw data of T2DM obtained from the Korea Health Statistics: Korean National Health and Nutritional Examination Survey (KNHAN V-3, 2012) by the Korea Center for Disease Control and Prevention (KCDC) [3], and Korea Statistics Promotion Institute (KSPI)
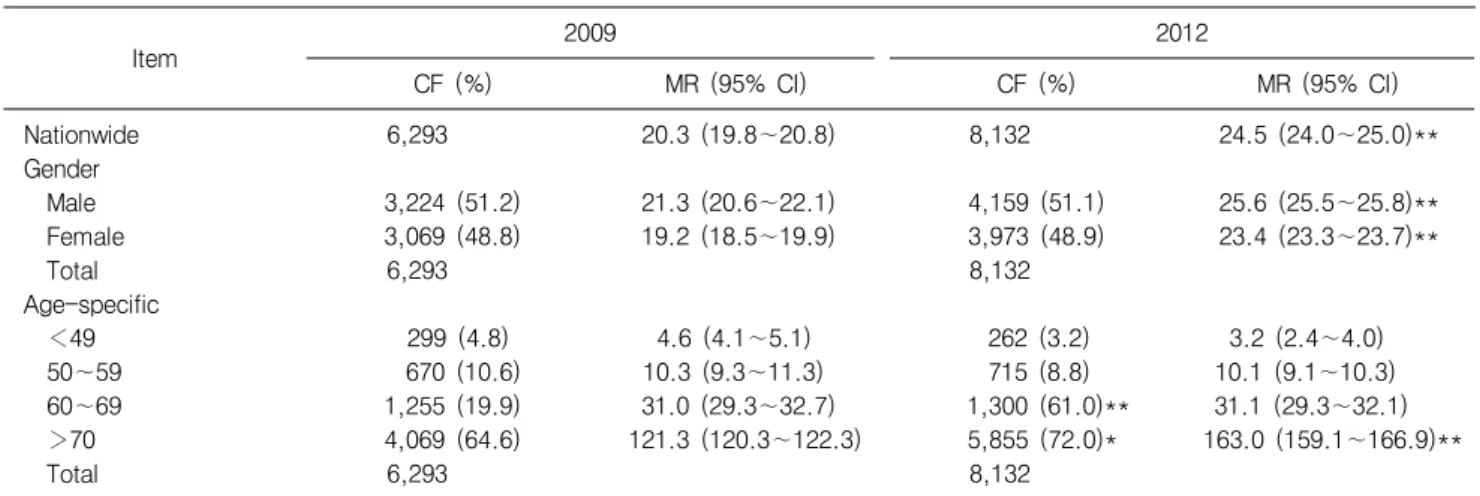
Table 1. Trends in case-fatalities and mortality rates among adults with type 2 diabetes mellitus (T2DM) in Korea between 2009 and 2012
Item 2009 2012
CF (%) MR (95% CI) CF (%) MR (95% CI)
Nationwide 6,293 20.3 (19.8∼20.8) 8,132 24.5 (24.0∼25.0)**
Gender
Male 3,224 (51.2) 21.3 (20.6∼22.1) 4,159 (51.1) 25.6 (25.5∼25.8)**
Female 3,069 (48.8) 19.2 (18.5∼19.9) 3,973 (48.9) 23.4 (23.3∼23.7)**
Total 6,293 8,132
Age-specific
<49 299 (4.8) 4.6 (4.1∼5.1) 262 (3.2) 3.2 (2.4∼4.0)
50∼59 670 (10.6) 10.3 (9.3∼11.3) 715 (8.8) 10.1 (9.1∼10.3)
60∼69 1,255 (19.9) 31.0 (29.3∼32.7) 1,300 (61.0)** 31.1 (29.3∼32.1)
>70 4,069 (64.6) 121.3 (120.3∼122.3) 5,855 (72.0)* 163.0 (159.1∼166.9)**
Total 6,293 8,132
CF: case-fatalities (%), MR: mortality rate per 100,000 populations, 95% CI: confident interval of 95%. Statistically significant levels were set at *P<0.05 and **P<0.01.
(2009∼2012): Diabetes. Annual Statistics Report on the Cause of Death, Statistic Korea, 2009 and 2012 [4]. The cases of T2DM in KSPI were classified according to the International classification of diseases, tenth revision (ICD-10,WHO). The code used for E11.0-E11.9: T2DM is as follows; E11.0: with coma, E11.1: with ketoacidosis, E11.2: with renal complications, E11.3: with ophthalmic complications, E11.4: with neurological complications, E11.5: with peripheral circulatory complications, E11.6: with other specified complications, E11.7: with multiple Complications, E11.8: with unspecified complications and E11.9: without complications,, respectively [6].
2. Statistical analysis
In this study, the case-fatalities (CF) per cent, and the mortality rate (MR) per 100,000 populations were estimated using the criteria established by the WHO, and the upper and lower limits of 95% confidence interval (CI) were calculated. Statistically significant differences between the epidemiological aspects and risk factors were determined using the Chi-square test or paired t-test, and the data analyses were performed using Excel 2007 statistical software (Microsoft Corp., Redmond, WA, USA). Statistically significant levels were at *P<0.05 and **P<0.01.
III. RESULTS
Trends in CF and MR of T2DM (Codes: E11.0∼E11.9 of ICD) in Korea between 2009 and 2012 were compared by nationwide, gender and age-specific groups as shown in Table 1. There were
a total of 6,239 nationwide deaths with T2DM a MR 20.3 per 100,000 populations in 2009, and a total of 8,132 nationwide CF with a MR of 24.5 in 2012; the MR of T2DM increased (P<0.01).
In addition, males had slightly increased MR of T2DM in both 2009 (21.3 per 100,000) and 2012 (25.6 per 100,000) than females in both (19.2 per 100,000) and 2012 (23.4 per 100,000), respectively.
The distribution of the MR with T2DM by age groups in 2009 was as follows: in the in the age-specific groups of under the 49 (30 to 49), 50∼59, 60∼69 and over 70 years, the MR of T2DM were 4.6, 10.3, 31.0 and 121.3 per 100,000 populations, respectively, and the MR of T2DM by age groups in 2012 were 3.2, 10.1, 31.1 and 163.1 per 100,000 populations, respectively, (P<0.01).
Moreover, the MR of T2DM was the highest in the age-specific group of over 70 years, and clearly showed higher occurrence in 2012 than in 2009 (P<0.01).
Mortality trends in the distribution rate (%) of CF and MR (per 100,000 per population) of the most mortality type of T2DM were compared with respect to ten key (Codes by ICD) classifications of International Classification of Diseases (WHO; ICD-10 Version:
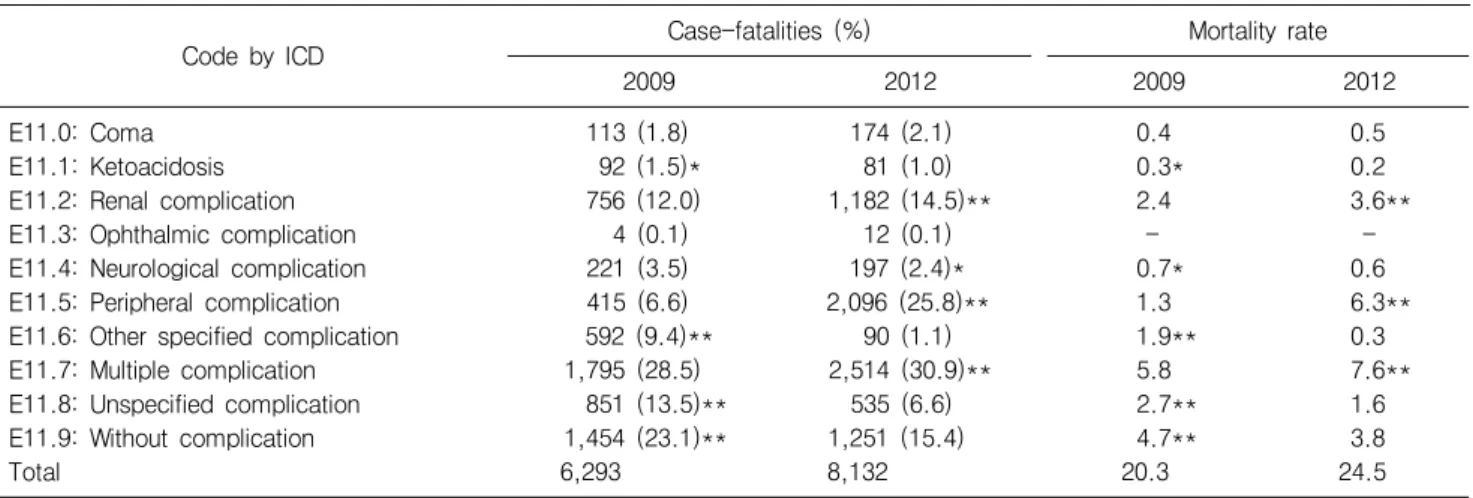
2015). As shown in Table 2 and Fig. 1, a total of 6,293 FC and 20.3 MR of T2DM in 2009 were analyzed; E11.0 (with coma:
1.8% of total CF & 0.4 of MR), E11.1 (ketoacidosis: 1.5% & 0.3 MR), E11.2 (renal complication: 12.0% & 2.4 MR), E11.3 (ophthalmic complication: 0.1% & 0.0 MR), E11.4 (neurological complication:
3.5% & 0.7 MR), E11.5 (peripheral circulatory: 6.6% & 1.3 MR), E11.6 (other specified: 9.4% & 1.9 MR), E11.7 (multiple com- plications: 28.5% & 5.8 MR), E11.8 (unspecified: 13.5% & 2.7 MR) and E11.9 (without complications: 23.1% & 4.7 MR), respectively, In 2012, a total of 8,132 CF & 24.5 MR of T2DM were observed: E11.0 (2.1% & 0.5 MR), E11.1 (1.0% & 0.2 MR),
Table 2. Trends in case-fatalities and mortality rates among adults with T2DM by the ICD (codes: E11.0∼E11.9) in Korea between 2009 and 2012
Code by ICD Case-fatalities (%) Mortality rate
2009 2012 2009 2012
E11.0: Coma 113 (1.8) 174 (2.1) 0.4 0.5
E11.1: Ketoacidosis 92 (1.5)* 81 (1.0) 0.3* 0.2
E11.2: Renal complication 756 (12.0) 1,182 (14.5)** 2.4 3.6**
E11.3: Ophthalmic complication 4 (0.1) 12 (0.1) - -
E11.4: Neurological complication 221 (3.5) 197 (2.4)* 0.7* 0.6
E11.5: Peripheral complication 415 (6.6) 2,096 (25.8)** 1.3 6.3**
E11.6: Other specified complication 592 (9.4)** 90 (1.1) 1.9** 0.3
E11.7: Multiple complication 1,795 (28.5) 2,514 (30.9)** 5.8 7.6**
E11.8: Unspecified complication 851 (13.5)** 535 (6.6) 2.7** 1.6
E11.9: Without complication 1,454 (23.1)** 1,251 (15.4) 4.7** 3.8
Total 6,293 8,132 20.3 24.5
MR: mortality rate per 100,000 populations. Statistically significant levels set at *P<0.05 and **P<0.01.
Fig. 1. Trends in the mortality rates among adults with T2DM by the ICD (codes: E11.0∼E11.9) in Korea between 2009 and 2012.
E11.2 (14.5% & 3.6 MR), E11.3 (0.1% & 0.0 MR), E11.4 (2.4%
& 0.6 MR), E11.5 (25.8% & 6.3 MR), E11.6 (1.1% & 0.3 MR), E11.7 (30.9% and 7.6 MR), E11.8 (6.6% & 1.6 MR) and E11.9 (15.4% & 3.8 MR), respectively (P<0.01).
Table 2 also show the changes of CF and MR between 2009 and 2012; with coma (+0.3% & +0.1 MR), renal (+2.5% &
+1.2 MR), peripheral circulatory (+19.2% & +5.0 MR) and multiple complications (+2.4% & +1.8 MR) were increased, while with ketoacidosis (−0.5% & −0.1 MR), other specified (−8.3% & −1.6 MR), unspecified (−6.9% & −1.1 MR) and without complications (−7.7% & −0.9 MR) were decreases, respectively (P<0.05∼P<0.01).
Comparative observation of trends in the distribution rate of case-fatalities among adults with T2DM (ICD) by gender in Korea between 2009 and 2012 was analyzed and shown in Table 3. The changes in rate (%) of CF in men between 2009 and 2012; renal (+2.0%), peripheral circulatory (+17.8%) and multiple (+2.4%)
complications were increased, while other specific (−8.4%), unspecified (−7.0%) and without (−6.2%) complications were decreased (P<0.05∼P<0.01). In the case of women: renal (+
3.0%), neurologic (+1.7%), peripheral circulatory (+20.6%), and multiple (+2.4%) complications were increased, while other specific (−8.3%), unspecified (−6.9%) and without (−92%) complications were decreased respectively (P<0.05∼P<0.01).
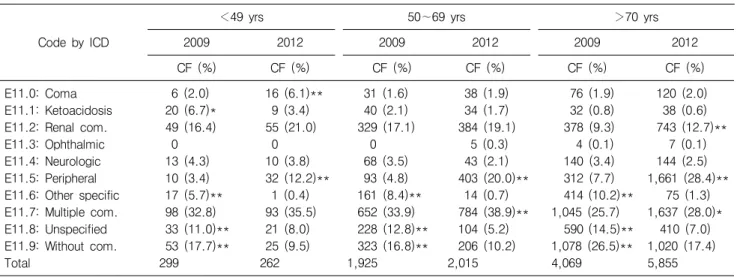
Trends in the proportionality of CF among adults with T2DM (ICD) by age-specific groups in Korea between 2009 and 2012 were shown in Table 4. The changes rate (%) of FC in under the 49 (30∼49) years-old persons between 2009 and 2012; with coma (4.1%) and peripheral circulatory (+8.8%) complications were increased, while ketoacidosis (−3.3%), other specified (−2.8), unspecified (−3.0%) and without (−8.2%) complications were decreased (P<0.05∼P<0.01), and in the case of 50∼69 years old persons: peripheral (+15.2%) and multiple (+5.0%) com- plications were increased, while other specified (−7.7%), uns- pecified (−10.3%) and without (−6.6%) complications were decreased. In addition, over 70 years old persons compared between 2009 and 2012 were as follows: renal (+3.4%), peripheral circulatory (+20.7%) and multiple (+2.3%) were increased, while other specified (−8.9%), unspecified (−7.5%) and without (−9.1%) were deceased, respectively (P<0.05∼P<0.01).
IV. DISCUSSION
Over the past three decades in Korea, a trend in the leading causes of death was declined [5]. However, diabetes is still increasing up to now [2-4], while increased morbidity and mortality is likely
Table 3. Trends in the distribution rate of case-fatalities among adults with T2DM (ICD) by gender in Korea between 2009 and 2012
Code by ICD
Male Female
2009 2012 2009 2012
CF (%) CF (%) CF (%) CF (%)
E11.0: Coma 52 (1.6) 85 (2.0) 61 (2.0) 89 (2.2)
E11.1: Ketoacidosis 59 (1.8) 49 (1.2) 33 (1.1) 32 (0.8)
E11.2: Renal complication 409 (12.7) 612 (14.7)** 347 (11.3) 570 (14.3)**
E11.3: Ophthalmic complication 2 (0.1) 6 (0.1) 2 (0.1) 6 (0.2)
E11.4: Neurological complication 100 (3.1) 111 (2.7) 121 (3.9) 86 (2.2)*
E11.5: Peripheral complication 225 (7.0) 1,031 (24.8)** 190 (6.2) 1,065 (26.8)**
E11.6: Other specified complication 299 (9.3)** 39 (0.9) 293 (9.6)** 51 (1.3)
E11.7: Multiple complication 998 (30.9) 1,384 (33.3)* 797 (26.0) 1,130 (28.4)*
E11.8: Unspecified complication 428 (13.3)** 261 (6.3) 423 (13.8)** 274 (6.9)
E11.9: Without complication 652 (20.2)** 581 (14.0) 802 (26.1)** 670 (16.9)
Total 3,224 4,159 3,069 3,973
Footnotes are in Table 2.
attributable due to rapid economic development, improved living standards, aging, urbanization, and increasing prevalence of obesity and physical inactivity [1,2]. Especially, the morbidity of T2Dm is increasing globally and the International Diabetes Federation has predicted that the number of people with diabetes will increase from 366 million to 552 million by 2030 [1,7].
In the case of Korea, the total CF and MR of T2DM in 2012 increased compared to those in 2009 are shown in Table 1 (P<0.01).
In addition, the MR of T2DM of men was slightly higher than that of women; the latter are statistically not at a significant level.
The remarkable difference of CF and MR of T2DM in gender is believed to be due to differences between men and women in terms of lifestyle between the sexes. For example, T2DM showed a pronounced female excess in the first half of the century but is now equally prevalent among men and women in most popu- lations, with some evidence of male preponderance in early middle age [8]. Recently data have also shown that men develop diabetes at a lower degree of obesity than women a finding which adds support to the view that the pathogenesis of T2DM differs between men and women. Observation of sex differences in body fat distribution, insulin resistance, sex hormones, and blood glucose levels further support this notion [1,5,9,10]. Moreover, in this study, the percentage distribution of the CF and MR of T2DM in the over 70 year’s age group was the highest in all age groups between 2009 and 2012. The remarkable differences of CF and MR in older aged are believes to be due to differences that seems to blur almost imperceptibly into the large mass of elderly patients with non-immune diabetes [8]. For example, in the United States in 2011, 63% of the adults (aged 10∼79) with incident cases of
diabetes were diagnosed between the ages of 40 and 64 years.
About 16% were diagnosed at 18∼39 years, and about 21% were diagnosed at 65∼79 years [11].
Trends in CF and MR among adults with T2DM by ICD (Codes: E11.0∼E11.9) in Korea are shown in Table 2 and Fig. 1, the changes from 2009 to 2012 are as follows; T2DM E11.0: with coma, E11.2: with renal complications, E11.5: with peripheral circulatory complications and E11.7: with multiple complications were tended to increased in 2012 than those in 2009, while T2DN E11.1: with ketoacidosis, E11.6: with other specified complications and E11.8: unspecified complications were decreased in 2012.
These changes in the pattern of prevalent data strongly indicate that is likely attributed to rapid economic development, improved living standards, and aging population, and with increasing obesity [1,2,11-13]. On the other hand, comparative observation of trends in distribution rate (%) of CF among adults with T2DM by gender between 2009 and 2012 was analyzed and changes in men are shown Table 3 was follows; E11.2: with renal, E11.5: peripheral circulatory and E11.7: multiple complications were increased in 2012 than those in 2009, while E11.6: other specific, unspecified and E11.9: without complications were decreased. In the case of women; E11.2: renal, E11.4: neurologic, E11.5: peripheral circulatory and E11.7: multiple complications were increased in 2012 than those in 2009, while E11.5: other specific, E11.8: unspecified and E11.9: without complications were decreased, respectively. The remarkable changes in the rate of CF of T2DM in gender are believed to be due to difference between the sex [1,2,8-13]. For example, a report stated that men seem more susceptible than women to the consequences of indolence and obesity, possibly due
Table 4. Trends in the distribution rate of case-fatalities among adults with T2DM (ICD) by age-specific groups in Korea between 2009 and 2012
Code by ICD
<49 yrs 50∼69 yrs >70 yrs
2009 2012 2009 2012 2009 2012
CF (%) CF (%) CF (%) CF (%) CF (%) CF (%)
E11.0: Coma 6 (2.0) 16 (6.1)** 31 (1.6) 38 (1.9) 76 (1.9) 120 (2.0)
E11.1: Ketoacidosis 20 (6.7)* 9 (3.4) 40 (2.1) 34 (1.7) 32 (0.8) 38 (0.6)
E11.2: Renal com. 49 (16.4) 55 (21.0) 329 (17.1) 384 (19.1) 378 (9.3) 743 (12.7)**
E11.3: Ophthalmic 0 0 0 5 (0.3) 4 (0.1) 7 (0.1)
E11.4: Neurologic 13 (4.3) 10 (3.8) 68 (3.5) 43 (2.1) 140 (3.4) 144 (2.5)
E11.5: Peripheral 10 (3.4) 32 (12.2)** 93 (4.8) 403 (20.0)** 312 (7.7) 1,661 (28.4)**
E11.6: Other specific 17 (5.7)** 1 (0.4) 161 (8.4)** 14 (0.7) 414 (10.2)** 75 (1.3) E11.7: Multiple com. 98 (32.8) 93 (35.5) 652 (33.9) 784 (38.9)** 1,045 (25.7) 1,637 (28.0)*
E11.8: Unspecified 33 (11.0)** 21 (8.0) 228 (12.8)** 104 (5.2) 590 (14.5)** 410 (7.0) E11.9: Without com. 53 (17.7)** 25 (9.5) 323 (16.8)** 206 (10.2) 1,078 (26.5)** 1,020 (17.4)
Total 299 262 1,925 2,015 4,069 5,855
Footnotes are in Table 2.
to differences in insulin sensitivity and regional fat deposition.
Women are, however, more likely to transmit T2DM to their offspring [8]. Additionally, comparative observation of trends in distribution rate (%) of CF among adults with T2DM by age-specific groups between 2009 and 2012 was analyzed and changes in men shown Table 4. The changes in the rate (%) of CF in under the 49 age group from 2009 to 2012 were as follows; E11.0: with coma, and E11.5: peripheral circulatory complications were increased, while E11.1: ketoacidosis, E11.6: other specified, E11.8: unspecified and E11.9: without complications were decreased, and in these of 50∼69 years group; E11.5: peripheral circulatory and E11.7:
multiple complications were increased, while E11.6: other specified, E11.8: unspecified and E11.9: without complications were decreased.
Moreover, over 70 years old persons compared between 2009 and 2012 were as followed; E11.2: with renal, E11.5: peripheral circu- latory and E11.7: multiple complication were increased in 2012 than in 2009, while E11.6: other specified, E11.8: unspecified and E11.9: without complications were decreased, respectively. The remarkable changes in the rate of CF of T2DM in age-specific groups are believed to be due to difference between age-specific are the most important demographic change to prevalent diabetes appears to be the increased proportion of people who are old-aged [1-4,13].
In the present study, it was obvious that T2DM increased significantly in 2012 (8,132 CF and 24.5 MR) compared to in 2009 (6,293 CF and 20.3 MR). Therefore, control measure should focus on the growing prevalence of T2DM. Despite much evidence that diabetes can be prevented or delayed with lifestyle changes and weight loss or certain physical and health activities to combat
with increasing obesity, and improved longevity, diabetes and prediabetes is are expected to dramatically increase more than previously projected [1,2,12,13].
In conclusion, as T2DM is one of the most severe and relative common chronic diseases in worldwide including Korea, more efforts should be made towards prevention through raising awareness of the risk of diabetes. Because of its rapid aggravation and increasing prevalence with high CF and MR, public health education about diabetes is strongly recommended for avoiding diabetes. In the present study, we provided useful quantitative cross-section analysis of recent epidemiological trends in the mortality of T2DM among adults in Korea between 2009 and 2012. It is our hope that this information would be a useful reference for the further studies of diabetes in the field of public health and epidemiology.
REFERENCES
1. Wild S, Roglic G, Green A, Sicree R, King H. Global Prevalence of Diabetes: estimates for the year 2000 and projections for 2030.
Diabetes Care. 2004;27:1047-1053.
2. Kim DJ. Review. The Epidemiology of Diabetes in Korea. Diabetes Metab. J. 2011;35:303-308.
3. Korea Center for Disease Control and Prevention (KCDC) (2012): Korea Health Statistics: Korea National Health and Nutri- tional Examination Survey (KNHAN V-3) 2012. Available at http://www.cdc.go.kr/ (in Korean).
4. Korea Statistics Promotion Institute (KSPI) (2009-2012):
Diabetes. Annual Report on the Cause of Death Statistics, Statistic Korea, 2009 and 2012. (in Korea). Available at http:// www.stat.or.kr/
5. Lim D, Ha M, Song I. Trends in the leading causes of death in Korea, 1983-2012. J. Korean Med. Sci. 2014;29:1597-1603.
6. World Health Organization (WHO) (2015): International Classi- fication of Diseases, Reversion (ICD-10)-WHO, 2014.
7. Goto A, Goto G, Noda M, Tsugane S. (2013): Incidence of Type 2 Diabetes in Japan: A Systematic Review and Meta-Analysis. PLOS ONE, Vol.8. Issue 9/ e74699. Available at http://www.plosne.org/
8. Gale EAM, Gillespie KM. Diabetes and gender. Diabetologia, 2001;44:3-15.
9. Kristine F. (2014): Gender and T2DM [internet]. Diapedia, rev.
no. 10. Available at http://dx.doi.org/10.14496/dia.3104972816.10 10. Green EB, Shen W. Gender differences in insulin resistance, body
composition, energy balance. Gend Med 2009;6:60-75.
11. Center for Disease Control and Prevention (CDC) (2015):
Distribution of Age at Diagnosis of Diabetes among Adults Incidence Cases Aged 18-79 Years, United State, 2011. CDC 24/7: Saving Lives.
Protecting People. Available at http://www.cdc.gov/diabetes/statistics/
age/fig1.htm
12. Cho MH. The Epidemiology of Diabetes in Korea: From the Economics to Genetics. Korean Diabetes J. 2010;34:10-15.
13. World Health Organization (WHO) (2015): Diabetes, Media Centre, Fact Sheet No 312. Geneva, WHO, 2015. Available at http://www.who.int/mediacentre/factsheets/fs312/en/
=국문초록=
제2형 당뇨병은 한국뿐 아니라 전세계적으로 가장 흔하고 심각한 만성 질환이다. 2014년항공신체검사 결과를 보면 항공종사자의 약 7%가 당뇨병을 가지고 있다. 본 연구는 2009년과 2012년에 한국인 성인에서 제2형 당뇨병의 성 별, 나이별 사망률의 역학적 추세를 보기 위한 것이다. 연구에 사용된 데이터는 한국통계진흥원에서 제작한 사망 원인통계연보의 당뇨병 사망률 자료를 활용하였다. 2009년 제2형 당뇨병 총 사망자는 6,239명이고 사망률은 100,000명 당 20.3명이다. 2012년 제2형 당뇨병 총 사망자는 8,132명이고 사망률은 100,000명 당 24.5명으로 통계적 으로 유의하게 증가하였다(P<0.01). 결론적으로 한국에서 제2형 당뇨병 사망률은 점차 증가하고 있으며 당뇨병이 있는 항공종사자 건강관리 시 주의를 요한다.
중심단어: 역학, 제2형 당뇨병, 치사율, 사망률, 국제질병분류