※ This work was supported by the National Research Foundation of Korea Grant funded by the Korean Government (NRF-2014S1A5A2A01015106).
†교신저자:Hyunjoo Song (Department of Psychotherapy, Seoul Women's University) E-mail:[email protected]
TEL:02-970-5888 FAX:02-970-5167
Characteristics of Visuo-Spatial Information Processing in Children with Autism Spectrum Disorder
Mee-Kyoung Kwon*․Hee-Jung Chung**․Hyunjoo Song***†
*Division of General Studies, Ulsan National Institute of Science and Technology
**Department of Pediatrics, National Health Insurance Service Ilsan Hospital
***Department of Psychotherapy, Seoul Women's University
Abstract
Although atypical sensory processing is a core feature of autism spectrum disorder (ASD), there is considerable heterogeneity among ASD individuals in the modality and symptoms of atypical sensory processing. The present study examined visual processing of children with ASD, focusing on the complexity and orientation of visual information. Age- and -IQ-matched Korean children (14 ASD and 14 typically-developing (TD) children) received an orientation discrimination task involving static spatial gratings varied in complexity (simple versus complex) and orientation (horizontal versus vertical). The results revealed that ASD children had difficulty perceiving complex information regardless of orientation, whereas TD children had more difficulty with vertical gratings than horizontal gratings. Thus, group-level differences between ASD and TD children appeared greater when gratings were presented horizontally. Unlike ASD adult literature, however, ASD children did not show superior performance on simple gratings. Our findings on typical and atypical processing of ASD children have implications for both understanding the characteristics of ASD children and developing diagnostic tools for ASD.
Key words: Autism Spectrum Disorder, Atypical Sensory Processing, Complexity-Specific Hypothesis, Vision
1. Introduction
Autism spectrum disorder (ASD) is a complex neurodevelopmental disorder. In addition to social and communication impairments and restricted interests and repetitive behaviors, individuals with ASD show atypical sensory processing (American Psychiatric Association, 2013). However, there is considerable heterogeneity
among ASD individuals in the modality (e.g., vision, audition, or touch), direction (e.g., superior or impaired performance compared to non-ASD individuals), and symptom (e.g., impaired or enhanced low-level visual discrimination, impaired mid-level or high-level visual discrimination, etc.) of atypical sensory processing (for review, see Marco et al., 2011; Waterhouse et al., 2016).
Understanding characteristics of atypical sensory
<연구논문> Sci. Emot. Sensib.,
Vol.21, No.2, pp.125-136, 2018 https://doi.org/10.14695/KJSOS.2018.21.2.125
processing of ASD, therefore, would be critically important not only for research purposes but also for developing diagnostic tools or treatments for ASD. The present study focuses on the characteristics of low-level visuo-spatial information processing in school-aged ASD children.
2. Atypical Visual Processing
2.1. Complexity-Specific Hypothesis
An explanation for this atypical visual processing is the complexity-specific hypothesis. According to the complexity-specific hypothesis, individuals with ASD are particularly impaired with complex (also called second- order or texture-defined) information, whereas their sensitivity to simple (also called first-order or luminance- defined) information is intact (Bertone & Faubert, 2006;
Bertone et al., 2003; 2005). The original studies (Bertone et al., 2003; 2005) focused on adults and demonstrated that when asked to discriminate the orientation (horizontal or vertical) of a given spatial grating, adults with ASD had difficulty with complex spatial gratings compared to normal adults, regardless of whether the gratings moved or were static. In contrast, ASD adults’ sensitivity to simple gratings was either intact (with dynamic motion, Bertone et al., 2003) or even superior (with static stimuli, Bertone et al., 2005; but also see Meilleur et al., 2014 for no group differences with static stimuli). Bertone and his colleagues proposed that ASD adults’ impaired processing of complex visual information and intact processing of simple visual information are related to distinguished brain areas processing information with different levels of complexity. ASD adults’ atypical brain processing was also supported by brain studies (Dumoulin et al., 2003;
Ellemberg et al., 2003; Vandenbroucke et al., 2008).
2.2. Studies of Children with ASD
Unlike adult literature, however, little has been known about whether children with ASD also show difficulty
in processing complex visual information. A recent study (Rivest et al., 2013) tested the complexity-specific hypothesis with 6-to-11-year-old children with ASD and found mixed results. At brain-level, their findings supported the complexity-specific hypothesis by showing that unlike typically developing (TD) children, ASD children did not show reliable enhancements of brain activity in response to complex static gratings relative to simple static gratings. However, this atypical processing for complex static gratings was not observed at a behavioral level in the same test session. Moreover, the superior performance on simple static gratings found in ASD adults (Bertone et al., 2005) was not observed in ASD children, either.
Taken together, although children's literature has provided partial evidence to support the complexity- specific hypothesis, it is not clear whether children with ASD show atypical processing of complex information at the behavioral level and/or have superior/intact processing of simple information that was reported in adult literature. Examining this question would provide useful information for both research and clinical purposes, considering the fact that clinical diagnosis and treatments of ASD are mostly made based on behavioral characteristics.
3. Factors to Consider for Studies with ASD Children
There are a couple of factors needed to be considered to examine visual processing of children with ASD. First, prior studies on typically developing (TD) children suggest that there are developmental changes in visual processing (Armstrong et al., 2009; Bertone et al., 2008;
Ellemberg et al., 2003; Parrish et al., 2005) and differential developmental changes for processing simple and complex visual information (Bertone et al., 2008;
Ellemberg et al., 2003). For example, Bertone et al.
(2008) found that the maturation of a visual mechanism
mediating complex (texture-defined) information continued to adolescence, whereas the sensitivity to simple (luminance-defined) information approached adult levels by 12 years of age. Even though these studies tested TD children alone, the characteristics of visual processing in ASD children could also be different from those in adults with ASD.
Another possible factor related to visual perception of children with ASD is their sensitivity to object orientation. Many studies using simple stimuli in various orientations showed that individuals with ASD demonstrate atypical processing for particular orientations, although the orientations with atypical processing were varied across studies. For example, some studies reported that ASD children showed an inferior ability to detect a vertical bar over Gaussian noise (Sanchez- Marin & Padilla-Medina, 2008) or impaired orientation discrimination ability along vertical axes (Sysoeva et al., 2015). In contrast, another children’s study (Wilkes et al., 2015) reported that children with ASD showed greater phase lag during vertical smooth pursuit.
Adult literature also provides inconsistent findings. For instance, a study on normal adults alone (Gottsdanker
& Tietz, 1992) showed that when asked to discriminate line lengths, reaction times for horizontal lines were faster than reaction times for vertical lines. Two studies on ASD adults’ sensitivity to spatial contrast also reported different results potentially depending on the orientation of spatial gratings. A study using horizontal gratings (Koh et al., 2010) reported no differences of performance between the ASD and TD groups, whereas another study using vertical gratings (Keita et al., 2014) reported differences of performance between the ASD and TD groups. Taken together, despite evidence supporting the complexity-specific hypothesis from adult studies, multiple factors such as the complexity and orientation of stimuli could serve atypical visual processing of individuals with ASD.
Given potential developmental changes for processing simple and complex visual information between children and adults (Bertone et al., 2008), the effects of multiple
factors should also be examined in children with ASD as an independent study.
The present study examined the characteristics of visual information in ASD children. Consistent with Rivest et al. (2013), we tested school-aged children ASD with and compared their performance with Age-and- IQ-matched TD children. Unlike prior studies only focusing on one feature (e.g., complexity or orientation), our research attempts to examine both effects of complexity and orientation within the same experiment.
Given potential effects of the orientation of spatial gratings on the performance of ASD and/or TD individuals, we hypothesized that children with ASD would show atypical processing for complex gratings at a behavioral level, when the effect of the orientation of spatial gratings is considered in analysis.
We selected static spatial gratings as our stimuli for two reasons. First, according to literature on adults with ASD (Bertone et al., 2003; 2005) behavioral differences between ASD and non-ASD individuals are more evident with static stimuli than dynamic stimuli. With static stimuli, ASD individuals show superior sensitivity to simple visual information and lower sensitivity to complex visual information compared to non-ASD individuals (Bertone et al., 2005). In contrast, with dynamic stimuli, ASD individuals show intact sensitivity to simple visual information, although their sensitivity to complex visual information is lower than that of non-ASD individuals (Bertone et al., 2003). Second, atypical visual processing for static stimuli was not observed in a recent study in children with ASD (Rivest et al., 2013) at the behavioral level, despite some evidence at the brain level. Given these inconsistent findings, we thought static stimuli would uncover developmental differences in visual processing between childhood and adulthood if they do exist. Given the results from literature on the heterogeneity among ASD individuals in atypical sensory processing (Marco et al., 2011; Waterhouse et al., 2016), we, thus, examined individual differences within ASD children, as well as group-level differences between ASD and TD children.
4. Method
4.1. Participants
Participants were 14 children with ASD (13 boys;
mean age=8.41 year; SD=1.70, range=6.0 to 12.05) and 14 TD children (12 boys; 8.13 year; SD=1.46, range=6.0 to 10.09, Mann–Whitney U=95, Z=.115, p=.910 for the comparison of the mean ages of the two groups) whose primary language was Korean and who did not have known vision or hearing problems. The mean age of each group did not differ across the two groups (Mann–
Whitney U=72, Z=.299, p=.764), when only boys were included in the analysis. Written informed consent was obtained from a parent of each child.
Before receiving our experimental task, each child received a diagnosis by a pediatrician or / psychiatrist at a children’s hospital or psychiatric office. Diagnosis was conducted using either childhood autism rating scale (CARS, Chlebowski et al., 2010) (cutoff=30) or childhood autism screening test (CAST, Allison et al., 2007) (cutoff=15) with Korean Wechsler Intelligence Scale for Children-third or fourth Edition (K-WISC-III, Kwak et al., 2001, or K-WISC-IV, Kwak et al., 2011) as well as additional developmental/clinical tests as decided by the pediatrician/psychiatrist.
Since different institutions used different versions of WISC test or different rating scales, our research team assessed general intelligence of all participants again by using K-WISC-IV and reported the results in this paper.
Every child had a total (full-scaled) IQ score above 73 and there was no significant group difference in total IQ score (for the ASD group, mean=90.14, SD=14.33;
for the TD group, mean=97.07, SD=10.90, p=.164).
4.2. Orientation-Identification Test
4.2.1. Stimuli
To test children’s ability to discriminate simple and complex visual information, we adapted a static version
of Bertone et al.’s (2005) orientation-identification task.
In this task, either a set of simple or complex static gratings were presented on a monitor of LG IBM laptop (14 inch, 1152 × 870 pixels, 75 Hz refresh rate) either horizontally or vertically. All static spatial gratings were 0.75 cycle per degree (c/deg) presented within a circular area subtending 10o at a viewing distance of 57 cm. Our simple and complex stimuli, their Lmin and Lmax values and the mean luminance of the background, were identical to those used in Bertone et al.’s (2005), except that we only used 3 out of their 6 modulation levels for each of the simple and complex conditions (see Bertone et al., 2005 for details on stimuli and mathematical formula) to decrease the number of total trials. For simple stimuli 0.10, 0.035, and 0.0125 luminance modulation levels were selected and for complex stimuli 1.0, 0.250, and 0.067 contrast modulation levels were selected. Each modulation level was used for 6 trials during the main test session and the order of each trial was randomized by a computer program within a participant. Gamma correction was performed once before the testing session to minimize the nonlinearities in the display. All stimuli were created, presented and controlled by using MATLAB (www.mathworks.com) and Psychophysics toolbox (Brainard, 1997).
4.2.2. Procedure
To minimize the fatigue effect after taking the IQ test, the orientation-identification task was given on the second day. Each child was tested individually in a quiet room and was asked to report the orientation (horizontal or vertical) of each grating set presented on a monitor by pressing one of the right or top arrow keys. To examine the effects of complexity, as well as orientation of spatial gratings, each set was composed of either simple or complex gratings, although the complexity of each set was not explicitly informed to the participant as consistent with Bertone et al.’s (2005) original study.
Our pilot study showed that the threshold method used
in prior studies (Bertone et al., 2003, 2005; Meilleur et al., 2014; Rivest et al., 2013) required hundreds of trials for young children to meet a 75% correct level, similar to prior study using 200 trials (Rivest et al., 2013). To minimize fatigue and practice effects, we gave every child a shorter version of the orientation-identification task with 5 practice trials followed by 36 main trials.
Instead of the threshold, we measured both mean accuracy and median reaction times which is known to reflect processing speed even when the ceiling effect exists for accuracy, and to be appropriate for the asymmetrical distribution of values, such as reaction times. The 36 trials involved 9 trials for each combination of Complexity (2: simple versus complex), Orientation (2: horizontal versus vertical), respectively, and the order of trials was randomized by our MATLAB-based computer program to minimize practice effect or adaptation effect.
5. Analysis
To examine the effect of orientation and complexity of spatial gratings, for each participant, we computed median reaction times and mean accuracy (i.e. proportion of correct trials) by the orientation and complexity of spatial gratings and used them as dependent variables for our statistical analysis. In addition, unlike prior studies (e.g., Bertone et al., 2003, 2005; Meilleur et al., 2014; Rivest et al., 2013) focusing on separate threshold values for each complexity condition, we directly quantified costs of the complexity by computing differences in reaction times and accuracy, respectively, between simple and complex conditions within each orientation (e.g., for the complexity cost in reaction times for vertical gratings, ‘reaction times for vertical gratings in the complex condition – reaction times for vertical gratings in the simple condition’). Considering large individual variations in reaction times and accuracy across participants, we expected that our complexity cost
measure would provide useful information on individuals’ difficulty with complex visual information, controlling for their baseline performance. Therefore, complexity cost scores were directly used as dependent variables for all statistical analyses of the present study, except Analysis of Variance (ANOVA) tests. To examine main and interaction effects of the complexity of gratings and group together within the same tests, we used accuracy rates and reaction times in each of the simple and complex conditions as dependent variables for ANOVA tests and indirectly quantified the amount of complexity-based costs as the main effect of the complexity of spatial gratings. We conducted a series of ANOVAs to see between- and within-group differences.
Given that prior studies using the threshold method analyzed their participants' accuracy separately across simple and complex gratings, we also provided results from simple comparisons on either simple or complex visual information by using the Mann-Whitney U test (see Table 1). In addition, we examined our complexity cost scores (in reaction times and accuracy, respectively) could serve as a valid diagnostic tool differentiating individuals with ASD from our non-ASD group by using the Receiver operating characteristic (ROC) analysis.
6. Results
6.1. Within-Group Analysis
To examine atypical processing of ASD, we need to know what is typical processing. However, little has been known about how the orientation and complexity of spatial gratings influence on performance of TD children on an orientation task. Thus, before examining group- level differences, we examined the characteristics of spatio-visual information processing within each group.
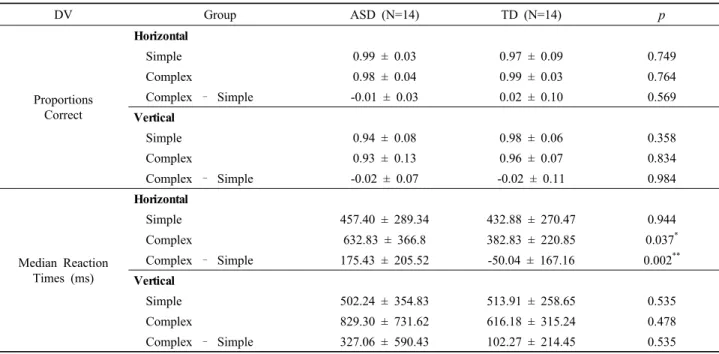
Table 1 describes mean accuracy rates, median reaction times, and standard deviations by Group, Complexity, and Orientation.
DV Group ASD (N=14) TD (N=14) p
Proportions Correct
Horizontal
Simple 0.99 ± 0.03 0.97 ± 0.09 0.749
Complex 0.98 ± 0.04 0.99 ± 0.03 0.764
Complex – Simple -0.01 ± 0.03 0.02 ± 0.10 0.569
Vertical
Simple 0.94 ± 0.08 0.98 ± 0.06 0.358
Complex 0.93 ± 0.13 0.96 ± 0.07 0.834
Complex – Simple -0.02 ± 0.07 -0.02 ± 0.11 0.984
Median Reaction Times (ms)
Horizontal
Simple 457.40 ± 289.34 432.88 ± 270.47 0.944
Complex 632.83 ± 366.8 382.83 ± 220.85 0.037*
Complex – Simple 175.43 ± 205.52 -50.04 ± 167.16 0.002**
Vertical
Simple 502.24 ± 354.83 513.91 ± 258.65 0.535
Complex 829.30 ± 731.62 616.18 ± 315.24 0.478
Complex – Simple 327.06 ± 590.43 102.27 ± 214.45 0.535
Table 1. Descriptive statistics (mean value of each group ± SD, p values from the Mann-Whitney U test, p*<.05, p**<.01) 6.1.1. Reaction Times
Different patterns of results across two groups were revealed by two separate ANOVAs on reaction times with Complexity (2: Simple vs. Complex) and Orientation (2:
Horizontal vs. Vertical) as within-subject variables.
Within the TD group, only main effect of Orientation (F(1,13)=7.44, p=.017, η2=.364) was significant, replicating superior performance on horizontally- presented gratings (Gottsdanker & Tietz, 1992). In contrast, for the ASD group, only main effect of Complexity (F(1,13)=9.63, p=.008, η2=.426) was significant, supporting ASD individuals' general difficulty in processing complex visual information.
6.1.2. Accuracy
However, when mean accuracy was used as a dependent variable instead of reaction times, none of the main or interaction effects were significant within either group (ps>.266). These null results could be attributed to the ceiling effect, as both ASD and TD children showed high performance (mean accuracies>.93) regardless of the complexity and orientation of spatial gratings (see Table 1).
6.2. Group-Level Analysis
6.2.1. Reaction Times
Given TD children’s slower responses for horizontal gratings, we conducted an ANOVA on reaction times with Complexity (2: Simple vs. Complex) and Orientation (horizontal versus vertical) as within-subject variables and Group (2: ASD vs. TD) as a between-subject variable.
Results revealed a significant interaction effect of Complexity and Group (F(1,26)=6.89, p=.014, η2=.209), indicating that costs of the complexity in reaction times were greater in the ASD group than in the TD group.
Main effects of Complexity (slower responses for complex stimuli than simple stimuli) and Orientation (slower responses for vertical stimuli than horizontal stimuli) were also significant (F(1,26)=10.45, p=.003, η2=.287 for Complexity; F(1,26)=6.66, p=.016, η2=.204 for Direction). None of the other main and interaction effects, however, were significant (ps>.126).
Two Analysis of covariance (ANCOVA) tests with Group as a between-subject variable, Complexity and Orientation as within-subject variables, and either Age or overall IQ as a covariate confirmed that the interaction effects of Complexity and Group were significant regardless of whether either Age (F(1,26)=6.96, p=.014,
'moderately accurate'
AUC = .847(.695 - .999) ‘less accurate'
AUC = .571 (.350 - .793)
(a) Horizontal Gratings (b) Vertical Gratings Fig. 1. Results from two ROC analyses
η2=.218) or overall IQ (F(1,26)=5.30, p=.030, η2=.175) was controlled for. However, the main effects of Orientation and Complexity were not robust (p=.200 for the main effect of Orientation when Age was controlled for; ps>.156 for the main effect of Complexity when either Age or overall IQ was controlled for).
Next, although the 3-way interaction effect of Complexity, Orientation and Group were not significant in any of our ANOVA/ANCOVA tests (ps>.1), potentially due to the lack of power caused by small sample size, given our research question and different results across the orientation of spatial gratings in prior studies (Gottsdanker & Tietz, 1992; Koh et al., 2010;
Keita et al., 2014), we conducted similar ANCOVA tests on reaction times for each orientation to examine whether complexity costs defined as the interaction effect of Complexity and Group are consistently observed regardless of whether either Age or IQ is controlled for. Interestingly, significant interaction effects of Complexity and Group were consistently observed only when reaction times for horizontal gratings were used as a dependent variable (F(1,26)=9.46, p=.005, η2=.274 for when Age was a covariate; (F(1,26)=8.39, p=.008, η2=.251 for when overall IQ was controlled for) and not when reaction times for vertical gratings were used as a dependent variable (ps>.168).
6.2.2. Accuracy
As shown in within-group analyses, however, when mean accuracy was used as a dependent variable instead
of median reaction time, none of the significant group- level differences were observed in either ANOVAs, ANCOVAs or simple comparisons, regardless of orientation of spatial gratings (ps>.358; see Table 1 for descriptive statistics).
6.3. ROC Analysis and Individual Differences in the Amount of Complexity-Based Cost
6.3.1. ROC Analysis
Swets’ (Swets, 1988) guidelines suggest that 0.7<AUC
≤0.9 could be considered as moderately accurate in distinguishing between distributions, 0.5<AUC≤0.7 as less accurate, and AUC=0.5 as non-informative. A series of ROC analyses revealed that the complexity costs in reaction times collapsed across two orientations (AUC=.801, 95% CI=.628 - .974) and reaction times for horizontally presented gratings alone (AUC=.847, 95%
CI=.695 - .999) met 'moderately accurate' discrimination between ASD and non-ASD cases in our sample, whereas the complexity costs in reaction times for vertically presented gratings (AUC=.571, 95% CI=.350 - .793) fell into 'less accurate' discrimination between ASD and non-ASD cases. All accuracy-based variables also showed 'less accurate' discrimination between the two groups (see Fig. 1).
6.3.2. Individual Differences
The power of the complexity-costs in reaction times for horizontally presented gratings was also consistently
(a) Horizontal Gratings (b) Vertical Gratings
Fig. 2. Individual Z scores (Mean of the TD group=1; SD of the TD group=0) of reaction times in the complexity-cost when gratings were presented horizontally (A) and vertically (B). Dots represent individual Z scores. The middle line of each box indicates a group median and both ends of each line represent (Q3 + (1.5*IQR)) and (Q1 – (1.5*IQR)) respectively, where Q1=25th percentile, Q3=75th percentile, IQR (interquartile range)=Q3- Q1
observed when we explored individual data. To see how different individual ASD children's performance was from individuals of TD children, we transformed raw values of the complexity cost scores into z scores using the mean and standard deviation of the TD group. As shown in Fig. 2, when spatial gratings were horizontally presented 71% (10 out of 14) of ASD children showed complexity cost scores of 1 or above 1 (1 standard deviation from the mean of the TD group), whereas only 21% (3 out of 14) of TD children showed complex cost scores of 1 or above 1 (χ2 (1)=7.036, p=.008). In contrast, when spatial gratings were vertically presented only 21%
(3 out of 14) of ASD children and 21% (3 out of 14) of TD children showed complex cost scores of 1 or above 1 (p=.999).
7. Discussion and Conclusions
Although atypical sensory processing is one of the major symptoms of ASD (American Psychiatric Association, 2013), there is considerable heterogeneity among ASD individuals in the modality and symptom
of the atypical sensory processing (for review, see (Marco et al., 2011; Waterhouse et al., 2016). This heterogeneity could be attributed to multiple factors underlying ASD.
Thus, examining effects of multiple factors would enhance the chance to detect atypical processing of ASD.
The present study focused on the effects of the complexity and orientation of visual stimuli in school-aged ASD children. Our study yielded three primary findings.
First, unlike a recent study of school-aged ASD children (Rivest et al., 2013), we found behavioral evidence to support the complex-specific hypothesis in childhood. ASD children in our sample identified the orientation of complex spatial gratings more slowly than simple spatial gratings, regardless of whether the gratings were presented horizontally or vertically. To our knowledge, our study is the first one reporting atypical processing of complex visual information in school-aged children with ASD at the behavioral level. The discrepancies in results between Rivest et al.’s study and our study should reflect differences in dependent variables, not differences in characteristics of ASD children. In fact, even though Rivest et al. did not find
behavioral evidence to support the complex-specific hypothesis, their ASD children did show atypical processing of complex visual stimuli at the brain-level.
One might raise a possibility that the small sample size (13 ASD children) in Rivest et al’s study caused a statistical power issue but our study showed significant group differences with similar size of ASD sample (14 ASD children). Thus, it would be reasonable to infer that their behavioral measure - accuracy-based threshold - was not sensitive enough to detect atypical visual processing of ASD children. Indeed, in our study, group-level differences were greatest when we used our unique measure, the complexity-cost scores defined as the difference in reaction times between simple and complex conditions. The same tendency was not observed from our accuracy-based measures. However, the number of trials used for each of the simple and complex conditions was not the same across the two studies (100 trials for Rivest et al.’s study versus 18 trials for the present study).
Further research controlling for the number of trials per condition is required to confirm that the complexity-cost scores in reaction times detect the characteristics of ASD better than our accuracy-based measures.
Second, as confirmed by Complexity and Group interaction effects in multiple ANOVA/ANCOVA tests, costs of the complexity in reaction times appeared greater in ASD children than in TD children, particularly with horizontal gratings. This orientation effect was also observed in the power of discrimination between ASD and TD children. One might guess that ASD children’s different performance across two orientations caused this orientation effect. However, our within-group analyses suggest that TD children’s different performance across two orientations was the reason. That is, ASD children had difficulty with complex information (compared to simple information) regardless of orientation, whereas TD children performed faster with horizontal gratings than vertical gratings regardless of the complexity of spatial gratings. Our findings on TD children’s faster
responses for horizontal gratings are in line with a prior study reporting that typical adults show faster reaction times for horizontal lines than vertical lines (Gottsdanker
& Tietz, 1992). These different developmental characteristics across vertical and horizontal information could contribute to mixed results in prior studies with ASD and TD individuals (e.g., Keita et al., 2014 versus Koh et al., 2010 for the existence of atypical processing for high frequency visual information in ASD individuals). Along with the fact that atypical processing of ASD individuals is typically defined as differences in processing of TD individuals, our findings highlight the importance of understanding the characteristics of both control groups and the ASD group in order to understand atypical processing of ASD individuals.
Third, even though our findings revealed ASD children’s difficulty in processing complex visual information, the superior performance on simple visual information observed in ASD adults in Bertone et al.
(2005) was not observed in our ASD children. One potential reason for this discrepancy is different developmental changes for processing of simple and complex visual information (Bertone et al., 2008;
Ellemberg et al., 2003). According to Bertone et al.’s (2008) study, TD children’s sensitivity to simple visual information approaches adult-like levels earlier than their sensitivity to complex visual information. However, a recent study on adults (Meilleur et al., 2014) also failed to replicate ASD individuals’ superior performance on simple information observed in Bertone et al.’s study (2005), consistent with our findings. Another adult study (Keita et al., 2014) showed that ASD adults’ superior performance on simple visual information was observed only with high spatial frequency gratings (e.g., 8 cpd).
Thus, the superior performance with simple stimuli might not be robust in ASD, or at least might be context- or task-specific.
Our study also provides useful information for testing ASD children. Our complexity cost measure discriminated
ASD children from TD children at a good level and was independent of general IQ or age. We also found that despite ASD children’s general difficulty in processing complex visual information, both group-level and individual-level differences were more evident with horizontal stimuli. Our orientation task itself also has a strong point. Compared to other orientation tasks requiring hundreds of trials (e.g. 200 trials in Rivest et al., 2013), our task only included 36 trials, which took approximately 10 minutes in total and minimized boredom and practice effects. Our findings have implications for both understanding the characteristics of ASD children and developing tests for ASD children.
Despite the strong points of our study, however, there are also several limitations that should be considered for future studies. First, although our sample size was similar to that of Rivest et al.'s (2013), 14 participants per group may not be enough to represent the general population of ASD. Considering the heterogeneity of ASD, this small sample size could cause weak statistical power of some of our analyses (e.g. the lack of 3-way interaction effect of Complex, Orientation and Group in our ANOVA/ANCOVA tests). Second, our ratio of male to female ASD participants (13 to 1) was higher than the ratio observed from general populations (e.g. 4 to 1).
Given potential genetic differences between male and female ASD individuals, our findings should be applied to female ASD individuals with a caution. Last, although we intentionally used a small number of trials to develop a test for children and found unique characteristics of ASD children with our test, reducing the number of trials also yielded multiple methodological differences from prior studies using threshold methods. Future studies systematically controlling for the number of trials and modulation levels, and assessment methods (e.g., reaction times, accuracy, or accuracy-based threshold) one by one would provide a deep understanding of characteristics of ASD individuals.
REFERENCES
Allison, C., Williams, J., Scott, F., Stott, C., Bolton, P., Baron-Cohen, S., & Brayne, C. (2007). The Childhood Asperger Syndrome Test (CAST):Test–retest reliability in a high scoring sample. Autism, 11(2), 173-185. DOI:10.1177/1362361307075710
Armstrong, V., Maurer, D., & Lewis, T. L. (2009).
Sensitivity to first- and second-order motion and form in children and adults. Vision Research, 49(23), 2774-2781. DOI: 10.1016/j.visres.2009.08.016 American Psychiatric Association (2013). Diagnostic
and Statistical Manual of Mental Disorders (DSM-5) (fifth ed.). Washington, DC: American Psychiatric Association.
Bertone, A., & Faubert, J. (2006). Demonstrations of decreased sensitivity to complex motion information not enough to propose an autism-specific neural etiology. Journal of Autism and Developmental Disorders, 36(1), 55-64.
DOI: 10.1007/s10803-005-0042-5
Bertone, A., Hanck, J., Cornish, K. M., & Faubert, J.
(2008). Development of static and dynamic perception for luminance-defined and texture-defined information.
Neuroreport, 19(2), 225-228.
DOI:10.1097/WNR.0b013e3282f48401
Bertone, A., Mottron, L., Jelenic, P., & Faubert, J. (2003).
Motion perception in autism: a "complex" issue.
Journal of Cognitive Neuroscience, 15(2), 218-225.
DOI: 10.1162/089892903321208150
Bertone, A., Mottron, L., Jelenic, P., & Faubert, J. (2005).
Enhanced and diminished visuo-spatial information processing in autism depends on stimulus complexity. Brain, 128(10), 2430-2441.
DOI: 10.1093/brain/awh561
Brainard, D. H. (1997). The Psychophysics Toolbox.
Spatial Vision, 10(4), 433-436.
DOI: 10.1163/156856897X00357
Brosseau-Lachaine, O., Gagnon, I., Forget, R., &
Faubert, J. (2008). Mild traumatic brain injury induces prolonged visual processing deficits in children. Brain Injury, 22(9), 657-668.
DOI: 10.1080/02699050802203353
Chlebowski, C., Green, J. A., Barton, M. L., & Fein, D. (2010). Using the Childhood Autism Rating Scale to Diagnose Autism Spectrum Disorders. Journal of Autism and Developmental Disorders, 40(7), 787–
799. DOI: 10.1007/s10803-009-0926-x
Dumoulin, S. O., Baker, C. L., Hess, R. F., & Evans, A. C. (2003). Cortical specialization for processing first- and second-order motion. Cerebral Cortex, 13(12), 1375-1385. DOI: 10.1093/cercor/bhg085 Ellemberg, D., Lavoie, K., Lewis, T. L., Maurer, D.,
Lepore, F., & Guillemot, J. P. (2003). Longer VEP latencies and slower reaction times to the onset of second-order motion than to the onset of first-order motion. Vision Research, 43(6), 651-658.
DOI: 10.1016/S0042-6989(03)00006-3
Ellemberg, D., Lewis, T. L., Meghji, K. S., Maurer, D., Guillemot, J. P., & Lepore, F. (2003). Comparison of sensitivity to first- and second-order local motion in 5-year-olds and adults. Spatial Vision, 16(5), 419-428. DOI: 10.1163/156856803322552748 Farzin, F., Whitney, D., Hagerman, R. J., & Rivera, S.
M. (2008). Contrast detection in infants with fragile X syndrome. Vision Research, 48(13), 1471-1478.
DOI:10.1016/j.visres.2008.03.019
Gottsdanker, R., & Tietz, J. D. (1992). Reaction time for horizontal versus vertical line-length discrimination.
Bulletin of the Psychonomic Society, 30(1), 74-76.
DOI:10.3758/bf03330401
Keita, L., Guy, J., Berthiaume, C., Mottron, L., &
Bertone, A. (2014). An early origin for detailed perception in Autism Spectrum Disorder: biased sensitivity for high-spatial frequency information.
Scientific Reports, 4, 5475. DOI:10.1038/srep05475 Koh, H. C., Milne, E., & Dobkins, K. (2010). Spatial
contrast sensitivity in adolescents with autism spectrum disorders. Journal of Autism and Developmental Disorders, 40(8), 978-987.
DOI: 10.1007/s10803-010-0953-7
Kwak, K. J., Park, H. W., & Kim, C. T. (2001). Korean version Wechsler Intelligence Scale for Children- Third Edition. Special Education Publishing Co, Seoul, Korea.
Kwak, K. J., Oh, S. W., & Kim, C. T. (2011). Korean
version Wechsler Intelligence Scale for Children-IV.
Hakjisa, Seoul, Korea.
Lachapelle, J., Ouimet, C., Bach, M., Ptito, A., &
McKerral, M. (2004). Texture segregation in traumatic brain injury--a VEP study. Vision Research, 44(24), 2835-2842. DOI: 10.1016/j.visres.2004.06.007 Marco, E. J., Hinkley, L. B., Hill, S. S., & Nagarajan,
S. S. (2011). Sensory processing in autism: a review of neurophysiologic findings. Pediatric Research, 69(5 Pt 2), 48R-54R.
DOI:10.1203/PDR.0b013e3182130c54
Meilleur, A. A., Berthiaume, C., Bertone, A., & Mottron, L. (2014). Autism-specific covariation in perceptual performances: "g" or "p" factor? Plos One, 9(8), e103781. DOI: 10.1371/journal.pone.0103781 Parrish, E. E., Giaschi, D. E., Boden, C., & Dougherty,
R. (2005). The maturation of form and motion perception in school age children. Vision Research, 45(7), 827-837. DOI: 10.1016/j.visres.2004.10.005 Rivest, J. B., Jemel, B., Bertone, A., McKerral, M., &
Mottron, L. (2013). Luminance- and texture-defined information processing in school-aged children with autism. Plos One, 8(10), e78978.
DOI: 10.1371/journal.pone.0078978
Sanchez-Marin, F. J., & Padilla-Medina, J. A. (2008).
A psychophysical test of the visual pathway of children with autism. Journal of Autism and Developmental Disorders, 38(7), 1270-1277.
DOI: 10.1007/s10803-007-0507-9
Swets, J. A. (1988). Measuring the accuracy of diagnostic systems. Science, 240(4857), 1285-1293.
DOI: 10.1126/science.3287615
Sysoeva, O. V., Davletshina, M. A., Orekhova, E. V., Galuta, I. A., & Stroganova, T. A. (2015). Reduced Oblique Effect in Children with Autism Spectrum Disorders (ASD). Frontiers in Neuroscience, 9, 512.
DOI: 10.3389/fnins.2015.00512
Vandenbroucke, M. W., Scholte, H. S., van Engeland, H., Lamme, V. A., & Kemner, C. (2008). A neural substrate for atypical low-level visual processing in autism spectrum disorder. Brain, 131(4), 1013-1024.
DOI: 10.1093/brain/awm321
Waterhouse, L., London, E., & Gillberg, C. (2016). ASD
ⓒ 2018 (by) the authors. This open access article is distributed under the terms and conditions of the Creative Commons Attribution license (http://creativecommons.org/licenses/by/3.0), which permits unrestricted use, distribution, and reproduction in any medium, provided that the original work is properly cited.
Validity. Review Journal of Autism and Developmental Disorders, 3(4), 302-329.
DOI: 10.1007/s40489-016-0085-x
Wilkes, B. J., Carson, T. B., Patel, K. P., Lewis, M. H.,
& White, K. D. (2015). Oculomotor performance in children with high-functioning Autism Spectrum Disorders. Research in Developmental Disabilities, 38, 338-344. DOI: 10.1016/j.ridd.2014.12.02
원고접수: 2018.04.04 수정접수: 2018.06.13 게재확정: 2018.06.18