Vol.22 No.2 p221-240, Dec. 2005
책임저자:김성용, 대구시 남구 대명동 317-1, 영남대학교 의과대학 생화학ㆍ분자생물학교실, Tel. 053-620-4343, Fax. 053-654-6651, Email: seongyong@med.yu.ac.kr
※ 이 논문은 2005학년도 재단법인 천마의학연구재단 지원에 의하여 이루어졌음.
1)
Saos-2 세포에서 Doxorubicin에 의한 세포사멸 유도과정에서의 유전자 발현 변화*
임정숙ㆍ배민재ㆍ백석환ㆍ김재룡ㆍ김정희ㆍ김성용
영남대학교 의과대학 생화학ㆍ분자생물학교실Profile of Gene Expression Changes During Doxorubicin Induced Apoptosis of Saos-2
Jeong Sook Lim, Min Jae Bae, Suk Hwan Baek, Jae Ryong Kim, Jung Hye Kim, Seong Yong Kim
Department of Biochemistry and Molecular Biology, College of medicine, Yeungnam University, Daegu, Korea
-Abstract-
Background: Doxorubicin has proved to be a useful chemotherapeutic agent especially for osteogenic sarcoma. It induces cancer cell death via apoptosis.
Materials and Methods: To explore and analyze the changes of gene expression during doxorubicin induced apoptosis on human osteogenic sarcoma, Saos-2 cell, cDNA microarray was performed. After treatment with doxorubicin, total RNA was purified and expressed genes were investigated with a 17k human cDNA microarray.
Results: For analysis of the cDNA microarray, the genes were filtered using the sum of the median value of Cy3 and Cy5 signal intensity of greater than 800. Expression of 264 genes was changed by more than 2 fold, and the expression of 35 genes was changed more than 3 fold after treatment with doxorubicin. The genes were primarily related to cell death, cell growth and maintenance, signal transduction, cellular component, transport, and metabolism.
Conclusion: Treatment with doxorubicin induced expressional change of many genes. Some
of the genes might be related with apoptosis directly or indirectly. Further study is now
서 론
대부분의 항암제들은 세포사멸을 유도하여 암 을 치료한다.
1, 2)이들 항암제들은 death inducing ligands의 생성 증가
3)와 caspases의 활성 증가
4)등과 같은 세포예정사에 관여하는 여러 가지 인자들을 자극하여 세포 사멸을 일으키게 된 다. Doxorubicin (adriamycin)은 quinone을 가 진 anthracycline 계열의 항암제로서 유방암과 전립선암, 악성 골종양 등과 같은 다양한 악성 종양의 치료에 많이 사용된다.
Doxorubicin의 세포사멸에 관하여는 많은 보고가 있다. 세포사멸의 신호전달 과정에 관 한 연구결과에 의하면 유방암과 폐암, Burkitt's lymphoma 등의 세포주들에서 mitogen-activated protein kinases (MAPKs; JNK, p38, ERK) 또 는 phosphatidyl inositol-3 kinase (PI-3K)/
Akt 들이 doxorubicin에 의해 인산화 됨으로서 세포 신호전달과정이 활성화되어 세포사멸이 유도된다고 한다.
5-7)세포사멸이 유도되면 여러 가지 유전자들의 발현변화 등에 의해서 세포예 정사가 진행되게 되는데, 내피세포의 경우 doxorubicin에 의하여 caspase3를 매개한 세포 사멸이 이루어 진다.
8)또한 Massart 등
9)은 사 람 갑상선암 세포주에서는 doxorubicin에 의한 세포사멸이 FAS의 발현 증가에 기인한다고 보고하였다. 그 외에도 H
2O
2와 ceramide의 증 가 또는 p53, NFκB, Bax들의 발현 증가가 doxorubicin에 의한 세포 사멸에 관여한다는 보고들이 있다.
10-13)항암제의 효과를 증대하거나 약제 내성을 예방 또는 극복하기 위하여 methotrexate, doxorubicin, cisplatin, taxol 등과 같은 항암제를 병용하여 사용하거나 Apo2L/TRAIL, voacamine, Type I interferon, 2-deoxy-D- glucose 등을 항암제 와 같이 투여하여 하기도 한다.
14-17)항암제와 병용하여 사용하는 약제들은 p-glycoprotein, death receptor, FasL, p53 등과 같은 유전자들 의 발현을 조절 또는 억제하여 항암제의 효과 를 향상시킨다.
18-21)이와 같이 항암제의 치료 효과를 향상시키거나 약제내성을 억제하고 또 는 부작용을 줄이기 위해서는 항암제의 세포 내 작용, 특히 유전자 발현에 미치는 영향들을 밝혀내어 필요에 따라 변화되는 각 유전자의 발현을 억제 또는 증가시키는 약제를 동시에 투여함으로써 가능하다고 할 수 있다. 그러나 항암제를 암세포에 투여하여 유전자들의 발현 변화를 관찰하거나 세포사멸과의 연관성에 관 한 연구들은 일부 유전자를 대상으로 한 연구 들이 대부분이며 다량의 유전자를 대상으로 한 연구는 아직 미흡하다.
본 연구에서는 cDNA microarray를 이용하 여 사람의 악성 골종양 세포주인 Saos-2에서 doxorubicin에 의한 세포사멸 과정 동안 유전 자들의 발현 변화를 종합적으로 확인하고자 하 였다.
재료 및 방법 재료
악성 골종양 세포주인 Saos-2를 ATCC (USA) needed to characterize these genes.
Key Words: Doxorubicin, Apoptosis, Osteogenic sarcoma, cDNA microarray
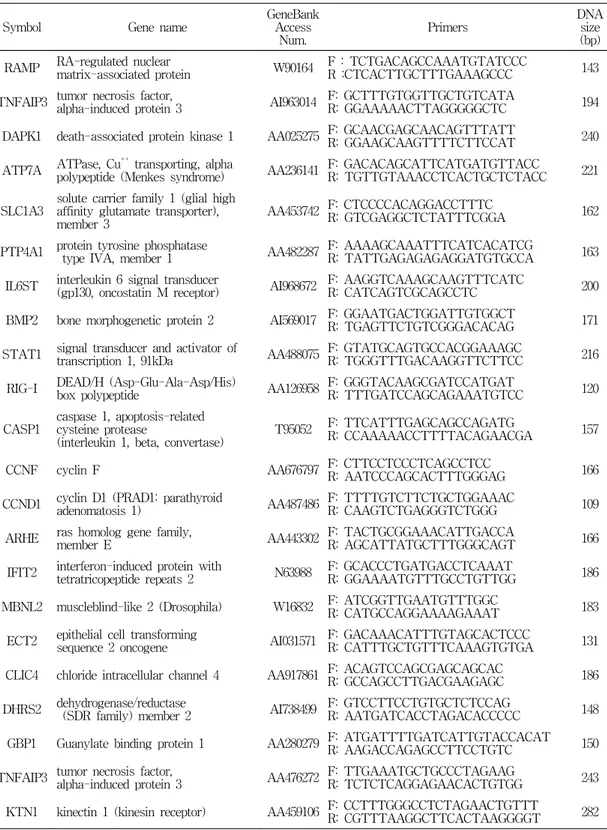
Table 1. Primers for PCR
Symbol Gene name GeneBank
Access
Num. Primers DNA
size (bp) RAMP RA-regulated nuclear
matrix-associated protein W90164 F : TCTGACAGCCAAATGTATCCC
R :CTCACTTGCTTTGAAAGCCC 143
TNFAIP3 tumor necrosis factor,
alpha-induced protein 3 AI963014 F: GCTTTGTGGTTGCTGTCATA
R: GGAAAAACTTAGGGGGCTC 194
DAPK1 death-associated protein kinase 1 AA025275 F: GCAACGAGCAACAGTTTATT R: GGAAGCAAGTTTTCTTCCAT 240
ATP7A ATPase, Cu++ transporting, alpha
polypeptide (Menkes syndrome) AA236141 F: GACACAGCATTCATGATGTTACC R: TGTTGTAAACCTCACTGCTCTACC 221
SLC1A3 solute carrier family 1 (glial high affinity glutamate transporter),
member 3 AA453742 F: CTCCCCACAGGACCTTTC R: GTCGAGGCTCTATTTCGGA 162 PTP4A1 protein tyrosine phosphatase
type IVA, member 1 AA482287 F: AAAAGCAAATTTCATCACATCG
R: TATTGAGAGAGAGGATGTGCCA 163 IL6ST interleukin 6 signal transducer
(gp130, oncostatin M receptor) AI968672 F: AAGGTCAAAGCAAGTTTCATC R: CATCAGTCGCAGCCTC 200 BMP2 bone morphogenetic protein 2 AI569017 F: GGAATGACTGGATTGTGGCT R: TGAGTTCTGTCGGGACACAG 171
STAT1 signal transducer and activator of
transcription 1, 91kDa AA488075 F: GTATGCAGTGCCACGGAAAGCR: TGGGTTTGACAAGGTTCTTCC 216 RIG-I DEAD/H (Asp-Glu-Ala-Asp/His)
box polypeptide AA126958 F: GGGTACAAGCGATCCATGATR: TTTGATCCAGCAGAAATGTCC 120
CASP1 caspase 1, apoptosis-related cysteine protease
(interleukin 1, beta, convertase) T95052 F: TTCATTTGAGCAGCCAGATG
R: CCAAAAACCTTTTACAGAACGA 157
CCNF cyclin F AA676797 F: CTTCCTCCCTCAGCCTCCR: AATCCCAGCACTTTGGGAG 166
CCND1 cyclin D1 (PRAD1: parathyroid
adenomatosis 1) AA487486 F: TTTTGTCTTCTGCTGGAAACR: CAAGTCTGAGGGTCTGGG 109 ARHE ras homolog gene family,
member E AA443302 F: TACTGCGGAAACATTGACCAR: AGCATTATGCTTTGGGCAGT 166 IFIT2 interferon-induced protein with
tetratricopeptide repeats 2 N63988 F: GCACCCTGATGACCTCAAAT
R: GGAAAATGTTTGCCTGTTGG 186
MBNL2 muscleblind-like 2 (Drosophila) W16832 F: ATCGGTTGAATGTTTGGC
R: CATGCCAGGAAAAGAAAT 183
ECT2 epithelial cell transforming
sequence 2 oncogene AI031571 F: GACAAACATTTGTAGCACTCCCR: CATTTGCTGTTTCAAAGTGTGA 131 CLIC4 chloride intracellular channel 4 AA917861 F: ACAGTCCAGCGAGCAGCACR: GCCAGCCTTGACGAAGAGC 186
DHRS2 dehydrogenase/reductase
(SDR family) member 2 AI738499 F: GTCCTTCCTGTGCTCTCCAGR: AATGATCACCTAGACACCCCC 148 GBP1 Guanylate binding protein 1 AA280279 F: ATGATTTTGATCATTGTACCACATR: AAGACCAGAGCCTTCCTGTC 150
TNFAIP3 tumor necrosis factor,alpha-induced protein 3 AA476272 F: TTGAAATGCTGCCCTAGAAGR: TCTCTCAGGAGAACACTGTGG 243
KTN1 kinectin 1 (kinesin receptor) AA459106 F: CCTTTGGGCCTCTAGAACTGTTT
R: CGTTTAAGGCTTCACTAAGGGGT 282
로부터 구입하였다. Fetal calf serum (FCS)은 Hyclone (Australia), penicillin/streptomycin과 RPMI1640, Dulbecco's modified Eagle's medium (DMEM) 배양액은 Life Technologies (USA)로부터 구입하여 사용하였다.
Doxorubicin은 임상에서 사용되는 일동제약 제품을 사용하였으며 3-(4,5- dimethyl-thiazol -2-yl)-2,5-diphenyltetrazolium bromide (MTT), Tri-reagent RNA extraction solution은 Sigma (USA), BCA 단백질 정량시약은 Pierce (USA) 로부터 구입하여 사용하였다.
Reverse transcriptase (RT) polymerase chain reaction (PCR)에 사용한 primer들은 바 이오니어 (한국)에 주문 제작하였다 (Table 1).
방법 세포배양
악성 골종양 세포주 Saos-2는 10% FCS와 1% penicillin/streptomycin 용액이 섞인 RPMI 1640 배양액을 사용하여 37℃, 5% 이산화탄소 배양기에서 배양하였다.
MTT assay
Saos-2 세포들을 96 well plate에 well마다 5000개가 되도록 분주한 후 24시간 배양하였 다. Doxorubicin을 200, 20, 2 ㎍/ml, 200, 20, 2 ng/ml, 200, 20, 2 pg/ml 등의 농도가 되도록 처리한 후 72시간 배양하고 50 mg/ml MTT용 액 (in phosphate buffered saline) 50 ㎕를 각 well에 첨가한 후 이산화탄소 배양기에서 3시 간 반응시켰다. 상청액을 조심스럽게 제거하고 DMSO 200 ㎕를 첨가한 후 microplate reader (Biorad, USA)를 사용하여 570 nm에서 흡광 도를 측정하였다.
RNA 정제
Saos-2 세포들을 직경 100 mm 배양접시에 1✕10
6개가 되도록 분주한 후 24시간 배양하였 다. 새로운 배양액으로 교환하고 doxorubicin 을 200 ng/ml 농도가 되도록 처리한 후 0, 6, 24시간에 세포를 수확하여 RNA를 추출하였다.
RNA는 Tri-reagent (Sigma, USA)를 이용 하여 정제하였다. 세포배양액을 제거하고 배양 접시에 1 ml의 Tri-reagent를 첨가하여 세포 를 용해시켰다. 용액을 원심관으로 옮기고 실 온에서 10분 동안 방치하였다. Chloroform 2 ml를 첨가하여 30초간 진탕한 다음 실온에서 10분 동안 방치하였다. 4℃, 13000 rpm에서 10 분간 원침한 후, 상부의 수용액층을 새로운 원 심관에 옮겼다. Isopropanol 0.5 ml를 첨가하고 잘 섞은 다음 실온에 10 분간 방치하였다. 4℃, 13000 rpm에서 10분간 원침하여 RNA를 침전 시켰다. 침전된 RNA를 에탄올 0.5 ml로 세척 한 후 RNAse-free 증류수 50 μl에 녹였다.
RNA는 UV-spectrophotometer (Shimazu, 일 본)를 사용하여 260 nm에서의 흡광도를 측정 하여 농도를 결정하였다.
cDNA microarray
추출한 RNA를 지노믹트리사 (한국)에 보내
어 cDNA microarray 실험과 분석을 의뢰하였
다. RNA 100 ㎍을 RNase-free 증류수 13.4 ㎕
에 녹이고 2 ㎕ Oligo-dT (2 ㎍/㎕) 첨가하여
65℃에서 10분간 가열한 후 얼음위에서 2분간
방치한 후 원침 하였다. Pre-reaction mixture
9.6 ㎕를 첨가하고 대조군(0시간)에는 Cy3-dUTP
(1 mM) 3 ㎕를, 6시간 또는 24시간 처리군에
는 Cy5-dUTP (1 mM) 3 ㎕를 첨가한 후 2 ㎕
(200U/㎕)의 reverse transcriptase (Superscript
II)를 첨가하여 42℃에서 2시간 동안 역전사 반응을 시켜 cDNA를 합성하였다. Cy3 또는 Cy5가 표지된 cDNA 를 QIA quick PCR purification kit (Qiagen, USA)로 분리 정제한 후 microarray chip에 hybridization시킨다. array 한 image를 scanning한후 데이터분석은 분석 프로그램인 GeneSpring 6.1 (Silicon Genetics, USA)을 이용하였다.
RT-PCR에 의한 유전자 발현조사
Complementary DNA (cDNA)는 total RNA 으로부터 oligo(dT) priming 방법으로 M-MLV reverse transcriptase (Promega, USA)를 사용 하여 합성하였다. Total RNA 1-2 ㎍, 100 μM oligo(dT), 100 nM dNTPs를 섞은 후 증류수 로 5 ㎕가 되게 하였다. 65℃에서 5분간 반응 시킨 후 얼음위에서 식혔다. 5✕ RT buffer (250 mM Tris-HCl, pH 8.3, 50 mM KCl, 30 mM MgCl
2), 2 U RNase inhibitor, 100 U M-MLV reverse transcriptase를 혼합하여 최 종 10 ㎕가 되도록 한 후 42℃에서 2 시간동안 반응시켰다. 72℃에서 10분간 반응시킨 후 증 류수 90 ㎕를 첨가하였다. PCR은 10✕ buffer 와 2.5 U supertherm Taq, 25 mM dNTPs, cDNA 1㎕, 2 μM primer, 증류수로 총 10 ㎕ 가 되도록 만들어 반응시켰다. 반응조건은 초기 반응으로 95℃에서 5분간 denaturation 시키고, 94℃에서 15초, 55℃에서 15초, 72℃
30초를 30 cycle을 반응시킨 후, 마지막 반 응으로 72℃에서 10분간 더 반응시켰다. 이 PCR 산물은 Ethidium Bromide를 포함하는 2% agarose gel 상에 전기영동하여 확인하 였다.
성 적
Doxorubicin에 의한 Saos-2의 세포생존율의 변화
Saos-2세포에서 doxorubicin에 의한 유전자 발현 변화를 조사하기 위해 먼저 어느 농도의 doxorubicin 처리에 의해 세포사가 유도되는지 MTT assay를 시행하였다. 5000개의 세포들을 96 well plate의 각 well에 분주하고 24시간 배 양한 후 doxorubicin을 200, 20, 2, ㎍/ml, 200, 20, 2 ng/ml, 200, 20, 2 pg/ml 로 처리하였다. 72 시간 후, 세포 생존율은 20 ng/ml의 doxorubicin 을 처리한 경우 약 80%, 200 ng/ml에서는 약 15% 정도이었고, 2 ㎍/ml에서는 거의 모든 세 포가 죽었다 (Fig. 1). 따라서 Saos-2 세포의 유전자 발현 변화를 관찰하기위한doxorubicin 의 최적 농도를 200 ng/ml로 하였다.
Saos-2에서 doxorubicin에 의한 유전자의 발 현 변화
Saos-2에서 doxorubicin에 의한 세포사 과 Fig. 1. Effect of doxorubicin on Saos-2 cell viability.
Cells were treated with various concentrations
of doxorubicin for 72 h. Cell viability was
measured by MTT assay. Values are
mean±SD of three independent experiments.
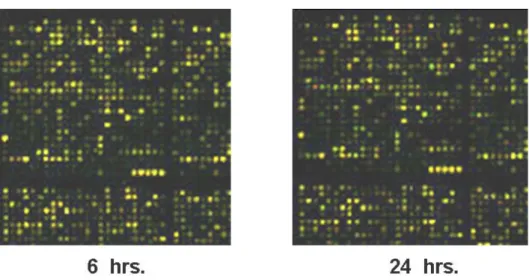
정에서 유전자 발현 변화를 cDNA microarry 를 이용하여 조사하였다. Microarry image에서 doxorubicin에 의하여 발현이 증가하는 유전자 는 빨간색, 감소하는 유전자는 녹색, 발현변화 가 없을 때는 노란색으로 나타난다 (Fig. 2).
cDNA microarray 분석 결과, 전체 16343개 유 전자 중에서 Cy3과 Cy5의 형광 강도의 합이 800이상인 유전자를 선별하였다. Fig. 3은 이들 각 유전자의 형광 강도를 산포도로 표시한 것 이다. 이들 유전자들 중에서 대조군에 비하여 Fig. 2. Microarray images of doxorubicin treated Saos-2 cell. RNAs were extracted from
Saos-2 at 0 (control), 6 hr and 24 hr after treatment of doxorubicin. The control RNA was labled with Cy3 (green color) and doxorubicin treated RNAs were labled with Cy5 (red color).
Fig. 3. Image of scatter plot: Good genes were filtered by sum of median value more than
800. The scatter plot analyzed on the basis of these good genes. X-axis is Cy3 signal
intensity and Y-axis is Cy5 signal intensity.
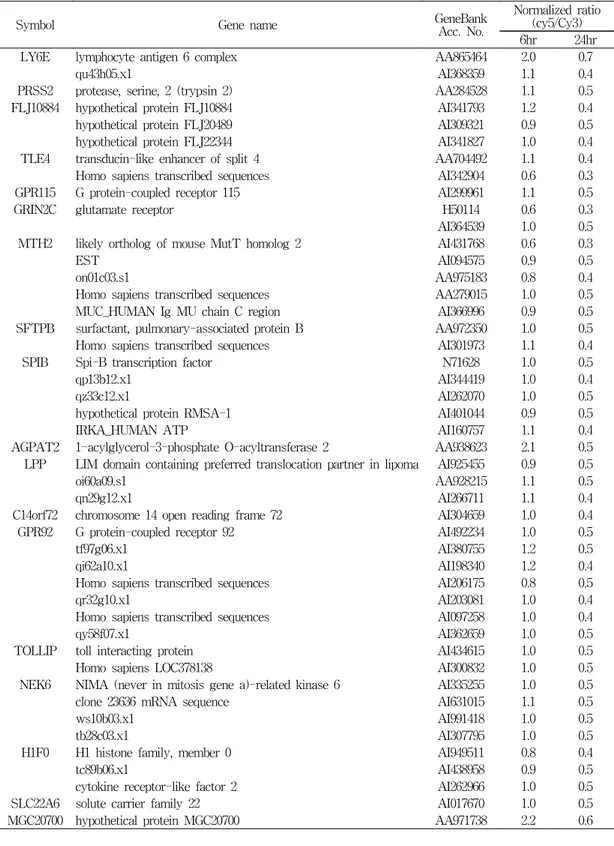
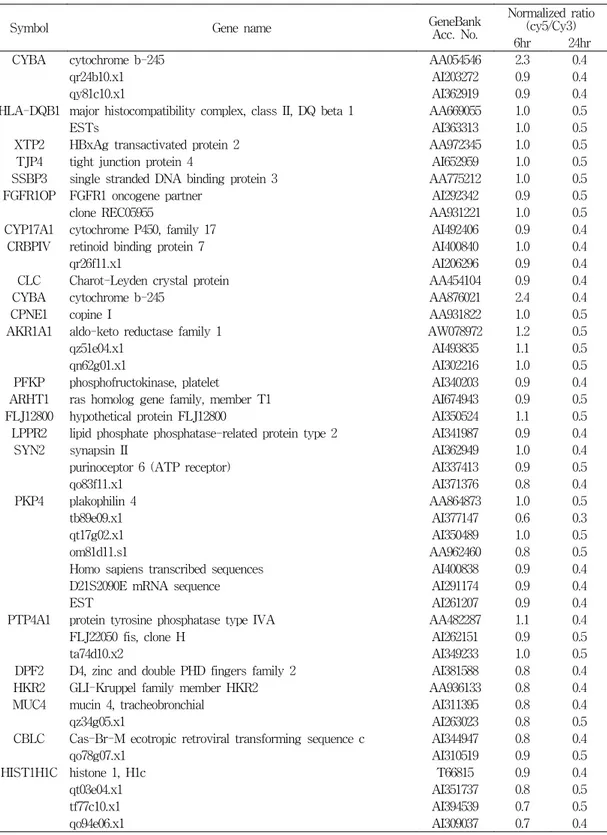
doxorubicin처리 후 시간대 별로 발현 변화를 보이는 유전자를 선별한 결과, 두 배 이상의 발현 변화를 보이는 유전자는 264개이었으며 세 배 이상 발현 변화를 보이는 유전자는 35개 였다. Fig. 4에는 doxorubicin 처리 후 6시간과 24시간에서의 이들 유전자의 발현 변화를 계층 구조분석을 하여 나타내었으며 녹색을 나타내 는 부분은 유전자의 발현이 감소하는 것을 의 미하며 빨간색은 증가함을, 검은색은 발현변화 가 없는 것을 의미한다.
대조군에 비하여 두 배 이상 발현 변화를 보이는 유전자 264개를 doxorubicin 처리 후 시간대 별로 발현변화가 비슷한 유전자들을 K-mean clustering으로 분석하여 5가지의 군
(A, B, C, D, E)으로 분류할 수 있었다. A군은 doxorubicin 처리 후 6시간에 발현이 증가하 며 24시간 까지 계속 발현이 증가하는 유전자 들로 67개가 여기에 속하였다 (Fig. 5A). B군 은 doxorubicin 처리 후 6시간까지는 큰 변화 가 없다가 24시간에는 감소하는 경향을 보이는 유전자들로 108개가 여기에 속하였다 (Fig.
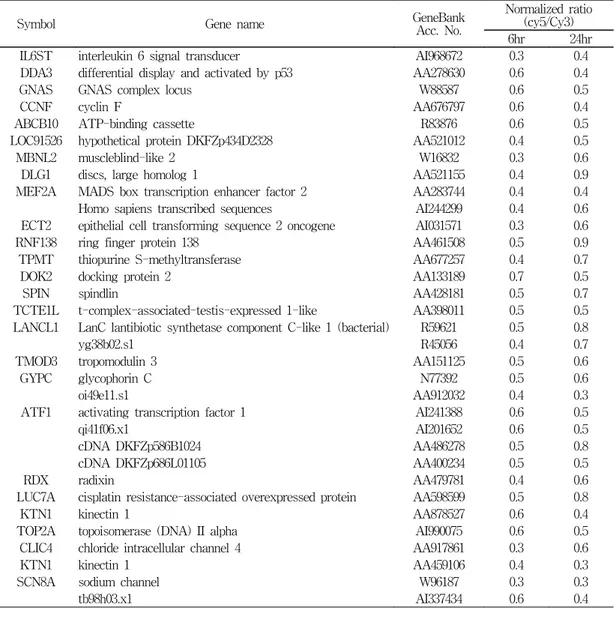
5B). C군은 doxorubicin 처리 후 6시간에 발현 이 감소하였으며 24시간까지 발현 감소가 계속 되는 33개 유전자가 여기에 속하였다 (Fig.
5C). D군은 doxorubicin 처리 후 6시간에 발현 이 감소하였으나 24시간에는 다시 발현이 회복 되는 경향을 보이는 유전자들로 5개가 여기에 속하였다 (Fig. 5D). E군은 doxorubicin 처리 Fig. 4. Genetree for genes which were changed in expression more than 2-fold (A)
and 3 fold (B) after treatment of doxorubicin on Saos-2 cells.
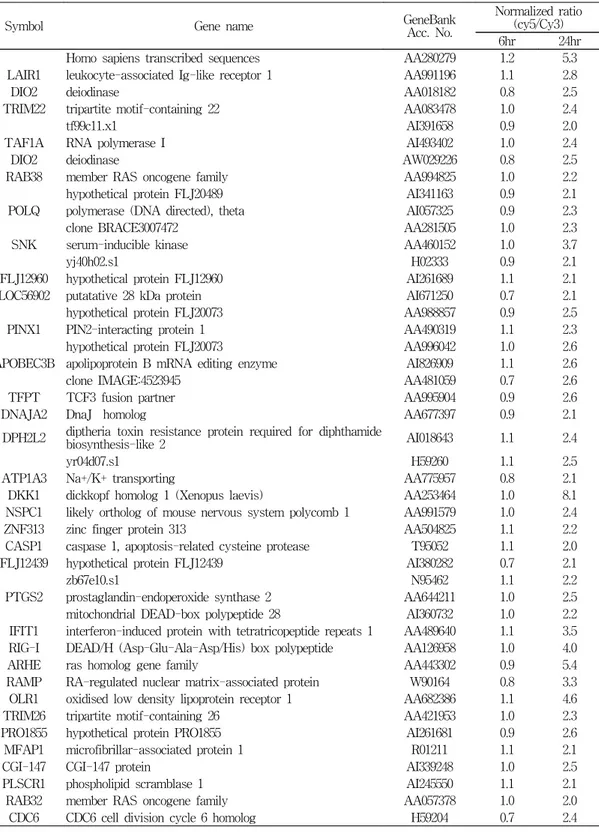
후 6시간까지는 발현의 변화가 거의 없다가 24시간에 발현이 증가하는 경향을 보이는 것 으로 51개 유전자가 여기에 속하였다 (Fig.
5E). 그리고 각 군에 속하는 유전자들은 Symbol, 유전자 이름, GeneBank accession number, doxorubicin 처리 후 시간에 따른 유전자의 발 현 변화 등을 Table 2에서 Table 6에 요약하 였다.
RT-PCR
cDNA microarry의 결과에서 가끔씩 나타나 는 위양성을 확인하기 위하여 발현 변화가 현 저한 유전자들 중에서 발현증가를 보이는 13개
와 발현감소를 보이는 9개의 유전자를 RT-PCR 을 이용하여 발현정도를 cDNA microarry 결 과와 비교 하였다 (Fig. 6). cDNA microarry의 결과에서 발현증가를 보이는 13개 유전자 중에 서 RT-PCR 결과 RA-regulated nuclear matrix- associated protein (RAMP), tumor necrosis factor alpha-induced protein 3 (TNFAIP3), death-associated protein kinase 1 (DAPK1), guanylate binding protein 1 (GBP1), solute carrier family 1 member 3 (SLC1A3), bone morphogenetic protein 2 (BMP2), signal transducer and activator of transcription 1 (STAT1), cyclin D1, ras homolog gene Fig. 5. K-mean clustering of 264 genes which were changed in expression more than 2-fold after
treatment of doxorubicin on Saos-2 cells.
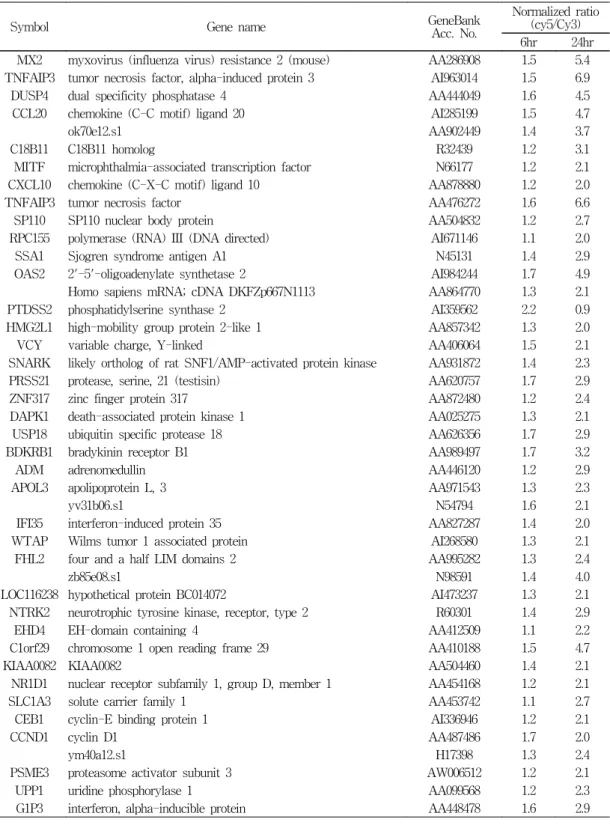
Table 2. Genes in group A
Symbol Gene name GeneBank
Acc. No.
Normalized ratio (cy5/Cy3) 6hr 24hr MX2 myxovirus (influenza virus) resistance 2 (mouse) AA286908 1.5 5.4 TNFAIP3 tumor necrosis factor, alpha-induced protein 3 AI963014 1.5 6.9
DUSP4 dual specificity phosphatase 4 AA444049 1.6 4.5
CCL20 chemokine (C-C motif) ligand 20 AI285199 1.5 4.7
ok70e12.s1 AA902449 1.4 3.7
C18B11 C18B11 homolog R32439 1.2 3.1
MITF microphthalmia-associated transcription factor N66177 1.2 2.1
CXCL10 chemokine (C-X-C motif) ligand 10 AA878880 1.2 2.0
TNFAIP3 tumor necrosis factor AA476272 1.6 6.6
SP110 SP110 nuclear body protein AA504832 1.2 2.7
RPC155 polymerase (RNA) III (DNA directed) AI671146 1.1 2.0
SSA1 Sjogren syndrome antigen A1 N45131 1.4 2.9
OAS2 2'-5'-oligoadenylate synthetase 2 AI984244 1.7 4.9
Homo sapiens mRNA; cDNA DKFZp667N1113 AA864770 1.3 2.1
PTDSS2 phosphatidylserine synthase 2 AI359562 2.2 0.9
HMG2L1 high-mobility group protein 2-like 1 AA857342 1.3 2.0
VCY variable charge, Y-linked AA406064 1.5 2.1
SNARK likely ortholog of rat SNF1/AMP-activated protein kinase AA931872 1.4 2.3
PRSS21 protease, serine, 21 (testisin) AA620757 1.7 2.9
ZNF317 zinc finger protein 317 AA872480 1.2 2.4
DAPK1 death-associated protein kinase 1 AA025275 1.3 2.1
USP18 ubiquitin specific protease 18 AA626356 1.7 2.9
BDKRB1 bradykinin receptor B1 AA989497 1.7 3.2
ADM adrenomedullin AA446120 1.2 2.9
APOL3 apolipoprotein L, 3 AA971543 1.3 2.3
yv31b06.s1 N54794 1.6 2.1
IFI35 interferon-induced protein 35 AA827287 1.4 2.0
WTAP Wilms tumor 1 associated protein AI268580 1.3 2.1
FHL2 four and a half LIM domains 2 AA995282 1.3 2.4
zb85e08.s1 N98591 1.4 4.0
LOC116238 hypothetical protein BC014072 AI473237 1.3 2.1
NTRK2 neurotrophic tyrosine kinase, receptor, type 2 R60301 1.4 2.9
EHD4 EH-domain containing 4 AA412509 1.1 2.2
C1orf29 chromosome 1 open reading frame 29 AA410188 1.5 4.7
KIAA0082 KIAA0082 AA504460 1.4 2.1
NR1D1 nuclear receptor subfamily 1, group D, member 1 AA454168 1.2 2.1
SLC1A3 solute carrier family 1 AA453742 1.1 2.7
CEB1 cyclin-E binding protein 1 AI336946 1.2 2.1
CCND1 cyclin D1 AA487486 1.7 2.0
ym40a12.s1 H17398 1.3 2.4
PSME3 proteasome activator subunit 3 AW006512 1.2 2.1
UPP1 uridine phosphorylase 1 AA099568 1.2 2.3
G1P3 interferon, alpha-inducible protein AA448478 1.6 2.9
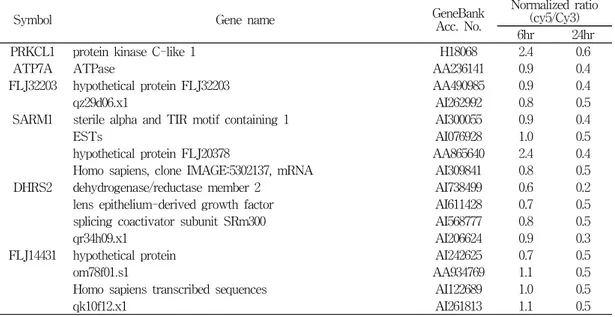
Table 3. Genes in group B
Symbol Gene name GeneBank
Acc. No.
Normalized ratio (cy5/Cy3)
6hr 24hr
PRKCL1 protein kinase C-like 1 H18068 2.4 0.6
ATP7A ATPase AA236141 0.9 0.4
FLJ32203 hypothetical protein FLJ32203 AA490985 0.9 0.4
qz29d06.x1 AI262992 0.8 0.5
SARM1 sterile alpha and TIR motif containing 1 AI300055 0.9 0.4
ESTs AI076928 1.0 0.5
hypothetical protein FLJ20378 AA865640 2.4 0.4
Homo sapiens, clone IMAGE:5302137, mRNA AI309841 0.8 0.5
DHRS2 dehydrogenase/reductase member 2 AI738499 0.6 0.2
lens epithelium-derived growth factor AI611428 0.7 0.5
splicing coactivator subunit SRm300 AI568777 0.8 0.5
qr34h09.x1 AI206624 0.9 0.3
FLJ14431 hypothetical protein AI242625 0.7 0.5
om78f01.s1 AA934769 1.1 0.5
Homo sapiens transcribed sequences AI122689 1.0 0.5
qk10f12.x1 AI261813 1.1 0.5
Table 2. Genes in group A (continue)
Symbol Gene name GeneBank
Acc. No.
Normalized ratio (cy5/Cy3) 6hr 24hr IFIT2 interferon-induced protein with tetratricopeptide repeats 2 N63988 1.4 4.4
ZNF259 zinc finger protein 259 AI343293 1.2 2.2
qp55d08.x1 AI347124 1.2 4.4
CYR61 cysteine-rich, angiogenic inducer, 61 AA777187 1.2 2.2
NK4 natural killer cell transcript 4 AA458965 1.5 2.1
NPR1 natriuretic peptide receptor A AA598841 1.3 3.3
GPR44 G protein-coupled receptor 44 AA464202 1.3 2.9
RNF39 ring finger protein 39 AA485347 1.2 2.2
IER5 immediate early response 5 AI096800 1.4 3.0
CYR61 cysteine-rich, angiogenic inducer, 61 AI014487 1.2 2.2
PI3 protease inhibitor 3, skin-derived (SKALP) AI582329 1.3 2.5 ISGF3G interferon-stimulated transcription factor 3 AA291389 1.2 2.1 MCM7 MCM7 minichromosome maintenance deficient 7 AI688220 1.3 2.4 APEX2 APEX nuclease (apurinic/apyrimidinic endonuclease) 2 AW028935 1.3 2.1
SF1 splicing factor 1 AA454673 1.3 2.0
TNIP1 TNFAIP3 interacting protein 1 T64483 1.4 2.0
OAS3 2'-5'-oligoadenylate synthetase 3, 100kDa AI357590 1.5 3.8 IFITM1 interferon induced transmembrane protein 1 (9-27) AA419251 1.4 2.3 PSME3 proteasome (prosome, macropain) activator subunit 3 AA486324 1.2 2.2
OAS1 2',5'-oligoadenylate synthetase 1 AA146773 1.8 4.3
STAT1 signal transducer and activator of transcription 1 AA488075 1.2 2.1
RBM8A RNA binding motif protein 8A AA448402 1.1 2.1
MCM7 MCM7 minichromosome maintenance deficient 7 AA496025 1.2 2.7
G1P2 interferon, alpha-inducible protein AA406020 1.6 4.5
Table 3. Genes in group B (continue)
Symbol Gene name GeneBank
Acc. No.
Normalized ratio (cy5/Cy3)
6hr 24hr
LY6E lymphocyte antigen 6 complex AA865464 2.0 0.7
qu43h05.x1 AI368359 1.1 0.4
PRSS2 protease, serine, 2 (trypsin 2) AA284528 1.1 0.5
FLJ10884 hypothetical protein FLJ10884 AI341793 1.2 0.4
hypothetical protein FLJ20489 AI309321 0.9 0.5
hypothetical protein FLJ22344 AI341827 1.0 0.4
TLE4 transducin-like enhancer of split 4 AA704492 1.1 0.4
Homo sapiens transcribed sequences AI342904 0.6 0.3
GPR115 G protein-coupled receptor 115 AI299961 1.1 0.5
GRIN2C glutamate receptor H50114 0.6 0.3
AI364539 1.0 0.5
MTH2 likely ortholog of mouse MutT homolog 2 AI431768 0.6 0.3
EST AI094575 0.9 0.5
on01c03.s1 AA975183 0.8 0.4
Homo sapiens transcribed sequences AA279015 1.0 0.5
MUC_HUMAN Ig MU chain C region AI366996 0.9 0.5
SFTPB surfactant, pulmonary-associated protein B AA972350 1.0 0.5
Homo sapiens transcribed sequences AI301973 1.1 0.4
SPIB Spi-B transcription factor N71628 1.0 0.5
qp13b12.x1 AI344419 1.0 0.4
qz33c12.x1 AI262070 1.0 0.5
hypothetical protein RMSA-1 AI401044 0.9 0.5
IRKA_HUMAN ATP AI160757 1.1 0.4
AGPAT2 1-acylglycerol-3-phosphate O-acyltransferase 2 AA938623 2.1 0.5 LPP LIM domain containing preferred translocation partner in lipoma AI925455 0.9 0.5
oi60a09.s1 AA928215 1.1 0.5
qn29g12.x1 AI266711 1.1 0.4
C14orf72 chromosome 14 open reading frame 72 AI304659 1.0 0.4
GPR92 G protein-coupled receptor 92 AI492234 1.0 0.5
tf97g06.x1 AI380755 1.2 0.5
qi62a10.x1 AI198340 1.2 0.4
Homo sapiens transcribed sequences AI206175 0.8 0.5
qr32g10.x1 AI203081 1.0 0.4
Homo sapiens transcribed sequences AI097258 1.0 0.4
qy58f07.x1 AI362659 1.0 0.5
TOLLIP toll interacting protein AI434615 1.0 0.5
Homo sapiens LOC378138 AI300832 1.0 0.5
NEK6 NIMA (never in mitosis gene a)-related kinase 6 AI335255 1.0 0.5
clone 23636 mRNA sequence AI631015 1.1 0.5
ws10b03.x1 AI991418 1.0 0.5
tb28c03.x1 AI307795 1.0 0.5
H1F0 H1 histone family, member 0 AI949511 0.8 0.4
tc89b06.x1 AI438958 0.9 0.5
cytokine receptor-like factor 2 AI262966 1.0 0.5
SLC22A6 solute carrier family 22 AI017670 1.0 0.5
MGC20700 hypothetical protein MGC20700 AA971738 2.2 0.6
Table 3. Genes in group B (continue)
Symbol Gene name GeneBank
Acc. No.
Normalized ratio (cy5/Cy3)
6hr 24hr
CYBA cytochrome b-245 AA054546 2.3 0.4
qr24b10.x1 AI203272 0.9 0.4
qy81c10.x1 AI362919 0.9 0.4
HLA-DQB1 major histocompatibility complex, class II, DQ beta 1 AA669055 1.0 0.5
ESTs AI363313 1.0 0.5
XTP2 HBxAg transactivated protein 2 AA972345 1.0 0.5
TJP4 tight junction protein 4 AI652959 1.0 0.5
SSBP3 single stranded DNA binding protein 3 AA775212 1.0 0.5
FGFR1OP FGFR1 oncogene partner AI292342 0.9 0.5
clone REC05955 AA931221 1.0 0.5
CYP17A1 cytochrome P450, family 17 AI492406 0.9 0.4
CRBPIV retinoid binding protein 7 AI400840 1.0 0.4
qr26f11.x1 AI206296 0.9 0.4
CLC Charot-Leyden crystal protein AA454104 0.9 0.4
CYBA cytochrome b-245 AA876021 2.4 0.4
CPNE1 copine I AA931822 1.0 0.5
AKR1A1 aldo-keto reductase family 1 AW078972 1.2 0.5
qz51e04.x1 AI493835 1.1 0.5
qn62g01.x1 AI302216 1.0 0.5
PFKP phosphofructokinase, platelet AI340203 0.9 0.4
ARHT1 ras homolog gene family, member T1 AI674943 0.9 0.5
FLJ12800 hypothetical protein FLJ12800 AI350524 1.1 0.5
LPPR2 lipid phosphate phosphatase-related protein type 2 AI341987 0.9 0.4
SYN2 synapsin II AI362949 1.0 0.4
purinoceptor 6 (ATP receptor) AI337413 0.9 0.5
qo83f11.x1 AI371376 0.8 0.4
PKP4 plakophilin 4 AA864873 1.0 0.5
tb89e09.x1 AI377147 0.6 0.3
qt17g02.x1 AI350489 1.0 0.5
om81d11.s1 AA962460 0.8 0.5
Homo sapiens transcribed sequences AI400838 0.9 0.4
D21S2090E mRNA sequence AI291174 0.9 0.4
EST AI261207 0.9 0.4
PTP4A1 protein tyrosine phosphatase type IVA AA482287 1.1 0.4
FLJ22050 fis, clone H AI262151 0.9 0.5
ta74d10.x2 AI349233 1.0 0.5
DPF2 D4, zinc and double PHD fingers family 2 AI381588 0.8 0.4
HKR2 GLI-Kruppel family member HKR2 AA936133 0.8 0.4
MUC4 mucin 4, tracheobronchial AI311395 0.8 0.4
qz34g05.x1 AI263023 0.8 0.5
CBLC Cas-Br-M ecotropic retroviral transforming sequence c AI344947 0.8 0.4
qo78g07.x1 AI310519 0.9 0.5
HIST1H1C histone 1, H1c T66815 0.9 0.4
qt03e04.x1 AI351737 0.8 0.5
tf77c10.x1 AI394539 0.7 0.5
qo94e06.x1 AI309037 0.7 0.4
Table 4. Genes in group C
Symbol Gene name GeneBank
Acc. No.
Normalized ratio (cy5/Cy3)
6hr 24hr
IL6ST interleukin 6 signal transducer AI968672 0.3 0.4
DDA3 differential display and activated by p53 AA278630 0.6 0.4
GNAS GNAS complex locus W88587 0.6 0.5
CCNF cyclin F AA676797 0.6 0.4
ABCB10 ATP-binding cassette R83876 0.6 0.5
LOC91526 hypothetical protein DKFZp434D2328 AA521012 0.4 0.5
MBNL2 muscleblind-like 2 W16832 0.3 0.6
DLG1 discs, large homolog 1 AA521155 0.4 0.9
MEF2A MADS box transcription enhancer factor 2 AA283744 0.4 0.4
Homo sapiens transcribed sequences AI244299 0.4 0.6
ECT2 epithelial cell transforming sequence 2 oncogene AI031571 0.3 0.6
RNF138 ring finger protein 138 AA461508 0.5 0.9
TPMT thiopurine S-methyltransferase AA677257 0.4 0.7
DOK2 docking protein 2 AA133189 0.7 0.5
SPIN spindlin AA428181 0.5 0.7
TCTE1L t-complex-associated-testis-expressed 1-like AA398011 0.5 0.5 LANCL1 LanC lantibiotic synthetase component C-like 1 (bacterial) R59621 0.5 0.8
yg38b02.s1 R45056 0.4 0.7
TMOD3 tropomodulin 3 AA151125 0.5 0.6
GYPC glycophorin C N77392 0.5 0.6
oi49e11.s1 AA912032 0.4 0.3
ATF1 activating transcription factor 1 AI241388 0.6 0.5
qi41f06.x1 AI201652 0.6 0.5
cDNA DKFZp586B1024 AA486278 0.5 0.8
cDNA DKFZp686L01105 AA400234 0.5 0.5
RDX radixin AA479781 0.4 0.6
LUC7A cisplatin resistance-associated overexpressed protein AA598599 0.5 0.8
KTN1 kinectin 1 AA878527 0.6 0.4
TOP2A topoisomerase (DNA) II alpha AI990075 0.6 0.5
CLIC4 chloride intracellular channel 4 AA917861 0.3 0.6
KTN1 kinectin 1 AA459106 0.4 0.3
SCN8A sodium channel W96187 0.3 0.3
tb98h03.x1 AI337434 0.6 0.4
Table 5. Genes in group D
Symbol Gene name GeneBank
Acc. No.
Normalized ratio (cy5/Cy3)
6hr 24hr
ATP6V1A ATPase AA504160 0.4 1.7
M11S1 membrane component AI381454 0.5 1.3
NR1D2 nuclear receptor subfamily 1 AA425685 0.4 1.0
GNS glucosamine (N-acetyl)-6-sulfatase AI358910 0.5 1.1
STOM stomatin R62817 0.6 2.2
Table 6. Genes in group E
Symbol Gene name GeneBank
Acc. No.
Normalized ratio (cy5/Cy3)
6hr 24hr
Homo sapiens transcribed sequences AA280279 1.2 5.3
LAIR1 leukocyte-associated Ig-like receptor 1 AA991196 1.1 2.8
DIO2 deiodinase AA018182 0.8 2.5
TRIM22 tripartite motif-containing 22 AA083478 1.0 2.4
tf99c11.x1 AI391658 0.9 2.0
TAF1A RNA polymerase I AI493402 1.0 2.4
DIO2 deiodinase AW029226 0.8 2.5
RAB38 member RAS oncogene family AA994825 1.0 2.2
hypothetical protein FLJ20489 AI341163 0.9 2.1
POLQ polymerase (DNA directed), theta AI057325 0.9 2.3
clone BRACE3007472 AA281505 1.0 2.3
SNK serum-inducible kinase AA460152 1.0 3.7
yj40h02.s1 H02333 0.9 2.1
FLJ12960 hypothetical protein FLJ12960 AI261689 1.1 2.1
LOC56902 putatative 28 kDa protein AI671250 0.7 2.1
hypothetical protein FLJ20073 AA988857 0.9 2.5
PINX1 PIN2-interacting protein 1 AA490319 1.1 2.3
hypothetical protein FLJ20073 AA996042 1.0 2.6
APOBEC3B apolipoprotein B mRNA editing enzyme AI826909 1.1 2.6
clone IMAGE:4523945 AA481059 0.7 2.6
TFPT TCF3 fusion partner AA995904 0.9 2.6
DNAJA2 DnaJ homolog AA677397 0.9 2.1
DPH2L2 diptheria toxin resistance protein required for diphthamide
biosynthesis-like 2 AI018643 1.1 2.4
yr04d07.s1 H59260 1.1 2.5
ATP1A3 Na+/K+ transporting AA775957 0.8 2.1
DKK1 dickkopf homolog 1 (Xenopus laevis) AA253464 1.0 8.1
NSPC1 likely ortholog of mouse nervous system polycomb 1 AA991579 1.0 2.4
ZNF313 zinc finger protein 313 AA504825 1.1 2.2
CASP1 caspase 1, apoptosis-related cysteine protease T95052 1.1 2.0
FLJ12439 hypothetical protein FLJ12439 AI380282 0.7 2.1
zb67e10.s1 N95462 1.1 2.2
PTGS2 prostaglandin-endoperoxide synthase 2 AA644211 1.0 2.5
mitochondrial DEAD-box polypeptide 28 AI360732 1.0 2.2
IFIT1 interferon-induced protein with tetratricopeptide repeats 1 AA489640 1.1 3.5 RIG-I DEAD/H (Asp-Glu-Ala-Asp/His) box polypeptide AA126958 1.0 4.0
ARHE ras homolog gene family AA443302 0.9 5.4
RAMP RA-regulated nuclear matrix-associated protein W90164 0.8 3.3 OLR1 oxidised low density lipoprotein receptor 1 AA682386 1.1 4.6
TRIM26 tripartite motif-containing 26 AA421953 1.0 2.3
PRO1855 hypothetical protein PRO1855 AI261681 0.9 2.6
MFAP1 microfibrillar-associated protein 1 R01211 1.1 2.1
CGI-147 CGI-147 protein AI339248 1.0 2.5
PLSCR1 phospholipid scramblase 1 AI245550 1.1 2.1
RAB32 member RAS oncogene family AA057378 1.0 2.0
CDC6 CDC6 cell division cycle 6 homolog H59204 0.7 2.4
family member E (ARHE), interferon-induced protein with tetratricopeptide repeats 2 (IFIT2), DEAD/H (Asp-Glu-Ala-Asp/His) box polypeptide (RIG-I) 등 11개의 유전자에서 발현 증가를 관 찰할 수 있었다. cDNA microarry의 결과에서 발현감소를 보이는 9개 유전자 중에서 RT-PCR 결과에서 감소를 보이는 것은 dehydrogenase/
reductase member 2 (DHRS2)와 ATPase (Cu
++transporting) alpha polypeptide (ATP7A)의 두 유전자뿐이었고, protein tyrosine phosphatase type IVA, member 1 (PTP4A1), interleukin 6 signal transducer (IL6ST), epithelial cell transforming sequence 2 oncogene (ECT2),
chloride intracellular channel 4 (CLIC4), muscleblind-like 2 (MBNL2) 등의 유전자 발 현은 변화가 없었다. 반면 kinectin 1 (KTN1) 의 발현은 오히려 증가 양상을 보였다. Caspase 1과 cyclin F는 원하는 크기의 RT-PCR 생성 물을 얻지 못하였다.
고 찰
본 연구에서는 보편적으로 가장 널리 쓰이 는 항암제인 doxorubicin을 악성 골종양 세포 주인 Saos-2에 처리한 후 6시간과 24시간에 일 어나는 유전자들의 변화를 cDNA microarray Fig. 6A. Amplified products of genes with RT-PCR
in agarose gels. RNAs were extracted from Saos-2 cells treated with or without doxorubicin for 24 hr.
Fig. 6B. Amplified products of genes with RT-PCR in agarose gels. RNAs were extracted from Saos-2 cells treated with or without doxorubicin for 24 hr.
Table 6. Genes in group E (continue)
Symbol Gene name GeneBank
Acc. No.
Normalized ratio (cy5/Cy3)
6hr 24hr
BMP2 bone morphogenetic protein 2 AI569017 1.0 2.6
MRPS30 mitochondrial ribosomal protein S30 N33236 1.0 2.1
IFIT1 interferon-induced protein with tetratricopeptide repeats 1 AI953299 1.1 2.9 EIF3S7 eukaryotic translation initiation factor 3 AW057866 0.9 2.3
HSPC111 hypothetical protein HSPC111 AA504814 1.0 2.0
IFI16 interferon AA490996 0.9 2.2
로 분석하고자 하였다. 두 배 이상의 발현 변 화를 보이는 264개의 유전자들은 세포사멸과 세포성장, 세포신호전달, 세포골격, 세포주기, 운반, 대사 등에 관여하는 것으로 확인하였다.
세포사에 관계하는 tumor necrosis factor alpha-induced protein 3 (TNFAIP3)와 death- associated protein kinase 1 (DAPK1) 유전자 는 6시간부터 24시간 까지 지속적으로 발현이 증가하는 A군에 속하였고 세포사멸을 조절하 는 cysteine protease인 caspase 1은 6시간 까 지는 발현변화가 거의 없다가 24시간에 증가하 는 E군에 속였다. 이는 doxorubicin에 의한 세 포사멸에서 TNFAIP3과 DAPK1는 비교적 빠 른 시간에 작용하여 세포사멸을 유도한 후 계 속 작용이 지속 되는 것으로 생각되고, caspase 1은 그 작용이 뒤늦게 나타나서 세포사멸에 직 접적으로 관여하는 것으로 여겨진다.
세포주기 조절에 관여하는 유전자들 중에서 cyclin D와 cyclin E 결합단백질은 6시간 이후 발현이 증가하여 24시간 까지 지속적으로 발현 이 증가하는 A군에 속하였고 cyclin F는 6시 간에 발현이 감소하여 24시간 까지 감소가 유 지되는 경향을 보이는 C군에 속하였다. Cyclin F가 세포주기 중 G
2에 가장 발현이 많이 되 며
22)cyclin B1의 핵내 위치를 조절하는 역할 을 한다는 보고
23)들은 cyclin F은 세포증식에 유도하는 유전자에 속하므로 doxorubicin에 의 하여 유도되는 세포사멸에는 발현이 감소되는 본 연구결과는 당연한 것이라 여겨진다. 그러 나 암세포에서 doxorubicin에 의하여 cyclin D1의 발현이 감소한다는 Shao 등의 보고
24)와 는 달리 본 실험의 Saos-2 세포에서는 발현이 증가하였다. 이러한 차이점은 Shao 등은 사람 직장결장 암세포주를 사용하였으므로 서로 다
른 세포들 간의 차이점 또는 cDNA microarray 의 위양성의 결과일 수도 있으므로 좀 더 자세 한 연구가 필요하다.
암유전자들 중에서 epithelial cell transforming sequence 2와 RAS 계열인 RAB38과 RAB32 등은 6시간에 발현이 감소하여 24시간까지 발 현감소가 지속되는 E군에 속하고, fibroblast growth factor receptors 1 (FGFR1) 암유전자 는 6시간까지는 발현변화를 보이지 않다가 24 시간에 발현감소를 보이는 B군에 속하였다. 이 들 암유전자들은 암세포에서 지속적으로 발현 이 되어 세포증식을 주도하는 것으로 여겨지며 본 연구의 결과에서 보이는 doxorubicin에 의 한 발현 감소가 세포증식이 억제 또는 세포사 멸의 유도로 이어질 것으로 생각된다. Volm 등의 보고
25)에 의하면 FGFR1의 발현 정도가 doxorubicin의 효과와 상관관계를 보인다고 하 였다. 이와 같은 보고와 본 연구의 결과를 연 계하여 보면 FGFR1의 발현이 많은 암세포일 경우 doxorubicin에 의하여 발현이 많이 억제 됨으로 해서 세포의 증식이 억제되거나 세포사 멸이 유도되는 것으로 유추할 수 있다.
세포 내의 여러 가지 효소들도 doxorubicin
에 의하여 발현이 변하였다. Serine protease
21 (testisin), ubiquitin specific protease 18,
caspase 1 등은 발현이 증가하는데 이들의 증
가는 세포 사멸과정에서의 단백질의 분해에 관
여하는 것으로 생각된다. Protein kinase C
(PKC)-like 1과 dehydrogenase/reductase (SDR
family)-2, ATPase, phosphofructokinase, DNA
topoisomerase II alpha, protein tyrosine
phosphatase type IVA-1 등은 발현이 감소하
였다. 이들 중 dehydrogenase/reductase (SDR
family)-2, ATPase, phosphofructokinase, DNA
topoisomerase II alpha 등이 감소함으로써 세 포 내의 합성반응 또는 에너지 대사의 감소가 유도되어 세포 사멸을 더욱 촉진 하는 것으로 생각된다. PKC는 세포의 증식과 분화에 관련 된 세포신호전달에 관여한다.
26)Huigsloot 등의 보고
27)에 따르면 PKC alpha를 억제하면 세포 사멸을 막는 기전을 저해하여 항암제의 효능을 높여준다고 한다. 그러므로 본 연구에서 보이 는 doxorubicin에 의한 PKC-like 1 유전자의 발현감소도 Saos-2 세포의 증식을 억제함으로 써 세포사멸에 기여하는 것으로 여겨진다.
Bone morphogenetic proteins (BMPs)은 골 모세포의 분화와 골 재형성에 중요한 분비 인 자이다. BMP-2는 Runx2/Cbfa1, Sp7/osterix, Dlx5 등의 여러 가지 전사 인자의 발현을 유도 하여 골형성 분화를 촉진하는 유전자로 잘 알 려져 있다.
28-31)그러나 BMP-2가 배아암종
32), 사람 전립선암
33), 소뇌 원시신경외배엽종양 세 포주
34), 사람 골수종
35)등의 암세포와 골모세 포
36)등의 세포사멸에도 관여 한다. 본 연구에 서 Saos-2에서 doxorubicin에 의하여 BMP-2 의 유전자의 발현은 6시간까지는 발현의 변화 를 보이지 않다가 24시간에 발현이 증가하는 E군에 속한다. 이는 BMP-2가 직접 또는 간접 적으로 세포사멸에 관여할 것으로 추정할 수 있으며 특히 caspase1과 같이 세포사멸에 초기 보다는 후기에 작용할 것으로 생각된다.
cDNA microarry의 결과의 위양성을 확인하 기 위한 RT-PCR을 이용한 증폭결과에서 cDNA microarry에서 발현 증가를 보이는 13 개 유전자 중에서 원하는 증폭 크기를 얻지 못 한 2개를 제외한 11개 모두 발현 증가를 보이 므로 그 결과는 매우 신뢰성이 있다. cDNA microarry에서 발현 감소를 보이는 9개 중
RT-PCR 결과에서 발현 감소를 보이는 2개 유전자 외에 6개에서는 발현변화를 관찰할 수 없었고, 상반된 결과를 보이는 유전자는 한 가 지뿐이라는 결과는 발현이 감소하는 유전자는 발현 증가를 보이는 유전자들에 비해 상대적으 로 발현의 변화 확인이 쉽지 않다고 생각된다.
이상의 결과로 부터 Saos-2 세포에서 doxorubicin 에 의해 세포사멸과 세포성장, 세포신호전달, 세포골격, 세포주기, 운반, 대사 등에 관여하는 많은 유전자들의 발현이 변함을 확인할 수 있 었으며, 이러한 많은 변화들이 세포사멸에 직 접 또는 간접적으로 관여함을 알 수 있었다.
그러나 많은 유전자들이 세포 사멸에 어떻게 관여하는지, 그리고 이러한 유전자들의 변화를 다른 약제를 투여하거나 자극을 주어서 증가 또는 감소하였을 때 세포사멸에 어떤 영향을 미치는지, 항암제의 부작용이나 약제 내성을 극복할 수 있는지를 알기 위해서는 아직 더 많 은 연구가 필요할 것이며 본 연구가 이러한 연 구의 기초자료가 될 것으로 생각된다.
요 약
사람의 악성 골종양 세포주 Saos-2 를 이용 하여 doxorubicin에 의해 발현이 증가 또는 감 소하는 유전자들의 변화를 cDNA microarray 를 이용하여 확인하였다.
그 결과 대조군에 비하여 2배 이상 증가 또 는 감소하는 유전자 264개, 3배 이상 증가 또 는 감소하는 유전자 35개를 선별할 수 있었다.
Doxorubicin 처리 후 시간대 별로 발현변화가
비슷한 유전자들을 k-mean clustering으로 분
석하여 5가지의 군으로 분류할 수 있었다. A
군은 24시간 까지 계속 발현이 증가하는 67개
유전자, B군은 6시간까지는 변화가 없다가 24 시간에는 감소하는 108개 유전자, C군은 6시간 에 발현의 감소하고 24시간까지 지속되는 33개 유전자, D군은 6시간에 발현의 감소하였으나 24시간에는 다시 발현이 회복되는 5개 유전자, 그리고 E군은 6시간까지는 발현의 변화가 없 다가 24시간에 발현이 증가하는 경향을 보이는 51개 유전자로 구분하였다.
cDNA microarry 결과 발현차이가 현저한 22개의 유전자들을 대상으로 RT-PCR을 시행 하여 발현정도를 비교하였다. cDNA microarry 에서 발현증가를 보이는 13개 유전자 중에서, RT-PCR 결과 11개가 그 발현이 증가하였으 며, cDNA microarry의 결과에서 발현감소를 보이는 9개 유전자 중에서 RT-PCR 결과에서 2개 유전자만 감소하였다.
이상의 결과 Saos-2 세포에서 doxorubicin 에 의해 세포사멸과 세포성장, 세포신호전달, 세포골격, 세포주기, 운반, 대사 등에 관여하는 많은 유전자들의 발현이 변함을 확인할 수 있 었다.
참 고 문 헌
1. Hickman JA, Potten CS, Merritt AJ, Fisher TC. Apoptosis and cancer chemotherapy.
Philos Trans R Soc Lond B Biol Sci 1994 Aug 30;345(1313):319-25.
2. Rowan S, Fisher DE. Mechanisms of apoptotic cell death. Leukemia 1997 Apr;11(4):457-65.
3. Friesen C, Herr I, Krammer PH. Debatin KM.
Involvement of the CD95 (APO-1/FAS) receptor /ligand system in drug-induced apoptosis in leukemia cells. Nat Med 1996 May;2(5):574-7.
4. Kaufmann SH, Desnoyers S, Ottaviano Y,
Davidson NE, Poirier GG. Specific proteolytic cleavage of poly(ADP-ribose) polymerase: an early marker of chemotherapy-induced apoptosis.
Cancer Res 1993 Sep 1;53(17):3976-85.
5. Kim J, Freeman MR. JNK/SAPK mediates doxorubicin-induced differentiation and apoptosis in MCF-7 breast cancer cells. Breast Cancer Res Treat 2003 Jun;79(3):321-8.
6. Shlapatska LM, Berdova GG, Kovalevska LM, Kulyk GI, Klein G, Sidorenko SP et al. Signal transduction pathways in Burkitt's lymphoma BL41 and DG75 with different sensitivity to doxorubicin. Exp Oncol 2004 Sep;26(3):210-6.
7. Zhao Y, You H, Yang Y, Wei L, Zhang X, Yao L et al. Distinctive regulation and function of PI3K/Akt and MAPKs in doxorubicin-induced apoptosis of human lung adenocarcinoma cells.
J Cell Biochem 2004 Feb 15;91(3):621-32.
8. Green PS, Leeuwenburgh C. Mitochondrial dysfunction is an early indicator of doxorubicin- induced apoptosis. Biochim Biophys Acta 2002 Oct 9;1588(1):94-101.
9. Massart C, Barbet R, Genetet N, Gibassier J.
Doxorubicin induces Fas-mediated apoptosis in human thyroid carcinoma cells. Thyroid 2004 Apr;14(4):263-70.
10. Wang S, Kotamraju S, Konorev E, Kalivendi S, Joseph J, Kalyanaraman B. Activation of nuclear factor-kappaB during doxorubicin- induced apoptosis in endothelial cells and myocytes is pro-apoptotic: the role of hydrogen peroxide. Biochem 2002 Nov 1;367(Pt 3):729-40.
11. Liu X, Chua CC, Gao J, Chen Z, Landy CL, Hamdy R et al. Pifithrin-alpha protects against doxorubicin-induced apoptosis and acute cardiotoxicity in mice. Am J Physiol Heart Circ Physiol 2004 Mar;286(3):H933-9.
12. Uchida Y, Itoh M, Taguchi Y, Yamaoka S, Umehara H, Ichikawa S et al. Ceramide reduction and transcriptional up-regulation of