Exploring Korean Collegians’ Social Commerce Usage: Extending Technology Acceptance Model with Word-of-Mouth and Perceived
Enjoyment
Jihyuk Joo
Depart. of Journalism & Communication, Far East University School of Communication, Northen Arizona University
우리나라 대학생의 소셜커머스 이용에 대한 탐색:
구전효과와 인지적 즐거움으로 확장한 기술수용모형의 적용
주지혁
극동대학교 언론홍보학과 노던아리조나대학교 커뮤니케이션학부
Abstract Social commerce is a combination of social media and shopping. Social commerce, based on Web 2.0 technologies, has the various potentials, which is the factor attracting customers. In Korea, collegians are more active user of social media, in turn, are estimated more active customer in social commerce context.
Present research explored what made Korean collegians use social commerce with extending technology acceptance model(TAM) with word-of-mouth(WOM) and perceived enjoyment(PE). We found that WOM affected indirectly the intention to use(ITU) with mediating PE, in turn, PE has a positive effect on the all of constructs in TAM. Accordingly, TAM extended with WOM and PE is validated in social commerce context.
Finally, based on the findings, implications and suggestions for future studies are discussed.
Key Words : Social Commmerce, Technology Acceptance Model, Word-of-Mouth, Perceived Enjoyment
요 약 소셜커머스는 소셜미디어와 쇼핑의 결합이다
.
웹2.0
기술에 기반을 둔 소셜커머스는 다양한 잠재력을 가지 고 있고,
이러한 잠재력을 통해 소비자를 유인하고 있다.
한국의 대학생들은 소셜미디어 사용에 매우 적극적인데,
소셜커머스 사용에 있어서도 매우 적극적 소비자로 추정된다
.
이러한 관점에서 본 연구는 한국 대학생들이 소셜커머스를 이용하게 하는 것이 무엇인지를 밝히기 위해 구전효과
(Word-of-Mouth)
과 인지적 즐거움(Percieved Enjoyment)
으로 확장한 기술수용모형을 검정했다.
연구결과,
구전효과는 인지적 즐거움을 매개하여 소셜커머스 이용의도에 영향을 미 치고 있었다.
인지적 즐거움은 기술수용모형의 모든 구성개념들에 긍정적 영향을 미치고 있다.
따라서 구전효과와 인지적 즐거움으로 확장한 기술수용모형은 한국의 소셜커머스 맥락에서 유효함이 입증되었다
.
마지막으로 향후 연구를위한 함의와 제안을 제시했다
.
주제어 : 소셜커머스
,
기술수용모형,
구전효과,
인지적 즐거움Received 12 June 2014, Revised 15 July 2014 Accepted 20 August 2014
Corresponding Author: Jihyuk Joo(Far East University) Email: [email protected]
Ⓒ The Society of Digital Policy & Management. All rights reserved. This is an open-access article distributed under the terms of the Creative Commons Attribution Non-Commercial License (http://creativecommons.org/licenses/by-nc/3.0), which permits unrestricted non-commercial use, distribution, and reproduction in any medium, provided the original work is properly cited.
ISSN: 1738-1916
1. Introduction
Social commerce means social media meets shopping[1]. As known, social media is based on Web 2.0 that uses technologies beyond the static pages of earlier web sites. Web 2.0 features more interactive and collaborative internet that emphasize the social interaction and collective intelligence[2]. The Web 2.0 combines e-commerce to result in social commerce.
Generally, most Koreans tend to regard social commerce as group buying or social shopping[3]
because most social commerce firms are based on social networking service(SNS) as platform.
Accordingly, social commerce aims for more customer satisfaction, user participation and social interaction based on crowd-sourcing, consumer-generated content or live shopping[4].
Collegians are reported most using social media in Korea. According to Korea Communications Commission (KCC) and National Internet Development Agency of Korea (NIDA)[5], 76.8% of collegians (including graduate school) are SNS users, as collegians are most outstanding user of social media in Korea. Thus, collegians could be estimated more active and heavier social commerce user.
Present research explores what makes Korean collegians use the social commerce extending technology acceptance model (hereafter “TAM”) with word-of-mouth (hereafter “WOM”) and perceived enjoyment(hereafter “PE”). Theoretically, this research aim to suggest extended TAM for a more powerful and robust model. Practically, spreading social commerce, collegians, outstanding users of social media, are analyzed regarding their social commerce behaviors.
They are, actually, a powerful potential customer with purchasing power in online market. They are familiar with SNS and social commerce prepares diverse assortment of products for them. Thus, understanding their social commerce behavior gives the practitioners implications for future business.
2. Literature Review and Hypotheses
2.1 Word of Mouth
According to Kim and Prabhakar[6], information about an innovation (e.g., social commerce) “is communicated through certain channels over time among the members of a social system”[7](p. 5). In social network theory[8], informal channels (e.g., WOM) of communication plays a primary role in disseminating information to a market when the services are particularly complex and difficult to evaluate[6, 9]. The service quality of social commerce is difficult to evaluate without firsthand experience.
The consumer’s uncertain perceptions about social commerce should be influenced by WOM referrals.
WOM is defined as the informal communication directed at other consumers about ownership, or characteristics of particular goods and services and/or their sellers[10]. WOM is a powerful tool at marketing practice due to following[11]: First, WOM is more credible than commercial sources of information controlled by companies (e.g. advertising, sponsorship).
Most of our discussions are indeed with friends, family, i.e. people we trust and whose goal is not the promotion of a specific company. Second, WOM is really communication, i.e. the message flow tends to be two-way. Third, WOM provides potential consumers with a description of what the experience would be and is thus considered to be a risk reliever, especially for experience goods. According to Buttle[12], “positive WOM occurs when good news testimonials and endorsements desired by the company are uttered, whereas negative WOM is the mirror image”(p. 4).
In previous studies, WOM plays a predictive role in a lot of transaction researches. Analyzing intention to use e-learning with TAM extended with WOM, Lee[13] reports WOM has a positive effect on PE.
Furthermore, Han, Kim, and Lee[14] confirms that
WOM has a positive influence on intention to purchase
at social commerce. Based on these works, present
study sets forth the following hypothesis:
H1. WOM will have a positive effect on PE.
H2. WOM will have a positive effect on intention to use (hereafter “ITU”).
2.2 Perceived Enjoyment
The shopping is a hedonic activity to pursue self-satisfaction. Customers on social commerce act voluntarily and hedonically. They participate in it because they are intrinsically motivated[15].
Accordingly, PE is a key concept to understanding customer’s electronic transaction behavior.
The studies of technology adoption define PE as the extent to which the activity of using a specific system is perceived to be enjoyable in its own right, aside from any performance consequences resulting from system use[16].
In previous studies, PE affects positively technology acceptance model (hereafter “TAM”) constructs:
perceived ease of use (hereafter “PEOU”) and perceived usefulness (hereafter “PU”)[17], and intention to use technologies[15, 18, 19]. Based on these findings, we hypothesize that:
H3. PE will have a positive effect on PEOU.
H4. PE will have a positive effect on PU.
H5. PE will have a positive effect on ITU.
2.3 Technology Acceptance Model
TAM is a prominent theoretical framework employing for identifying adoption of new technology.
TAM is based on two salient behavioral beliefs that affect behavioral intentions: PEOU and PU. Davis[20]
defines PEOU as ‘‘the degree to which a person believes that using a particular system would be free of effort’’ and PU as ‘‘the degree to which a person believes that using a particular system would enhance his or her job performance’’(p. 320).
TAM is valued as a powerful and robust model to explain and predict acceptance of a new technology, whereas TAM has two limitations: First, since the original model aims to be general and parsimonious, it pays little attention to identifying the antecedent of the two salient behavioral belief, PEOU and PU [21, 22].
Futhermore, even though the model is good at identifying factors that influence people’s technology acceptance and use, the model cannot fully explain why people accept and use a particular technology[22, 23].
For overcoming these limitations of TAM, this study aims to extend TAM with WOM and PE.
Since Davis[20], the studies employing TAM have made sure that PEOU affects PU and ITU, in turn, PU affects ITU. Accordingly, present study sets forth the following hypothesis:
H6. PEOU will have a positive effect on PU.
H7. PEOU will have a positive effect on ITU.
H8 PU will have a positive effect on ITU.
Based on the above hypotheses, we illustrate the research model in [Fig. 1].
[Fig. 1] Proposed research model
3. Method
3.1 Sample
The participants chosen for the present study were
565 Korean collegians who had connected to and
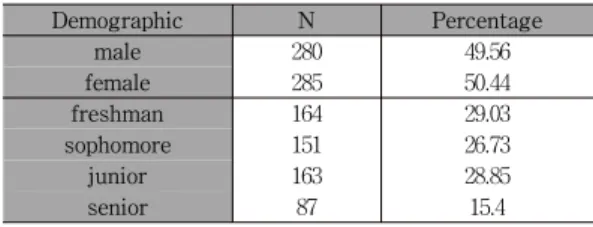
purchased from social commerce services through a convenience sampling method. The demographic profiles are presented in <Table 1>.
As Table 1 shows, 49.56% of the respondents were male with 50.44% female. In terms of education, 29.03%
of the respondents were freshman; 28.85% were junior;
26.85% were sophomore; and 15.4% were senior.
Moreover, as for age, the mean is 22.10 with standard deviation 1.93. The oldest 2 person are 28 years old, whereas the youngest 139 person are 20 years old.
<Table 1> Demographic Profile
Demographic N Percentage
male 280 49.56
female 285 50.44
freshman 164 29.03
sophomore 151 26.73
junior 163 28.85
senior 87 15.4
3.2 Survey Administration and Measurement To test the hypotheses, the present study employed a self-reported survey of Korean collegians who had connected to and purchased from social commerce services. Trained interviewers with a major in communication administered the questionnaires. The survey was administered for two weeks from May 27 to June 10, 2013.
This study tests the effects of WOM, PE, PEOU and PU on intention to use social commerce. The measurement instruments consist of a six-part questionnaire that was modified from previous studies:
demographic, WOM, PE, PEOU, PU, and ITU. The Appendix shows the scales used to measure these items.
3.3 Data Analysis
This study employed PLS path modeling to test structural causalities among the five underlying constructs: WOM, PE, PEOU, PU and ITU. According to Gefen and Straub[24], “PLS merges a factor analysis
with multiple linear regressions to estimate the parameters of the measurement model (item loadings on constructs) together with those of the structural model (regression paths among the constructs) by minimizing residual variance (p. 414).” PLS enables researchers to examine the validity of the discriminant and convergent scales, which is a requisite for examining a new model.
The present study employs the PLS method because it has more advantages than the covariance-based structural equation modeling (SEM) approach such as LISREL and AMOS[25, 26]. Whereas the sample size is emphasized in the SEM approach, PLS is free from it and is appropriate for small sample size research[25-27]. Gefen et al.[27] and Chin[28]
suggested that the minimum sample size in PLS path modeling should be 10 times the number of items related to the most complex variable or constructs.
Moreover, PLS is a proper method for exploratory research[24-26, 28] due to the availability of PLS to test the new model and theory[27]. Accordingly, social commerce is the latest issue and lacks a robust theory base, so the present study employs the PLS method using the SmartPLS 2.0 M3 package.
4. Findings
4.1 Reliability and Validity of Measurement Scale
To examine the reliability and validity of measurement scales, the present study executes PLS Algorithm on Calculate tap of SmartPLS package[29] to get Cronbach’s Alpha(α) and composite reliability
Table 2 shows the overview of PLS quality criteria.
In Table 2, composite reliability is greater than the minimum criterion, 0.7; consequently, the reliability of measurement scales is appropriate for analysis.
Furthermore the Cronbach’s α of constructs are greater
than 0.6, the minimum criterion, and indicates reliable
values.
Original Sample (O)
Sample Mean
(M)
Standard Deviation (STDEV)
Standard Error (STERR)
T Statistics
(|O/STERR|) p Result
H1 WOM→PE 0.330 0.332 0.117 0.117 2.832 p<0.005 supported (one-tailed test)
H2 WOM→ITU 0.131 0.134 0.094 0.094 1.395 - unsupported
H3 PE→PEOU 0.463 0.467 0.087 0.087 5.312 p<0.0005 Supported (one-tailed test) H4 PE→PU 0.463 0.470 0.098 0.098 4.727 t<0.005 Supported
(one-tailed test) H5 PE→ITU 0.286 0.291 0.101 0.101 2.838 p<0.005 Supported
(one-tailed test) H6 PEOU→PU 0.265 0.259 0.119 0.119 2.223 p<0.025 Supported
(one-tailed test) H7 PEOU→ITU 0.065 0.067 0.101 0.101 0.641 - unsupported H8 PU→ITU 0.438 0.430 0.112 0.112 3.918 p<0.005 Supported
(one-tailed test)
<Table 4> Hypotheses Test Results
<Table 2> PLS Quality Criteria Overview AVE Composite
Reliability R Square
Cronbach’s Alpha ITU 0.799 0.923 0.575 0.874 PEOU 0.762 0.906 0.214 0.844 PE 0.659 0.852 0.109 0.743 PU 0.665 0.908 0.398 0.874
WOM 0.745 0.898 0.830
To examine construct validity of the measurement model, this research employs convergent and discriminant validity[30]. To examine convergent validity, present research considers AVE (Average Variance Extracted), of which greater than 0.50 is valid convergent validity [24, 31]. In <Table 2>, AVE in all constructs is over 0.5. Accordingly, we accept that current research achieves the criterion.
To test discriminant validity, we compare the inter-correlations within latent constructs with the root square of AVE of latent constructs. According to Gefen and Straub[32], if the square root of AVE of each construct is greater than its correlations with the other latent constructs, the discriminant validity is significant. <Table 3> indicates that the square root of AVE of construct is appropriate to the criterion respectively.
<Table 3> Latent Construct Correlation
ITU PEOU PE PU WOM
ITU 0.894
PEOU 0.457 0.873
PE 0.616 0.463 0.812 PU 0.703 0.479 0.586 0.816 WOM 0.471 0.377 0.330 0.504 0.863 Parentheses show square root of AVE