A Novel Image Classification Method for Content-based Image Retrieval via a Hybrid Genetic Algorithm and Support Vector Machine Approach
Kwang-Kyu Seo
††
Dept. of Management Engineering, Sangmyung University Sangmyungdae-gil 31, Dongnam-gu, Chonan, Chungnam 330-720, Korea
ABSTRACT
This paper presents a novel method for image classification based on a hybrid genetic algorithm (GA) and support vector machine (SVM) approach which can significantly improve the classification performance for content-based image retrieval (CBIR). Though SVM has been widely applied to CBIR, it has some problems such as the kernel parameters setting and feature subset selection of SVM which impact the classification accuracy in the learning process. This study aims at simultaneously optimizing the parameters of SVM and feature subset without degrading the classification accuracy of SVM using GA for CBIR. Using the hybrid GA and SVM model, we can classify more images in the database effectively. Experiments were carried out on a large-size database of images and experiment results show that the classification accuracy of conventional SVM may be improved significantly by using the proposed model. We also found that the proposed model outperformed all the other models such as neural network and typical SVM models.
Key Words : Genetic algorithm(GA), Support vector machine(SVM), Hybrid model, Content-based image retrieval.
1. INTRODUCTION
As the need for effective multimedia information services is significant, the study on image classification and retrieval methods has become considerably important in various areas such as entertainment, education, digital libraries, and medical image retrieval, etc. Content-based image retrieval (CBIR) techniques are becoming increasingly im- portant in multimedia information systems in order to store, manage, and retrieve image data to perform assigned task and make intelligent decisions. CBIR uses an automatic indexing scheme where implicit properties of an image can be included in the query to reduce search time for retrieval from a large database.
Features like color, texture, shape, spatial relation- ship among entities of an image and also their combination are generally being used for the computation of multidimensional feature vector. The features such as color, texture and shape are known as
primitive features. Images have always been an essential and effective medium for presenting visual data. With advances in today’s computer technologies, it is not surprising that in many applications, much of the data is images. There have been considerable researches done on CBIR using artificial intelligence techniques [1-3].
Recently SVM is receiving much attention with remarkable results in pattern recognition [4-5]. SVM classifies data with different class labels by determin- ing a set of support vectors that are members of the set of training inputs that outline a hyper-plane in the feature space. SVM provides a generic mechanism that fits the hyper-plane surface to the training data using a kernel function. The user may select a kernel function for the SVM during the training process that selects support vectors along the surface of this function.
Although SVM gives good classification performance and generalization ability in pattern recognition, it has two problems such as how to choose the optimal input feature subset, and how to set the best kernel parameters of SVM. These two problems are crucial,
†E-mail : [email protected]
because the feature subset selection influences the appropriate kernel parameters and vice versa.
Therefore, obtaining the optimal feature subset and SVM parameters must occur simultaneously.
In order to overcome these problems of SVM, we propose a hybrid model using genetic algorithm (GA).
GA has been increasingly applied in optimization problems and it is also used to conjunction with other AI techniques. However, few studies have dealt with a hybrid GA and SVM model in an image classification problem for CBIR although there is a great potential for useful applications in this area. GA has the potential to generate both the optimal feature subset selection and parameters of SVM at the same time.
We aim to optimize the parameters and feature subset simultaneously, without degrading the classification accuracy of SVM.
2. RESEARCH BACKGROUND
2.1. Genetic Algorithm (GA)
GAs are computational models of evolution. They operate on the basis of a set of candidate solutions.
Each candidate solution is called a ‘chromosome’, and the entire set of solutions is called a ‘population’.
The algorithm enables iterative transformation from one population of chromosomes to a new population.
Each iteration is called a ‘generation’. There are various forms of GAs. A simple version, which is called a static population model, was used in all the experiments [6. 7].
In the static population model, the population is ranked according to the fitness of each chromosome.
In each generation, two (only two) chromosomes are selected as parents for reproduction. GAs operate iteratively on a population of chromosomes, each of which represents a candidate solution to a given problem, suitably encoded as a string of symbols (e.g., binary code). A randomly generated set of such strings forms the initial population from which the GA starts its search. Three basic genetic operators guide this search: selection, crossover, and mutation.
The genetic search process is iterative: each iteration (generation) involves evaluating, selecting, and
recombining strings in the population, until a given termination condition is satisfied. Evaluation of each string is based on a fitness function that is problem- dependent. It determines which of the candidate solutions are better.
2.2. Support Vector Machine (SVM)
SVMs were first suggested for classification by Vapnik [8] and have recently become an area of intense research, owing to developments in theory and practical techniques [3]. SVMs were motivated by statistical learning theory; the aim was to solve only the given problem, without solving a more difficult problem as an intermediate step. SVMs are based on the principle of structural risk minimization, which is closely related to regularization theory. This principle incorporates capacity control to prevent over-fitting, thus, it is a partial solution to the problem of bias-variance trade-off. Two key elements in the implementation of SVMs are the techniques of mathematical programming and kernel functions.
The parameters are found by solving a quadratic programming problem with linear equality and inequality constraints, instead of solving a non- convex, unconstrained optimization problem.
The basis of SVMs involves finding the best decision boundary space by minimizing structural risk. And, it has been used to solve binary classification problems. SVMs determine a hyper- plane using a special learning algorithm which classifies learning data for an input-vector into two classes. SVMs, which solve multi-dimensional problems in the abstract sense, are actually a replacement for an arduous mapping-function. They map raw data to a multi-dimensional space. Within the feature space they construct an input data set that can be linearly separated and it is used in a kernel function which constructs an input data set and enables the determination of the hyper-plane. The expression below is the RBF kernel function which used in this paper;
k x y ( , ) exp x y –
2(1) σ
2---
=
2.3 Image Features
In this paper, color and texture information are used to represent image features. Color is the dominant component of human perceptions. We used color features to represent images. We used an RGB (Red, Green, Blue) color model and an HSV (Hue, Saturation, Value) color model. The RGB color model is used for many image retrieval systems [9].
For global image representation and fast search, RGB color histograms of the image, which are quantized into 16 bins per R, G, and B coordinates, are extracted. For local information, the image is divided into rectangular regions. The HSV model is closely correlated to human color perception. A set of HSV joint histograms are extracted from each rectangular region, and dominant hue, saturation, and value are used as features in that region.
2.3.1. RGB color model
A histogram is a widely used form of representing an image, which has rotational and translational invariance. A suitable normalization can also provide scale invariance. In this study, we used an RGB color histogram to represent global information about an image.
2.3.2. HSV color model
We used HSV color model for representing color because this model is closely related to human visual perception. Color quantization is useful for reducing the calculation cost. Furthermore, it provides better performance in image classification because it can eliminate the detailed color components that can be considered noises. The human visual system is more sensitive to hue than saturation and value so that hue should be quantized finer than saturation and value.
In the experiments, we uniformly quantized HSV space into 18 bins for hue (each bin consisting of a range of 20 degree), 3 bins for saturation and 3 bins for value for lower resolution.
In order to represent the local color histogram, we divided image into equal-sized 3 × 3 rectangular regions and extract HSV joint histogram that has quantized 162 bins for each region. Although these contain local color information, the resulting repre-
sentation is not compact enough. To obtain compact representation, we extract from each joint histogram the bin that has the maximum peak. Take hue h, saturation s, and value ν associated to the bin as representing features in that rectangular region and normalize to be within the same range of [0, 1]. Thus, each image has the 3 × 3 × 3 ( = 27) dimensional color vector [1].
2.3.3. Texture Feature
Texture analysis is an important and useful area of study in computer vision. Most natural images include textures. Scenes containing pictures of wood, grass, etc. can be easily classified based on the texture rather than color or shape. Therefore, it may be useful to extract texture features for image clustering. Like as color feature, we include a texture feature extracted from localized image region.
The co-occurrence matrix is a two-dimensional histogram which estimates the pair-wise statistics of gray level. The (i, j)
thelement of the co-occurrence matrix represents the estimated probability that gray level i co-occurs with gray level j at a specified displacement d and angle θ. By choosing the values of d and θ, a separate co-occurrence matrix is obtained. From each co-occurrence matrix a number of textural features can be extracted. For image clustering, we used entropy, which is mostly used in many applications. Feature extraction is performed by the following steps:
Step 1: Conversion of color image to gray image Step 2: Dividing image into 3 × 3 rectangular regions as in color case.
Step 3: Obtaining co-occurrence matrix for four (horizontal 0
0, vertical 90
0and two diagonal 45
0and 135
0) orientation in region and normalize entries of four matrices to [0, 1] by dividing each entry by total number of pixels.
Step 4: Extracting average entropy value from four matrices.
(2) Step 5: Constructing texture feature vector by e
p i j ( )log p i j , ( ( ) , )
∑
j∑
i∑
k–
--- k 4 , 1 2 3 4 , , ,
= =
concatenating entropies over all rectangular regions.
Thus, each image has the 3 × 3 ( = 27) dimensional texture vector [1].
3. THE PROPOSED APPROACH USING THE HYBRID GA AND SVM MODEL
This paper proposes a hybrid model to improve the performance of SVM using GA in two aspects:
parameter optimization and feature subset selection.
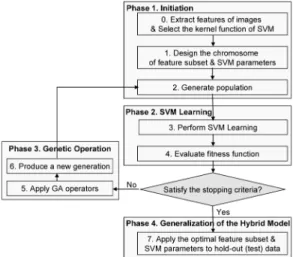
The hybrid model employs GA to optimize both the parameters and feature subset of SVM simul- taneously to classify the images for CBIR. The flowchart of the proposed model is shown in Fig. 1.
The detailed for each step of the proposed model is presented as follows.
Phase 1: Initialization
Before starting the hybrid model, image features should be extracted and the kernel function of SVM be selected. In this paper, color and texture information are used to represent image features. Joint HSV histogram extracted from local region for color and entropies computed from local region for texture are employed. In addition, the radial basis function (RBF) is used as the kernel function of SVM. There are two parameters while using RBF kernels: C and γ. These two parameters play an important role in the performance of SVM [10].
In the first phase, the hybrid model generates the initial population that would be used to find optimal or near optimal feature subset and parameters. The values of the chromosomes for the population are initiated into random values before the search process. To enable GA to find the optimal or near- optimal parameters, we should design the structure of a chromosome, a form of binary strings. The structure of the chromosomes for the proposed model is represented in Fig. 2.
As shown in Fig. 2, the chromosomes for parameters of SVM are encoded as a 16-bit string which consists of 8 bits standing for C and 8 bits standing for γ. The chromosomes for the feature subset are encoded as binary strings standing for some subset of the original feature set list. Each bit of the chromosome represents whether the corresponding feature is selected or not. 1 in each bit means the corresponding feature is selected, whereas 0 means it is not selected. The chromosomes for feature subset are encoded as a 52- bit string which consists of 43 bits standing for color features such as RGB and HSV and 9 bits standing for texture features.
Phase 2: SVM Learning
After generating the initial population, the proposed model performs SVM learning with the randomly selected chromosomes which represent the values of parameters of SVM and feature subset. The performance of each chromosome can be calculated through the fitness function for GA. This study aims to find the optimal or near-optimal parameters of SVM and feature subsets that produce the most accurate image classification. Thus, we set the fitness function (f
T) for the test data set T to the classification accuracy of the test data set which is represented mathematically as follows:
Fitness function = Maximize f (3) Hit
ii 1=
∑
n--- n
= Fig. 1. Flowchart of the hybrid GA & SVM model.
Fig. 2. Gene structure for the hybrid GA & SVM model.
where n is the size of the test data set T, Hit
iis the matched result between the expected outcome (EO
i) and the actual outcome (AO
i), i.e. if EO
i=AO
ithen Hit
iis 1, otherwise Hit
iis 0.
Phase 3: Genetic Operation
In the third step, a new generation of the population is produced by applying genetic operators such as reproduction, crossover, and mutation. According to the fitness values for each chromosome, the chromosomes whose values are high are selected and used for the basis of crossover. The mutation operator is also applied to the population with a very small mutation rate. After the production of a new genera- tion, SVM learning is performed again. These processes are iterated again and again until the stopping conditions are satisfied. When the stopping conditions are satisfied, the genetic search finishes and the chromosome which shows the best classification performance in the last population is finally selected as the final result.
Phase 4: Generalization of the Hybrid Model The optimized parameters of SVM and feature subset determined by GA fit with the training data very well, but they do not fit with the unknown data well. The phenomenon occurs when the parameters and feature subset fit too well with the given training data set. Therefore the proposed model applies the finally selected parameters and feature subset to the holdout (unknown) data in order to check the generalization ability in the last phase.
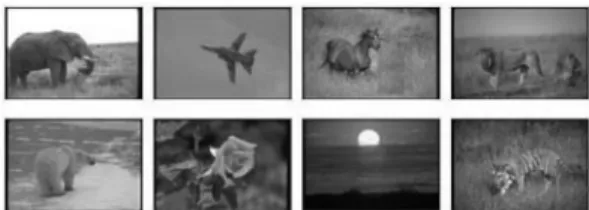
4. EXPERIMENTAL RESULTS In order to evaluate the proposed algorithm, all experiments were performed on a Pentium IV with 512Mb of main memory and 100Gb of storage. All programs were implemented in Visual C++. We collected 1000 images, most with dimensions of 192 × 128 pixels. These were collected from public sources and represent natural scenes such as animals, plants and a airplane. The 1,000 images can be divided into 8 categories, each with 125 images, which are;
elephant, airplane, horse, lion, polar bear, rose, sunset
and tiger. Fig. 3 shows images used in the experi- ments.
Retrieval effectiveness can be defined in terms of accuracy. The accuracy function is as in (4).
(4)
We performed two experiments:
(1) A comparison between the existing classification methods and the proposed hybrid model.
(2) A comparison between the input values according to feature type such as texture, color and joint (color + texture) using the proposed hybrid model.
As mentioned before, we tested four different models for the same data set: (1) neural network (NN) model with multilayer perception [7], (2) typical SVM model [7], (3) Feature Selection using GA for SVM model (FS_SVM), and (4) the proposed model to validate the classification performance of the hybrid model. The data set is randomly split into two subsets: 80% of the data is used for training set and 20% of the data (holdout) is used for validation set.
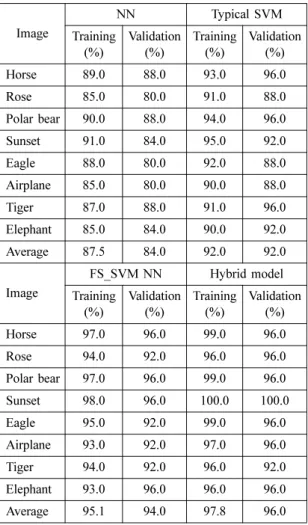
Table 1 presents the classification accuracy of each model including 8 categories and average. As shown in Table 1, the hybrid GA & SVM model has the highest level of classification accuracy (96.0%) in the given holdout data set, followed by the FS_SVM model (94.0%), the typical SVM model (92.0%), and the NN model (94.0%). The results show that hybrid GA & SVM model improves the classification accuracy of typical SVM model by about 4.0% in this data set. The FS_SVM model also improves that of typical SVM model by about 2.0%, so the SVM model integrating GA gives good performance results for image classification problems.
Accuracy Thenumber of clustered imag e Total number of imag e in class ---
=
Fig. 3. Images from the selected 8 categories used in the
experiments.
Table 2 is the comparison of image classification accuracy according to color, texture and the combination of color and texture features using the proposed hybrid model. The result of the experiment according to feature value type was that the combination feature value exhibited the best performance, followed by the color, texture, and texture feature value. In the case of the combination feature value, it had better performance than that in case of using the color, texture feature value, each 4.0%, 15.5%. The result of the experiment shows that image classification must reduce inaccurate classification by considering both color and texture information. In other words, if we depend on only similarity of color in image classification, completely different images could be classified as similar images.
5. CONCLUSION
In this paper, we presented a novel hybrid SVM model using GA to improve the performance of image classification for CBIR. The proposed hybrid model optimizes feature subset and parameters of SVM simultaneously because the selected feature subset has an influence on the appropriate kernel parameters and vice versa. In addition, by selecting optimal feature subsets, it may reduce noises or learning spaces which lead erroneous classification and may enhance the classification accuracy.
Compared to other models such as the NN, the typical SVM and the FS_SVM model, the proposed hybrid model has the highest classification accuracy in the empirical test for real-world images. In additions, we compared the performance of each method according to feature value, texture feature value and combined two feature values extracted by the proposed method.
The result of experiments showed that the method using combined feature value showed the best performance. In other words, it is clear be should consider a combination of color and the texture information to classify images. We expect that our proposed model can be applied into any CBIR system to classify and retrieve the images effectively and efficiently.
In future, we’ll investigate a relevance feedback Table 1. Classification accuracy according to the methods.
Image
NN Typical SVM
Training (%)
Validation (%)
Training (%)
Validation (%)
Horse 89.0 88.0 93.0 96.0
Rose 85.0 80.0 91.0 88.0
Polar bear 90.0 88.0 94.0 96.0
Sunset 91.0 84.0 95.0 92.0
Eagle 88.0 80.0 92.0 88.0
Airplane 85.0 80.0 90.0 88.0
Tiger 87.0 88.0 91.0 96.0
Elephant 85.0 84.0 90.0 92.0
Average 87.5 84.0 92.0 92.0
Image
FS_SVM NN Hybrid model Training
(%)
Validation (%)
Training (%)
Validation (%)
Horse 97.0 96.0 99.0 96.0
Rose 94.0 92.0 96.0 96.0
Polar bear 97.0 96.0 99.0 96.0
Sunset 98.0 96.0 100.0 100.0
Eagle 95.0 92.0 99.0 96.0
Airplane 93.0 92.0 97.0 96.0
Tiger 94.0 92.0 96.0 92.0
Elephant 93.0 96.0 96.0 96.0
Average 95.1 94.0 97.8 96.0
Table 2. Classification accuracy according to feature type using the proposed model.
Image Texture Color Joint
(Color+Texture)
Training(%)
Validation (%)
Training (%)
Validation (%)
Training (%)
Validation (%)
Horse
86.0 84.0 96.0 92.0 99.0 96.0
Rose
82.0 80.0 93.0 92.0 96.0 96.0
Polabear
85.0 80.0 95.0 92.0 99.0 96.0
Sunset
86.0 84.0 97.0 96.0 100.0 100.0
Eagle
85.0 80.0 96.0 92.0 99.0 96.0
Airplane
83.0 76.0 94.0 92.0 97.0 96.0
Tiger
82.0 80.0 93.0 88.0 96.0 92.0
Elephant
83.0 80.0 93.0 92.0 96.0 96.0
Average