• 검색 결과가 없습니다.

Relationship between SOA Adoption and Performance of IT Organizations

N/A
N/A
Protected

Academic year: 2021

Share "Relationship between SOA Adoption and Performance of IT Organizations"

Copied!
8
0
0

로드 중.... (전체 텍스트 보기)

전체 글

(1)

Journal of Internet Computing and Services(JICS) 2016. Aug.: 17(4): 173-180 173

Relationship between SOA Adoption and Performance of IT Organizations

Naghmeh Niknejad

1

Imran Ghani

2

Ab Razak Che Hussin

1

Seung Ryul Jeong

3*1

ABSTRACT

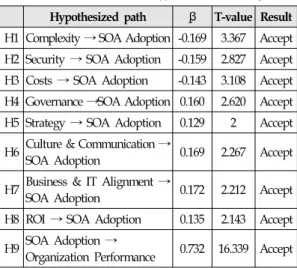
SOA has been adopted by enormous number of organizations world-wide. This study has investigated significant factors which affect SOA adoption in positive and negative manner. Unlike the previous similar studies, where they focused on qualitative analysis for SOA adoption, this study conducted a quantitative analysis to investigate the relationship between the adoption of SOA and the performance of IT organizations. In order to conduct the research, an online questionnaire was created and distributed among SOA experts through the social networking platform of professionals, LinkedIn. Total one hundred and four (104) respondents from thirty (30) different countries participated in this study. The results of this study indicate that there are both positive and negative influences upon SOA adoption. The positive influences includes: governance, strategy, culture and communication, business and IT alignment and ROI;

whereas complexity, security concerns, and costs have negatively affected SOA adoption.

☞ keyword : Service-Oriented Architecture, SOA adoption, TOE Framework, Significant Factors, Effective Factors

1. INTRODUCTION

Service-Oriented Architecture (SOA) is a popular architectural design commonly used to increase organizational agility, promote application adaptability and system interoperability, as well as it provides the reuse of legacy possessions. Successive innovation, competitive emprise and agility are transforming into a significant component of strategic thinking in a large number of current organizations.

Therefore, the growth of information systems has seen an increase in many organizations seeking to re-evaluate their techniques as well as re-examine information technology functions in forming their business strategies.

Though SOA has been used for a decade, however, only a few research studies have been performed on critical success factors that must be concentrated on during such implementations. The results from these few studies show that there are a number of resemblances to success factors found in attaining strategic alignment [1]. Indeed, as has been experienced by other technologies, certain organizations accept

1

Faculty of Computing, Universiti Teknologi Malaysia (UTM), 81310, Skudai, Johor Malaysia

2

School of Information Technology, Monash University Malaysia, 47500, Sunway Campus, Malaysia.

3

Graduate School of Business IT, Kookmin Univ., Korea

*

Corresponding author ([email protected])

SOA as being a perfect and precise technology. Conversely, others tend to reject it for being perceived as not that much effective.

However, it is obvious that no one ignores the achievements which SOA has brought about in the cases of efficiency, reusability, agility and productivity of an enterprise [2]. A famous technology and market research company, Forrester Research, executed a study [3] claiming that the use of SOA has increased from 44% in North-American, European and Asian-Pacific companies to a rate of 63%. Similarly, a variety of conferences on the pattern of SOA have been held since 2002. These conferences included, namely: International Conference on Web Services (ICSOC), the IEEE International Conference on Web Services (ICWS), the International Conference on Services Computing (SCC) and the European Conference on Web Services (ECOWS). Consequently, a substantial awareness of SOA exists in the domain of educational studies and industry practitioners. It is assumed that many companies performing something connected to SOA [4].

One frequent problem with SOA adoption is that many associations initiate the project of adopting SOA from the view point of an IT prospect rather than a business one. Regarding the technical perspectives of the project, implementations might emerge successful. However, the effect of the adoption of the ISSN 2287-1136 (Online)

http://www.jksii.or.kr

(2)

new architecture on the business cannot be recognized without having been counted right from scratch. Difficulties like these are mainly noticed in large associations with well-founded IT departments which try to follow every new technological trend.

Not surprisingly, the lack of business alignment with the SOA movement project is a definite result of weak project planning.

The most likely negative consequence of such mistakes is the increasing expense of IT without any return on investment (ROI) for the corporation [5].

Despite important advances which have been observed in SOA experiences, at the enterprise level the adoption of SOA is a complicated and a long-term process in practice. Studying on how to expand SOA into organizational context is very scarce [6]. Besides, SOA development stays at a new stage and primitive adopting enterprises find it hard to make efficient strategies to adopt the framework, particularly when they could not be certain of its successful implementation [7].

Additionally, MacLennan and Van Belle, in their study, expressed that according to the fast emergence of SOA as one of the main architectural methods to implement enterprise architecture management, SOA adoption empirical research is rare [8]. Thus, the main purpose of this paper is to investigate the impact of SOA adoption at organizational level.

2. RELATED SOA ADOPTION RESEARCHES

SOA is one of the most remarkable technologies emerged in the area of information system architecture and design in the world of modern technology and has been proved to be a significant integrated paradigm in many sectors including healthcare [9][10], banking [11][12], education [13] etc. From a service-oriented observation, everything can seem like a service. Service is a fundamental construction unit of SOA and is a valuable technique for accessing repeatable business capabilities [14].

Often, organizations can become involved in SOA projects with no proper up-front analysis of their needs having been undertaken [15]. IBM presented some of their findings concerning a considerable number of firms that adopted SOA and recommended different domain of SOA adoption challenges, namely: program management, firm, technology

and governance. The most sophisticated of these areas are organization and governance, since the whole organization needs to change the styles, methods of communication, tool of collaboration, and different ways of reportage relationships [16].

SOA adoption requires an important transformation to be made in both business process philosophy and technology foundation. This attempt is governed by the promise of important benefits [17]. It is investigated that SOA adoption will help organizations with, specifically: enhanced interoperability, legacy integration, reuse, organizational agility, composability, standardized data demonstration and vendor-neutral communication fundamentals [18]. These can be translated into specific business advantages such as:

enhanced flexibility, improved speed to the marketplace, incremental deployments, and enhanced productivity as well as other probable benefits [19]. While the economic value transferred by SOA drives acceptance of organizational decisions, this value is not simple to review or even identify [20][21].

Each organization should be aware that adopting SOA cannot be the only correct solution to their particular requirements. They should recognize that deploying SOA will not solve all of their problems. Some SOA myths can lead to a delusion about the entity of SOA and how it may actually help firms.

Seth et al. [22] expressed in their research about a report that was carried out by Frost and Sullivan in August 2009, concerning changes to the marketplace in India. The report stated that the field of SOA is at an early stage and remains untapped by sellers [22].

As a result, it can be said that the main obstacles for selecting and using SOA are not caused by trade administration; in fact, they originate from IT organizations.

A considerable number of individuals in IT organizations consider SOA as just a notion and a series of technologies and infrastructure by which to represent, protect, implement and control services [23].

3. METHODOLOGY

Due to the preliminary aim of this study and the target

(3)

groups of this research which are IT experts and SOA professionals (and since the authors do not have sufficient knowledge about the target groups who are able to participate in this research), it was decided to use non-probabilistic sampling and a self-selecting technique [24].

Using this method, an online questionnaire was distributed among SOA professionals through LinkedIn by sending separate emails to them. The questionnaire is available on the following link:

https://docs.google.com/forms/d/12JiAjWoZQEZg68KTBN bjfVq2qDV9lKR-Y7GGn6DAZKk/viewform

The questionnaire was sent to a total 369 potential respondents that belong to thirty (30) countries. Finally, a total of 104 responses were acquired as a result of data sampling.

Moreover, the research team used an excel file as a database to save the name of each professional that the questionnaire was sent to. The file also recorded any feedback received from the experts for analysis purpose.

Besides, for analyzing the findings of the study in order to determine the association and the strength of the connections between factors, a number of SOA adoption and organizational performance researchers used SmartPLS software [25].

Since the number of the target population was not clear, it was slightly difficult to estimate the response rate. According to Oates [26], the rate of the questionnaire response should be somewhere between 10 to 30 percent. From the data available to the authors, the rate of the questionnaire response can be predicted up to 28.2 % (104/369).

4. RESEARCH FRAMEWORK AND HYPOTHESIS DEVELOPMENT

Consistent with the papers reviewed for this study, authors extracted eight most significant factors impacting on SOA adoption in organizations, based on the TOE framework. The selected factors indicated the presence of some performance factors such as: ROI, business and IT alignment, as well as culture and communication. As a result, authors were able to measure the effects of all factors with respect to the performance of the whole organization. All factors have a positive impact on SOA adoption, with the exception of SOA complexity, security concern, and costs, which have a negative

impact. Figure 1 represents the primary framework with the relations between the components of the framework and relevant hypotheses. This framework consists of eight independent and two dependent constructs (SOA Adoption and Organization Performance).

(Figure 1) Research Framework– Examining the Impact of SOA Adoption on the Performance of

Organizations

In addition, this study established nine hypotheses which were proposed and evaluated using SmartPLS software. The hypotheses are presented in Table 1.

(Table 1) The Proposed Hypothesis of Relationship between Variables in this Study

H1 The complexity of SOA Technology negatively influences the adoption of SOA.

H2 Security concerns negatively influence SOA adoption.

H3 Costs negatively influence on SOA adoption

H4 SOA governance positively affects the adoption of SOA in organizations.

H5 SOA strategy positively influences SOA implementation.

H6 Culture and communication positively influence on adopting SOA.

H7 Business and IT alignment positively influence SOA adoption.

H8 Return on Investment positively affects SOA adoption.

H9 SOA adoption has a positive influence on the performance

of an organization.

(4)

5. DATA ANALYSIS AND FINDINGS

In the following section the data collected from respondents are analyzed and the graphs are drawn using Microsoft Excel.

“N” is referred to the number of experts participated, which are 104.

5.1 JOB POSITION OF THE RESPONDENTS

Figure 2 illustrates that more than half of the respondents (59%) belonged to IS/IT/Technical Architects group. The next largest group participating in this research were CIO, CTO, Chief Technical Architects, CSO/CISO, VP of IS/IT (17%) as well as IS managers, planners, and directors (13%) respectively. The rest of the respondents comprised IT staff (3%) and other IT managers in IS department (4%).

(Figure 2) Respondents Position in Organizations (N=104)

5.2 INDUSTRY OF THE RESPONDENTS

Figure 3 indicates that most of the participants (26.92%) belonged to the consulting and business services industry.

Telecommunications/ISP represented (18.27%) of the participants, followed by: IT vendors (15.38%), financial services/banking (9.62%), and organizations of government (7.69%). The rest of the participants from different sectors are represented by less than five percent.

5.3 NUMBER OF EMPLOYEES

As shown in Figure 4 most of the participants were working in either large or very large companies. About 27% were from

companies having 500 to 5000 employees and 46% are from companies with more than 5000 employees. 15% of the respondents are working in medium size companies numbering between 50 to 499 employees. Small companies are represented by 12% of the participants.

(Figure 3) The Industry of the Participants’

Organizations (N=104)

(Figure 4) Number of Employees in the Participants’

Organizations (N=104)

5.4 SUCCESS OF SOA PROJECT

More than half of the participants (54%) indicated that their

respective organizations had been partially successful in

developing SOA, while 31% of respondents claimed that their

organizations had achieved complete success in implementing

SOA. Only 8% of respondents indicated that their SOA

(5)

implementation had not been successful, while 7% of participants stated that it was too early to determine the relative success or failure of SOA implementation in their organizations. As it is clearly demonstrated in Figure 5, nobody stated that their SOA project implementation was a fiasco.

(Figure 5) Success of SOA Project (N=104)

5.5 STAGE OF SOA ADOPTION

As it is shown in Figure 6, a large number of participants (62%) indicated that their SOA deployments are in production.

A total of 33% reported SOA deployments in production at enterprise level and 29% confirmed deployment in production for use in multiple departments. Some 14% of the respondents pointed out that their SOA implementation projects are still in the pilot stage, while 8% of them indicated that they are in production for use in a single department. The rest of the respondents (16%) pointed that their SOA projects are in the development stage.

(Figure 6) Stage of SOA Adoption (N=104)

5.6 SOA INITIATIVE APPROACH

Figure 7 shows the approach of respondents to the SOA initiative. As can be seen, 38% of respondents indicated that their SOA was driven by IT Strategy. Further, 37% revealed

that they used a top-down approach which was driven by business strategy to IT strategy. Only 15% of participants confirmed that they used a bottom-up approach which was driven by IT strategy to business strategy. The rest of the participants (10%) stated that they used other approaches to the SOA initiative.

(Figure 7) Approach of the Organization for Starting SOA (N=104)

5.7 RECOMMENDATION BY SOA EXPERTS

Based on the objectives of this study, a questionnaire was designed to analyze the recommendations of SOA professionals to successfully adopt SOA based on their own experiences.

It is evident from Figure 8 that the majority of experts (24%) agreed with developing an architectural style having a vision for the future. There was also a recommendation for the creation of an organizational culture and the skills to support SOA (22%). Eighteen percent of experts (18%) believed that enabling operational visibility through governance and service management helps organizations to adopt SOA successfully.

Thirty percent (30%) of professionals accepted that building a scalable infrastructure (15%) and foreseeing linkages from IT to the business processes (15%) assisted organizations to adopt SOA successfully. Six percent (6%) of professionals wrote their own recommendations in the “Other” field.

(Figure 8) Recommendations by SOA Experts

(6)

The hypothesis results are depicted in Table 2 below. In addition, this table shows the consequences of the relationships which are proposed for this study.

(Table 2) The Result of Hypothesis Testing Hypothesized path β T-value Result H1 Complexity → SOA Adoption -0.169 3.367 Accept H2 Security → SOA Adoption -0.159 2.827 Accept H3 Costs → SOA Adoption -0.143 3.108 Accept H4 Governance →SOA Adoption 0.160 2.620 Accept H5 Strategy → SOA Adoption 0.129 2 Accept

H6 Culture & Communication →

SOA Adoption 0.169 2.267 Accept

H7 Business & IT Alignment →

SOA Adoption 0.172 2.212 Accept

H8 ROI → SOA Adoption 0.135 2.143 Accept

H9 SOA Adoption →

Organization Performance 0.732 16.339 Accept

Table 2 includes the t-value and the coefficient for the relationship between each factor and SOA adoption. It also illustrates the effect of SOA adoption on organizational performance. As is clear in this table, complexity, security and costs have a negative effect on SOA adoption while factors such as: governance, strategy, culture and communication, business & IT alignment and ROI positively affect it.

Moreover, SOA adoption itself has a positive impact on organizational performance.

Squared multiple correlation coefficient is used to measure the correlation between independent and dependent variables.

Table 3 shows that the correlation between contributing factors and SOA adoption is 0.86 and the correlation between SOA adoption and organizational performance is 0.54. This means that contributing factors have an 86% influence rate on SOA adoption. Conversely, SOA adoption impacts on the performance of organizations at a rate of 54% based on data collected in this study.

(Table 3) R Square

R Square Organizational Performance 0.535200

SOA Adoption 0.860012

6. CONCLUSION AND FUTURE WORK

This study was conducted to specify the significant factors which affect the adoption of SOA in organizations. The study shows the relationship between key success factors and SOA adoption in relation to the performance of organizations. Eight factors have been extracted from previously published papers extending from 2009 until 2013.

Moreover, a conceptual framework is provided to show the relationship between key factors, SOA adoption and the impact of SOA adoption on the performance of organizations. It is anticipated, the proposed model facilitates the process of SOA adoption in organizations. So, this might help organizations which not adopt SOA to promote their chance of development.

Additionally, this study may help organizations to know the most important factors that influence SOA adoption in their organizations. Moreover, the results of this study open beneficial opportunities for future researches in the area of SOA adoption. It is recommended to use qualitative and quantitative research methods in order to recognize the correlation between other dimensions of SOA adoption with the key factors which this study focused on. In addition, the proposed framework would give the same idea of measuring the organizational performance more deeply for researchers.

Acknowledgement

We are thankful to Universiti Teknologi Malaysia (UTM) and Ministry of Science, Technology and Innovation (MOSTI), Malaysia for funding this project under Vot No: 4S113.

References

[1] S. Emadi and R. H. Hanza, “Critical Factors in the Effective of Service-Oriented Architecture,” Advances in Computer Science: an International Journal, vol. 2, no.

3, 2013, pp. 26–30.

http://citeseerx.ist.psu.edu/viewdoc/summary?doi=10.1.1.

404.84

[2] T. Erl, “SOA: Principles of Service Design”, (Vol.1).

Prentice Hall, Upper Saddle River, 2008.

(7)

[3] R. Heffner, “SOA Adoption: Budgets Don't Matter Much”, White Paper, Forrester Research, Cambridge, MA, 2008.

[4] H. Luthria and F. Rabhi, “Using service oriented computing for competitive advantage,” AMCIS 2009 Proceedings, Paper 140.

http://aisel.aisnet.org/amcis2009/140

[5] M. Galinium and N. Shahbaz, “Success factors model:

Case studies in the migration of legacy systems to Service Oriented Architecture”, In Computer Science and Software Engineering (JCSSE), 2012 International Joint Conference on IEEE, May, 2012, pp. 236-241.

https://dx.doi.org/10.1109/JCSSE.2012.6261958 [6] R. Wang, S. Huang, W. Su, and A. Li, "The Methodology,

Platform and Solution for Service-Oriented Enterprise."

In Services Computing (SCC), 2013 IEEE International Conference on. IEEE, 2013, pp. 747-748.

https://dx.doi.org/10.1109/SCC.2013.21

[7] J. H. Lee, H.-J. Shim, and K. K. Kim, “Critical Success Factors in SOA Implementation: An Exploratory Study,”

Information systems management 27, vol. 27, no. 2, 2010, pp. 123–145.

https://dx.doi.org/10.1080/10580531003685188

[8] E. MacLennan and J. P. Van Belle, “Factors affecting the organizational adoption of service-oriented architecture (SOA),” Information Systems and e-Business Management, vol. 12, no. 1, 2014, pp. 71–100.

https://dx.doi.org/10.1007/s10257-012-0212-x

[9] K. Koumaditis and M. Themistocleous, “Organizational structures during SOA implementation: the case of a Greek healthcare organization,” Transforming Government:

People, Process and Policy, vol. 9, no. 3, 2015, pp. 263 –285.

http://dx.doi.org/10.1108/TG-12-2014-0062

[10] K. Koumaditis, M. Themistocleous, and P. R. Da Cunha,

“SOA implementation critical success factors in healthcare,”

Journal of Enterprise Information Management, vol. 26, no. 4, 2013, pp. 343–362.

http://dx.doi.org/10.1108/JEIM-06-2012-0036

[11] M. Themistocleous, N. Basias, and V. Morabito, “A Framework for Service-oriented Architecture Adoption in e-Banking: the Case of Banks from a Transition and a Developed Economy,” Information Technology for

Development 21, vol. 21, no. 3, 2015, pp. 460–479.

http://dx.doi.org/10.1080/02681102.2014.939605 [12] N. Basias, M. Themistocleous, and V. Morabito, “SOA

adoption in e-banking,” Journal of Enterprise Information Management 26, vol. 26, no. 6, 2013, pp. 719–739.

http://dx.doi.org/10.1108/JEIM-07-2013-0042

[13] M. Mircea, “SOA adoption in higher education: a practical guide to service- oriented virtual learning environment,”

Procedia-Social and Behavioral Sciences 31, vol. 31, no.

2011, 2012, pp. 218–223.

http://dx.doi.org/10.1016/j.sbspro.2011.12.045

[14] M. Matsumura, B. Brauel, and J. Shah, “SOA adoption for dummies,” Wiley, 2009.

[15] G. Lewis, E. Morris, S. Simanta, and L. Wrage, “Common Misconceptions about Service-Oriented Architecture:

Commercial-off-the-Shelf (COTS)-Based Software Systems,”

ICCBSS’07. Sixth International IEEE Conference, Feb, 2007, pp. 123–130.

https://dx.doi.org/10.1109/ICCBSS.2007.9

[16] R. Varadan, K. Channabasavaiah, S. Simpson, K. Holley, and A. Allam, “Increasing business flexibility and SOA adoption through effective SOA governance,” IBM Systems Journal 47, no. 3, 2008, 473-488.

https://dx.doi.org/10.1147/sj.473.0473

[17] T. Erl, Service-oriented architecture: concepts, technology, and design. Pearson Education, India, 2005.

[18] H. Demirkan, R. J. Kauffman, J. A. Vayghan, H.-G. Fill, D. Karagiannis, and P. P. Maglio, “Service-oriented technology and management: Perspectives on research and practice for the coming decade,” Electronic Commerce Research and Applications 7, vol. 7, no. 4, 2009, pp. 356 –376.

https://dx.doi.org/10.1016/j.elerap.2008.07.002

[19] L. Walker, “IBM business transformation enabled by service-oriented architecture,” IBM Systems Journal 46, vol. 46, no. 4, Dec., 2007, pp. 651–667.

https://dx.doi.org/10.1147/sj.464.0651

[20] R. O’Sullivan, T. Butler, and P. O’Reilly, “Realizing the business value of service-oriented architecture: the construction of a theoretical framework,” In Proceedings of the 6th European Conference on Information Management and Evaluation, 2012, pp. 258–266.

[21] B. Mueller, G. Viering, C. Legner, and G. Riempp,

(8)

◐ Authors ◑

Naghmeh Niknejad

2014, Master in IT Management, Universiti Teknologi Malaysia (UTM)

2014~Present Ph.D. candidate Information Systems at Universiti Teknologi Malaysia (UTM).

Research interests: Information Systems, Cloud Computing, Web Applications, and Service Oriented Architecture.

Email: [email protected]

Imran Ghani

2002, Master of Information Technology, University of Arid Agriculture Rawalpindi, Pakistan.

2006, MSc. Computer Science, Universiti Teknologi Malaysia (UTM).

2010 Ph.D. Kookmin Univ, Seoul, Korea.

July 2016~Present: Senior Lecturer, School of Information Technology, Monash University Malaysia.

Research Interests: Agile Methods, SOA, Semantic Web, Cloud Email: [email protected]

Ab Razak Che Hussin

2006, Ph.D in Trust in e-Commerce, University of Manchester, UK.

Current: Senior lecturer at Universiti Teknologi Malaysia (UTM).

Research interests: Information System, Web Application, and Trust and Privacy in e-Commerce.

Email: [email protected]

Seung Ryul Jeong

1989 M.S. in MIS, Univ. of Wisconsin, WI, U.S.A.

1995 Ph.D. in MIS, Univ. of South Carolina, SC, U.S.A.

1997~Present: Professor, Graduate School of Business IT, Kookmin Univ., Korea

Research Interests: System Implementation, Process Innovation, Project Management, Information Resource Management etc.

E-mail : [email protected]

“Understanding the economic potential of service- oriented architecture,” Journal of Management Information Systems 26, vol. 26, no. 4, 2010, pp. 145–180.

https://dx.doi.org/10.2753/MIS0742-1222260406 [22] A. Seth, A. R. Singla, and H. Aggarwal, “Service Oriented

Architecture Adoption Trends: A Critical Survey,”

Communications in Computer and Information Science, Aug., 2012, pp. 164–175.

https://dx.doi.org/10.1007/978-3-642-32129-0_21

[23] K. Holley, J. Palistrant, and S. Graham, “effective SOA governance,” IBM White Paper, IBM Corporation, 2006.

[24] J. Ronald D. Fricker, “Sampling Methods for Web and E-mail Surveys,” 2008, pp. 195–216.

[25] J. Joseph F. Hair, G. T. M. Hult, C. M. Ringle, and M.

Sarst, “A Primer on Partial Least Squares Structural Equation Modeling (PLS-SEM),”Sage Publications, 2013.

[26] B. J. Oates, “Researching Information Systems and

Computing”, Sage Publication, 2005.

수치

Figure  3  indicates  that  most  of  the  participants  (26.92%)  belonged  to  the  consulting  and  business  services  industry
Figure  7  shows  the  approach  of  respondents  to  the  SOA  initiative.  As  can  be  seen,  38%  of  respondents  indicated  that  their  SOA  was  driven  by  IT  Strategy
Table  2  includes  the  t-value  and  the  coefficient  for  the  relationship  between  each  factor  and  SOA  adoption

참조

관련 문서