Long-Term Investigation of Regional Topographic Effects on
Soil Chemical Properties and Heavy Metal Concentrations in Paddy Fields
Byung-Koo Ahn, Seong-Soo Kang1, Jae-Yeon Shin2, and Jin-Ho Lee2*
Jeollabuk-do Agricultural Research and Extension Services, Iksan 570-704, Korea
1National Academy of Agricultural Science, RDA, Suwon 441-707, Korea
2Department of Bioenvironmental Chemistry, Chonbuk National University, Jeonju 561-756, Korea
Topographic conditions of agricultural fields work as a important factor to identify different soil properties.
This study was conducted to investigate the selected soil chemical properties and the concentrations of heavy metals, Cd, Cr, Pb, Cu, Ni, and Zn, in the paddy fields of different topographic areas at four year intervals from 1999 to 2011. Three-hundred soil sampling sites in the paddy fields were selected from the different topographic areas that were local valley and fans, fluvio-marine deposits, alluvial plains, and diluvial terraces.
The mean values of soil pH ranged 5.7∼5.8 that were within optimal range for rice cultivation. The mean values of other properties such as soil organic matter (SOM) content, the concentrations of exchangeable cations, K+, Ca2+, and Mg2+, and available silicate concentration were lower or close to the optimal values, but the mean concentrations of available phosphorus were exceeded the range of optimal value, 80∼120 mg kg-1, in many paddy fields. In particular, The concentrations of available phosphorus in the paddy fields of local valley and fans, alluvial plains, and fluvio-marine plains were mostly declined. However, in diluvial terrace areas, the phosphorus concentrations unexpectedly increased; furthermore, they were significantly higher than those in other topographic areas. The mean concentrations of 0.1 M HCl-extractable heavy metals, Cd, Cr, Pb, Cu, Ni, and Zn, in the paddy fields were slightly and gradually declined during the study years, but the Pb concentrations were not statistically changed. In addition, the concentrations of heavy metals were widely ranged depending on the different sampling sites. Nevertheless, the concentrations of heavy metals were significantly lower than the levels of Soil Contamination Warning Standard (SCWS) for agricultural lands (1-region) presented in Soil Environment Conservation Law (SECL).
Key words: Paddy field, Soil chemical property, Heavy metal, Topography
Received : 2012. 8. 20 Accepted : 2012. 9. 12
*Corresponding author : Phone: +82632702545 E-mail: [email protected]
Introduction
Soils has been greatly influenced by topographic conditions. The topographic condition of an agricultural field in small local areas is one of the most important factors to identify difference of soil properties as comparing with other fields (Jung and Kim, 1988).
Thus, topographic-base investigations for soil properties would be very efficient to have valuable information for utilizing and managing the agricultural lands.
Topographic distribution of agricultural lands in Korea includes local valley and fans, fluvio-marine deposits, alluvial plains, diluvial terraces, mountain footslopes, hillslopes, mountains, and lava plains. Paddy fields in Korea are mostly located in all the topographic areas,
except in hillslopes and mountains (Hyeon et al., 1989) even though the parent materials of soils and the types of soil formation are different.
Areas of agricultural lands in Jeonbuk province, Korea were 209,800 ha, which were 12.0% of total agricultural lands in Korea. Also, areas of paddy fields in Jeonbuk province were 142,600 ha that were 68.0%
of total agricultural lands in the province (Jeollabuk-Do, 2007). For these reasons, many researches about paddy fields in the province were mostly related to rice productivity with improving soil fertility instead of environmental viewpoint with topographic aspects.
Therefore, objective of this study was to investigate selected soil chemical properties and heavy metal, Cd, Cr, Pb, Cu, Ni, and Zn, concentrations in the paddy fields of different topographic areas.
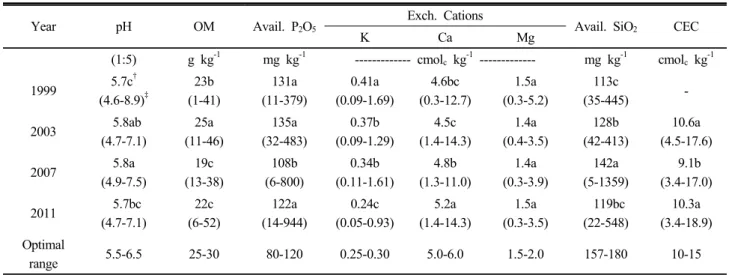
Table 1. Mean values of selected soil chemical properties in paddy fields during the study years.
Year pH OM Avail. P2O5
Exch. Cations
Avail. SiO2 CEC
K Ca Mg
(1:5) g kg-1 mg kg-1 --- cmolc kg-1 --- mg kg-1 cmolc kg-1
1999 5.7c†
(4.6-8.9)‡
23b (1-41)
131a (11-379)
0.41a (0.09-1.69)
4.6bc (0.3-12.7)
1.5a (0.3-5.2)
113c
(35-445) -
2003 5.8ab
(4.7-7.1)
25a (11-46)
135a (32-483)
0.37b (0.09-1.29)
4.5c (1.4-14.3)
1.4a (0.4-3.5)
128b (42-413)
10.6a (4.5-17.6)
2007 5.8a
(4.9-7.5)
19c (13-38)
108b (6-800)
0.34b (0.11-1.61)
4.8b (1.3-11.0)
1.4a (0.3-3.9)
142a (5-1359)
9.1b (3.4-17.0)
2011 5.7bc
(4.7-7.1)
22c (6-52)
122a (14-944)
0.24c (0.05-0.93)
5.2a (1.4-14.3)
1.5a (0.3-3.5)
119bc (22-548)
10.3a (3.4-18.9) Optimal
range 5.5-6.5 25-30 80-120 0.25-0.30 5.0-6.0 1.5-2.0 157-180 10-15
†Numbers followed by the same letter within a column are not significantly different (Duncan test, p<0.05).
‡Range of values determined in this study.
Materials and Methods
This study was conducted from 1999 to 2011 in 14 different counties in Jeonbuk province, Korea. Three- hundred soil sampling sites in paddy fields were selected from the different topographic areas that were local valley and fans, fluvio-marine deposits, alluvial plains, and diluvial terraces. Soils were collected from 0 to 15 cm depth of surface soil in the paddy field during March to April at four year intervals from 1999: 2003, 2007, and 2011. Soil samples were air- dried, crushed to pass through a 2-mm sieve and used for determining the selected chemical properties and heavy metal concentrations. The detailed description of soil sampling information was shown in a previous report (Ahn et al., 2012).
The selected chemical properties of soils were de- termined using the procedures proposed by National Institute of Agricultural Science and Technology (NIAST), Rural Development Association (RDA), Korea (2000, 2010). Soil pH was measured using soil-to-water ratio of 1:5 with a pH meter (Thermo, Orion 3 star). Soil organic matter content was de- termined by Tyurin titrimetric method. Exchangeable cations were determined by 1.0 M ammonium acetate (CH3COONH4) extraction method. The determining procedures for other soil properties were also presented in a previous report (Ahn et al., 2012).
The concentrations of heavy metals, Cd, Cr, Pb, Cu, Ni, and Zn, in soils of the paddy fields were deter- mined as 0.1 M HCl-extractable metal concentrations.
Ten grams (10 g) of soil samples were weighed and transferred into a 125 mL conical flask with adding 50 mL of 0.1 M HCl. The mixture was agitated for 30 min on a reciprocal shaker set at a speed of 180 cycle min-1, and filtered by Advantec Grade No. 6 ashless filter paper to obtain clear extract. The heavy metal concentrations were analyzed using an inductively coupled plasma (ICP) spectrometers (GBC, Integra, Australia).
Pearson correlation analysis (SPSS 12.0 K) was used to evaluate the relationship between the parameters related to different results of soil properties and heavy metal contents. Results were evaluated with 95%
confidence intervals, which were presented as p<0.05 levels of significance.
Results and Discussion
The mean values of selected soil chemical properties in the paddy fields determined at four year intervals from 1999 are shown in Table 1. Soil pH values slightly increased until 2007 but decreased in 2011.
However, the changes of soil pH were within optimal range for rice cultivation. The contents of soil organic matter (SOM) increased from 23 g kg-1 in 1999 to 25 g kg-1 in 2003 but then the SOM contents significantly decreased by 19 g kg-1 in 2007 because during the second interval period, rice straw in most paddy fields were removed to use in livestock feed. The concentrations of available phosphorus were only reduced from 135 mg kg-1 down to 108 mg kg-1 in
Fig. 1. Soil pH values and soil organic matter contents in the paddy fields as influenced by different topographic locations. ○, Local valley and fans; ●, Alluvial plains; □, Fluvio-marine plains; ■, Diluvial terrace.
2007. The concentrations of exchangeable K+ were continuously declined from 0.41 cmolc kg-1 in 1999 to 0.24 cmolc kg-1 in 2011. The decreases of available phosphorus and exchangeable K+ might be also caused by the removal of rice straw from the paddy fields.
Nonetheless, exchangeable Ca2+ concentrations in the paddy fields were tended to increase, and exchangeable Mg2+ was not changed during the study years.
The concentrations of available silicate gradually increased until 142 mg kg-1 in 2007 but then dropped down to 119 mg kg-1 in 2011. The available silicate concentrations were widely ranged between 5 and 1,359 mg kg-1 depending upon the sampling sites. The variability of available silicate concentrations in the different paddy fields might be caused by farmer’s avoidance to use silicate fertilizer supplied by Korean government because of the difficulties of its treatment and transport. Accordingly, agricultural scientists need to give the farms right and positive information about silicate fertilizer to enhance its application for im- proving soils of their paddy fields (Ahn et al., 2012).
Exchangeable cation capacity (CEC) in the fields was only dropped down in 2007. It might be also come from decrease of SOM content caused by the rice straw removal. These results were also similar to the results of changes in soil chemical properties reported by NIAST (2008).
As comparing between optimal values of the selected soil chemical properties for rice cultivation and the values determined in this study, the soil pH values in the optimal range were from 53.0% to 81.7%. SOM contents were between 9.7% and 29.3%.
Available phosphorus concentrations were from 19.0%
to 44.3%. Exchangeable K+ concentrations were be- tween 12.7% and 20.7%. Available silicate concentrations
in the range were from 4.7% to 9.3%. In particular, the concentrations of available phosphorus were exceeded the range of optimal value, 80∼120 mg kg-1, in many paddy fields. The paddy fields containing excess available phosphorus were between 30% and 53%
during the study years. Thus, runoff water from the paddy fields containing excess available phosphorus would cause the eutrophication of streams and rivers (Cho et al., 2002; Lee et al., 2012).
Topographic distribution of paddy fields in Jeonbuk province, Korea was 43% local valley and fans, 39.3%
fluvio-marine deposits, 15.0% alluvial plains, and 2.7%
diluvial terraces (Kim, 2008). Figure 1 shows long- term investigation results of topographic effects on the changes in soil pH and SOM content in the paddy fields. Soil pH values ranged between 5.7 and 5.8 in all the topographic areas, which were statistically similar to a pH value, 5.7, reported by Sohn (1999).
The contents of SOM decreased in the paddy fields of diluvial terraces until 2007 and then increased in 2011, whereas the SOM contents in other topographic areas were up and down during the study years. In addition, the mean contents of SOM in the paddy fields of Jeonbuk province ranged between 22 g kg-1 and 25 g kg-1, which were lower than optimal contents (25~30 g kg-1). Also, the SOM contents were simi- lar to 22~23 g kg-1 determined in paddy fields of Gyeongnam province (Lee et al., 2012).
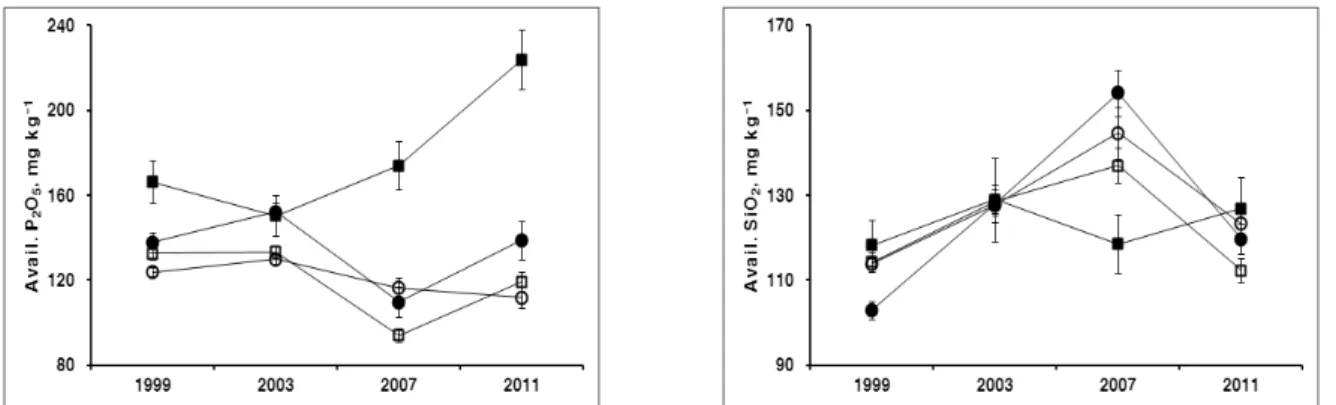
The concentrations of available phosphorus in the paddy fields of local valley and fans, alluvial plains, and fluvio-marine plains were mostly declined during the study years. However, in the areas of diluvial terraces, the phosphorus concentrations gradually increased and were significantly higher than those in other topographic areas, especially from 2007. Ahn et
Fig. 2. The concentrations of available P2O5 and available SiO2 in the paddy fields as influenced by different topographic locations. ○, Local valley and fans; ●, Alluvial plains; □, Fluvio-marine plains; ■, Diluvial terrace.
Fig. 3. The concentrations of exchangeable cations (K+, Ca2+, and Mg2+) in the paddy fields as influenced by different topographic locations. ○, Local valley and fans; ●, Alluvial plains; □, Fluvio-marine plains; ■, Diluvial terrace.
al. (2012) reported that the paddy fields of diluvial terrace areas were mainly comprised of immature soils which were mostly containing low SOM content and available phosphorus concentration (Fig. 2). Therefore, more precise topographical analysis might be necessary for the paddy fields. In contrast, the concentrations of available silicate increased in the areas of local valley and fans, alluvial plains, and fluvio-marine plains until 2007 and then dropped down, whereas the available silicate concentrations in diluvial terrace areas were not statistically changed (Fig. 2). At any rate, the average concentrations of available silicate in the paddy fields studied were lower than the optimal concentration range, 157~180 mg kg-1, so that the application of silicate fertilizer in the paddy fields will be needed to improve rice productivity and quality.
Changes in the concentrations of exchangeable cations, K+, Ca2+, and Mg2+, showed distinctly different trends among them during the study years (Fig. 3). The concentrations of exchangeable K+ were gradually declined and then mostly reached the optimal range, 0.25~0.30 cmolc kg-1. The concentrations of Ca2+
increased from 2003 and made the optimal concentrations, 5.0~6.0 cmolc kg-1, in 2007, except in the areas of local
valley and fans.
However, the concentrations of exchangeable Mg2+
were not changed during the study years. In particular, only the paddy fields of fluvio-marine plains contained 1.63~1.77 cmolc of exchangeable Mg2+ in the optimal range, 1.5~2.0 cmolc kg-1, and other fields had lower exchangeable Mg2+ concentrations than its optimal range. Most of paddy fields in fluvio-marine plains contained high concentrations of exchangeable Mg2+
and Na+ because the fields were influenced by intake of seawater (Ahn et al., 2012).
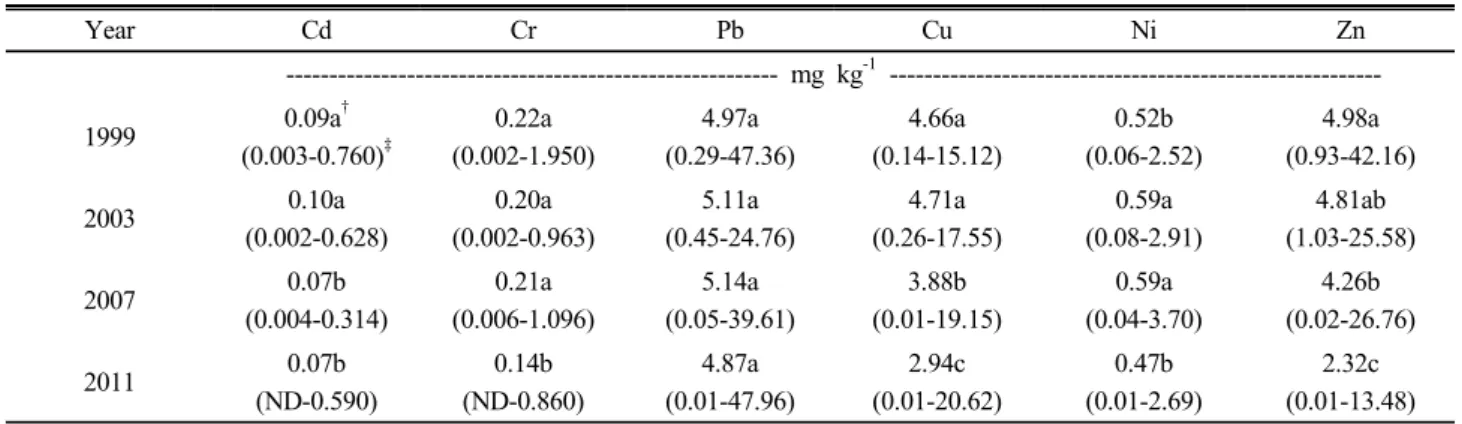
The mean concentrations of 0.1 M HCl-extractable heavy metals, Cd, Cr, Pb, Cu, Ni, and Zn, in the paddy fields determined at four year intervals from 1999 are presented in Table 2. The concentrations of Cd, Cr, Cu, Ni, and Zn in the paddy fields were slightly and gradually declined during the study years, and the metal concentrations were the lowest in 2011. The concentrations of Pb were not statistically changed during the years.
The concentrations of each heavy metal determined were widely ranged during the investigation years: Cd concentrations ranged from ‘not detectable (ND)’ to 0.760 mg kg-1, the range of Cr concentrations was
Table 2. Mean concentrations of 0.1 M HCl-extractable heavy metals in paddy field during the study years.
Year Cd Cr Pb Cu Ni Zn
--- mg kg-1 ---
1999 0.09a†
(0.003-0.760)‡
0.22a (0.002-1.950)
4.97a (0.29-47.36)
4.66a (0.14-15.12)
0.52b (0.06-2.52)
4.98a (0.93-42.16)
2003 0.10a
(0.002-0.628)
0.20a (0.002-0.963)
5.11a (0.45-24.76)
4.71a (0.26-17.55)
0.59a (0.08-2.91)
4.81ab (1.03-25.58)
2007 0.07b
(0.004-0.314)
0.21a (0.006-1.096)
5.14a (0.05-39.61)
3.88b (0.01-19.15)
0.59a (0.04-3.70)
4.26b (0.02-26.76)
2011 0.07b
(ND-0.590)
0.14b (ND-0.860)
4.87a (0.01-47.96)
2.94c (0.01-20.62)
0.47b (0.01-2.69)
2.32c (0.01-13.48)
†Numbers followed by the same letter within a column are not significantly different (Duncan test, p<0.05).
‡Range of metal concentrations determined in this study; ND: not detectable.
from ND to 1.950 mg kg-1, Pb concentrations were from 0.01 mg kg-1 to 47.96 mg kg-1, Cu concentrations were from 0.01 mg kg-1 to 20.62 mg kg-1, Ni concentrations were from 0.01 mg kg-1 to 3.70 mg kg-1, and Zn concentrations ranged between 0.01 mg kg-1 and 42.16 mg kg-1. However, the concentrations of heavy metals in the paddy fields determined in this study were significantly lower than the levels of Soil Contamination Warning Standard (SCWS; 5 mg Cr kg-1, 4 mg Cd kg-1, 200 mg Pb kg-1, 150 mg Cu kg-1, 100 mg Ni kg-1, 300 mg Zn kg-1) for agricultural lands (1-region) presented in Soil Environment Conservation Law (SECL) established by Ministry of Environment (MOE), Korea (2012). Therefore, the paddy fields in Jeonbuk province, Korea would be very safe from the heavy metal contaminations.
Conclusions
Long-term investigations of selected soil chemical properties and heavy metal, Cd, Cr, Pb, Cu, Ni, and Zn concentrations in the paddy field soils of different topographic areas were conducted at four year intervals from 1999 to 2011. Soil pH values were within optimal range for rice cultivation. The contents of soil organic matter (SOM) significantly decreased in 2007 due to rice straw removal from the fields. The concentrations of available phosphorus were only reduced in 2007. The concentrations of exchangeable K+ were continuously declined during the study years.
The concentrations of available silicate gradually increased in 2007 but then dropped down in 2011. In particular, the available silicate concentrations were widely ranged between 5 and 1359 mg kg-1 depending
upon the sampling sites, which might be caused by farmer’s avoidance to use silicate fertilizer because of the difficulties of its treatment and transport. Ex- changeable cation capacity (CEC) was only dropped down in 2007 because it might be also come from the rice straw removal. As comparing with optimal values of the selected soil chemical properties for rice cultivation, the mean concentrations of available phosphorus were exceeded the range of optimal value, 80∼120 mg kg-1, in many paddy fields, whereas the mean values of other properties were lower or close to the optimal values. Soil pH values ranged between 5.7 and 5.8 in all the topographic areas. The concentrations of available phosphorus in the paddy fields of local valley and fans, alluvial plains, and fluvio-marine plains were mostly declined, except in diluvial terrace areas. Unexpectedly, the phosphorus concentrations in the fields of diluvial terrace areas gradually increased and were significantly higher than others. On the other hand, the concentrations of available silicate increased in most topographic areas until 2007 and then dropped down, except in diluvial terrace areas.
The concentrations of exchangeable K+ were gradually declined and then mostly reached the optimal range.
The concentrations of Ca2+ increased from 2003 and made the optimal concentrations in 2007, except in the areas of local valley and fans. The paddy fields of fluvio-marine plains only contained in the optimal range of exchangeable Mg2+ concentrations, but other fields had lower than its optimal range.
The mean concentrations of 0.1 M HCl-extractable heavy metals, Cd, Cr, Pb, Cu, Ni, and Zn, in the paddy fields were slightly and gradually declined during the study years, but the Pb concentrations were not
statistically changed. In addition, the concentrations of heavy metals were widely ranged due to the sampling sites as ND∼0.760 mg Cd kg-1, ND∼1.950 mg Cr kg-1, 0.01∼47.96 mg Pb kg-1, 0.01∼20.62 mg Cu kg-1, 0.01∼3.70 mg Ni kg-1, and 0.01∼42.16 mg Zn kg-1. However, the concentrations of heavy metals de- termined in this study were significantly lower than the levels of SCWS for agricultural lands (1-region) presented in SECL.
Acknowledgements
This research was supported by Rural Development Administration (PJ006906162011), Korea.
References
Ahn, B.K., J.H. Lee, K.C. Kim, H.G. Kim, S.S. Jeong, H.W.
Jeon, and Y.S. Zhang. 2012. Changes in chemical properties of paddy soils as influenced by regional topography in Jeonbuk province. Korean J. Soil Sci. Fert. 45(3):393-398.
Cho, J.Y., K.W. Han, J.K. Choi, Y.J. Kim, and K.S. Yoon. 2002.
N and P losses from a paddy field plot in central Korea. Soil Sci. Plant Nutr. 48:301-306.
Hyeon, K.S., C.S. Park, S.J. Jung, and J. Moon. 1989.
Physico-chemical properties of soils developed on the
different topographies in Korea. Korean J. Soc. Soil Sci. Fert.
22:271-279.
Jeollabuk-Do. 2007. Statistics system for status of Jeonbuk provincial government. Jeonbuk, (in Korea)
Jung, S.J. and T.S. Kim. 1988. Topographic characteristics, formation and classification of soils developed in limestone.
Konkuk University Master's Thesis.
Kim, S.K. 2008. Soil science. Greentomato, Seoul.
Lee, Y.H., Y.K. Sonn, S.T. Lee, J.Y. Heo, M.K. Kim, E.S. Kim, W.D. Song, Y.S. Zhang, W.T. Jeon, and Y.S. Oh. 2012.
Topographical chemical properties of paddy soils in Gyeongnam province. Korean J. Soil Sci. Fert. 45(2):143-148.
MOE (Ministry of Environment). 2012. Enforcement decree of the soil environment conservation act. Ministry of Envir- onment, Korea.
NIAST (National Institute of Agricultural Science and Technology). 2008. Annual report of the monitoring project on agro-environmental quality in 2007. NIAST, Rural De- velopment Administration, Korea.
NIAST (National Institute of Agricultural Science and Tech- nology). 2000. Method of soil and plant analysis. NIAST, Rural Development Administration, Korea.
NIAST (National Institute of Agricultural Science and Tech- nology). 2010. Method of soil and plant analysis. NIAST, Rural Development Administration, Korea.
Sohn, B.K., J.S. Cho, J.G. Kang, J.Y. Cho, K.Y. Kim, H.W.
Kim, and H.L. Kim. 1999. Physico-chemical properties of soils at red pepper, garlic and onion cultivation ares in Korea.
Korean. J. Soc. Soil Sci. Fert. 32:123-131.