INTRODUCTION
Recent changes in dietary patterns, physical inactivity, lifestyle modification, and increasing cholesterol level of the Asian population raise a concern about the increasing burden of cholesterol related diseases such as coronary heart disease (CHD) in the population [1,2].
Dyslipidemia caused by an accumulation of cholesterol in the blood is a disorder of lipid metabolism, including elevated total cholesterol (TC), elevated triglyceride (TG), elevated low-density lipoprotein cholesterol (LDL-C), and decreased high-density lipoprotein cholesterol (HDL-C).
The National Cholesterol Education Program criteria defines
dyslipidemia as having one or more of the following lipid abnormalities [3]: hypercholesterolemia (TC ≥240 mg/dL or diagnosis of dyslipidemia or use of lipid-lowering drugs), hypertriglyceridemia (≥150 mg/dL), hyper-LDL cholesterolemia (≥160 mg/dL or diagnosis of dyslipidemia or use of lipid-lowering drugs), and hypo-HDL-cholesterolemia (<40 mg/dL in men and <50 mg/dL in women). Age-standardized prevalence rates of dyslipidemia were 59.0% in 2010 [3]. The overall prevalence of hypercholesterolemia and hyper-LDL-cholesterolemia increased by 1.36 and 1.35 times in 2010 compared to 2007, respectively. Awareness, treatment, and control rates of dyslipidemia improved over the period of surveys in both sexes. In 2010, about 30%
of dyslipidemia patients who received lipid-lowering treatment
Cost-Effectiveness Analysis for National Dyslipidemia Screening Program in Korea: Results of Best Case Scenario Analysis Using a Markov Model
Jae-Hyun Kim
1,2, Eun-Cheol Park
3,4, Tae-Hyun Kim
4,5, Chung-Mo Nam
3, Sung-Youn Chun
4, Tae-Hoon Lee
4, Sohee Park
4,61
Department of Health Administration, Dankook University College of Health Science;
2Institute of Health Promotion and Policy, Dankook University, Cheonan, Korea;
3Department of Preventive Medicine, Yonsei University College of Medicine;
4Institute of Health Services Research, Yonsei University;
Departments of
5Hospital Management and
6Biostatistics, Yonsei University Graduate School of Public Health, Seoul, Korea
Background: This study evaluated the cost-effectiveness of 21 different national dyslipidemia screening strategies according to total cholesterol (TC) cutoff and screening interval among 40 years or more for the primary prevention of coronary heart disease over a lifetime in Korea, from a societal perspective.
Methods: A decision tree was used to estimate disease detection with the 21 different screening strategies, while a Markov model was used to model disease progression until death, quality-adjusted life years (QALYs) and costs from a Korea societal perspective.
Results: The results showed that the strategy with TC 200 mg/dL and 4-year interval cost ₩4,625,446 for 16.65105 QALYs per person and strategy with TC 200 mg/dL and 3-year interval cost ₩4,691,771 for 16.65164 QALYs compared with ₩3,061,371 for 16.59877 QALYs for strategy with no screening. The incremental cost-effectiveness ratio of strategy with TC 200 mg/dL and 4-year interval versus strategy with no screening was ₩29,916,271/QALY. At a Korea willingness-to-pay threshold of ₩30,500,000/QALY, strategy with TC 200 mg/dL and 4-year interval is cost-effective compared with strategy with no screening. Sensitivity analyses showed that results were robust to reasonable variations in model parameters.
Conclusion: In this study, revised national dyslipidemia screening strategy with TC 200 mg/dL and 4-year interval could be a cost-effective option. A better understanding of the Korean dyslipidemia population may be necessary to aid in future efforts to improve dyslipidemia diagnosis and management.
Keywords: Cost; Dyslipidemia; Effectiveness; Screening
Correspondence to: Sohee Park
Department of Biostatistics, Yonsei University Graduate School of Public Health, 50-1 Yonsei-ro, Seodaemun-gu, Seoul 03722, Korea
Tel: +82-2-2228-1532, Fax: +82-2-392-7734 , E-mail: [email protected]
Received: March 27, 2019, Revised: April 16, 2019, Accepted after revision: August 28, 2019
© Korean Academy of Health Policy and Management
◯
㏄This is an open-access article distributed under the terms of the Creative Commons Attribution Non-Commercial License (http://creativecommons.org/licenses/by-nc/4.0) which permits unrestricted non-commercial use,
distribution, and reproduction in any medium, provided the original work is properly cited.
reached target levels [3].
Individuals with dyslipidemia have a high possibility of premature CHD and stroke, and it is up to 4 times more likely to develop CHD than the non-dyslipidemia population in the South Korean population [4]. Together, the economic and quality-of-life consequences of premature CHD present a huge burden on both South Korea and the United States. The American Heart Association estimates that CHD and stroke cost in the United States are $108.9 billion and $53.9 billion each year, respectively, including both direct and indirect costs [5]. The annual economic burden of CHD imposed on Korean society was estimated to be $2.52 billion in 2005 [6].
Cardiovascular disease (CVD) is now one of the leading preventable causes of death in South Korea, causing 22% of all deaths in 2011 [7].
In addition, health-related quality-of-life for survivors decreases 30%–
50% following a major event, such as an acute myocardial infarction, angina, or stroke [8,9]. Cholesterol-lowering was effective in managing dyslipidemia and reducing morbidity and mortality to the heart-related disease and stroke [10]. In addition, early detection of dyslipidemia through drug procedure and physical activity also was effective for lowering heart disease. This positive association between cholesterol and CHD support the importance of lipid-lowering in those at risk even from a population with low CHD mortality and suggests that aging might render an adverse change in response to increased cholesterol level.
In Korea, dyslipidemia was defined according to the National Cholesterol Education Program’s Adult Treatment Panel III (NCEP-ATP III) as TC ≥240 mg/dL, LDL-C ≥160 mg/dL, HDL-C
<40 mg/dL, and TG ≥200 mg/dL. However, recently, the Korean Society of Lipidology and Atherosclerosis (KSLA) 2nd revised edition therapy guidelines have been revised downward and diagnosed dyslipidemia as people with TC ≥230 mg/dL, LDL-C ≥150 mg/dL, HDL-C <40 mg/dL, TG ≥200 mg/dL considering that there are no large-scale clinical test results that realistically target the Korean situation. The KSLA also encourages widespread therapy in potential CHD patients, such as people with hypertension, low HDL-C (40 mg/dL), age (male ≥45 years, female ≥55 years), family history of CHD, and smoking status based on the NCEP-ATP III. However, although the current dyslipidemia screening program is conducted for 2 years among 40 years or more, there has been still controversy about diagnostic criteria and screening cycle of dyslipidemia.
Although several studies about the cost-of-illness of CHD have been carried out in industrialized western countries as well as Korea [11], no published appraisal of the cost-effectiveness of dyslipidemia screening over the world as well as Korea was identified in a literature search and few studies on the which type of dyslipidemia screening are the most effective. Therefore, this study aimed to determine the cost-effectiveness of the national dyslipidemia screening program for the primary prevention of CHD over a lifetime in Korea from a societal perspective.
METHODS
1. The model
The analysis was conducted with a societal perspective and a lifetime time horizon. An initial cohort of asymptomatic adults was followed in a Markov model simulation using TreeAge Pro 2014 (TreeAge Software Inc., Williamstown, MA, USA). Parameters for transition probabilities, health-state utilities, and costs were derived from peer-reviewed literature and publically available databases. All costs and quality-adjusted life years (QALYs) were discounted using an annual discount rate of 5%.
The model uses a decision tree to diagnosis probabilities, and a Markov model to simulate CHD progression and cost outcomes for the cohort in each of the 21 screening arms. The decision tree for dyslipidemia screening differentiates between the 20 dyslipidemia screening strategies and the no dyslipidemia screening strategy.
Figure 1 outlines the different procedures. In dyslipidemia screening, the accuracy of dyslipidemia screening was defined with dyslipidemia diagnostic criteria and therapy guidelines of potential CHD patients based on KSLA. Given the accessibility, affordability, and effectiveness of statins, all positive dyslipidemia cases from dyslipidemia screening will be prescribed statin therapy. Negative cases will be directly entered into a Markov state with disease progression.
On the other hand, in strategy with no dyslipidemia screening, no
accuracy of dyslipidemia was diagnosed, and positive or negative
dyslipidemia arm added recognition of dyslipidemia. Only individuals
with recognition of dyslipidemia will be treated with therapy and
control of dyslipidemia.
All individuals from these screening programs will enter the Markov model to simulate their health outcomes at 1-year interval until death. The Markov model is shown in Figure 2 and includes four health states: health, dyslipidemia, CHD event, and death. All individuals start in the health state and enter dyslipidemia and CHD state. While dyslipidemia individuals are mainly at risk for CHD events, high cholesterol also increases the risk for CHD events. After an event, individuals will transition to the death state in the case of a CHD-related or non-CHD-related fatality. Individuals can also transition directly from the health state to death. The final outcome of the Markov model is a calculation of life expectancy and discounted QALYs for individuals from the initial cohort of each screening arm.
These values are used in cost and incremental cost-effectiveness ratio (ICER) calculations.
Figure 2. Markov model of disease progression. Individuals begin in the health and LD state to the CHD state and finally to death.
Alternatively, individuals can transition directly to death from health or LD in a state for multiple cycles. LD, dyslipidemia; CHD, coronary heart disease.
2. Transition probabilities
Individuals diagnosed with the health and dyslipidemia state receive a possibility of dyslipidemia screening of 1 to 4 years based on transition probabilities of the efficacy of dyslipidemia therapy (control, therapy, and recognition of dyslipidemia) in all arms is based on the Korea National Health and Nutrition Examination Survey V-3 from baseline.
Figure 1. Decision tree for dyslipidemia screening. Both dyslipidemia screening (yes or no) options for the first year of screening are shown.
Continued dyslipidemia cycles are the same for remaining true (+), false (+), true (-), and false (-) cases past the first year.
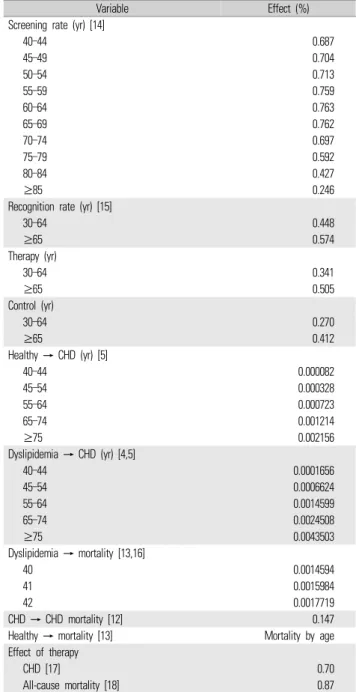
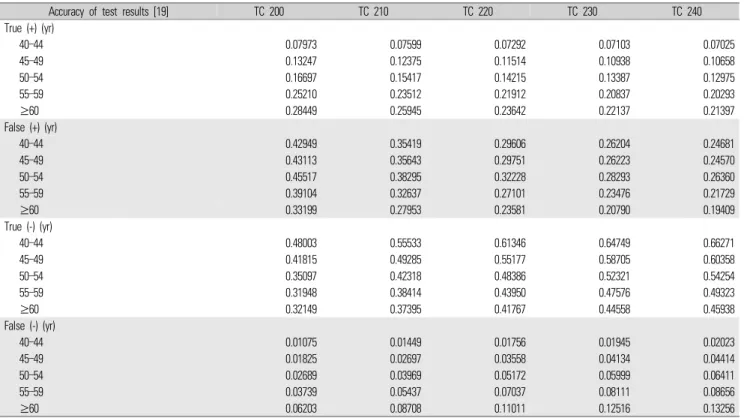
The main parameters are summarized in Table 1 [4,5,12-18], when available. Parameters of the accuracy of dyslipidemia screening were derived from approximately twelve million participated in dyslipidemia screening [19] (Table 2). Included all risk probabilities in the Markov model were converted into 1-year health state transition probabilities for health to dyslipidemia/CHD and CHD to death, respectively [20].
Because CHD cohort data from Korea is not available to directly calculate the rate of death after a dyslipidemia, the transition probability for dyslipidemia to death is estimated by multiplying the probability of dyslipidemia-related death with the hazard ratio of death after an event, from Korea vital statistics data and US study to modify all transition probabilities to the death state. And it is separated by 1-year age groups to account for changing heart disease progression and death rates. Also, the transition probability for dyslipidemia to the CHD event is derived from the previous study [4,21]. All-cause mortality and CHD related mortality are derived from Korea studies that provide 1-year survival after CHD in the Korean population [12]
and Korea vital statistics data [13], respectively.
3. Health-state utilities
Utilities for each state in the Markov model were estimated from studies with reference to a perfect health utility of 1.0 and death state utility of 0.0. The societal perspective was used over patient assessment to avoid over or under-estimating the burden of disease (Table 3) [22].
In the dyslipidemia state, there is a 0.038 disutility compared with health state based on the 77.8 quality of life of dyslipidemia divided by 80.9 quality of life of health state and in the CHD state, there is a 0.153 disutility compared with health state based on the 68.5 quality of life CHD divided by 80.9 quality of life of health state [22].
4. Costs
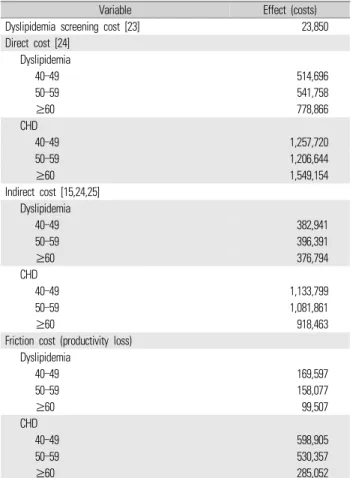
Costs were evaluated and reported from a Korea societal perspective and adjusted to 2013 Korean won using the consumer price index for medical care, nursing assistant, transportation, and non-covered insurance rate when needed (Table 4) [15,23-25]. The annual costs of dyslipidemia screening, dyslipidemia and CHD treatment, hospitalization, outpatient visits, transportation, nursing assistant, and time and productivity loss were included in this study. Screening
costs in each treatment arm were applied to all individuals as they enter the Markov models. The direct screening costs of dyslipidemia include TC, HDL-C, LDL-C, and TG tests, to confirm high cholesterol diagnosis, plus the administrative costs for testing and the indirect cost of work-hours lost due to physician visits. Those who participated in the dyslipidemia screening program will also incur costs for dyslipidemia screening related costs such as transportation, time, and screening cost per person, annually.
Variable Effect (%)
Screening rate (yr) [14]
40–44 0.687
45–49 0.704
50–54 0.713
55–59 0.759
60–64 0.763
65–69 0.762
70–74 0.697
75–79 0.592
80–84 0.427
≥85 0.246
Recognition rate (yr) [15]
30–64 0.448
≥65 0.574
Therapy (yr)
30–64 0.341
≥65 0.505
Control (yr)
30–64 0.270
≥65 0.412
Healthy → CHD (yr) [5]
40–44 0.000082
45–54 0.000328
55–64 0.000723
65–74 0.001214
≥75 0.002156
Dyslipidemia → CHD (yr) [4,5]
40–44 0.0001656
45–54 0.0006624
55–64 0.0014599
65–74 0.0024508
≥75 0.0043503
Dyslipidemia → mortality [13,16]
40 0.0014594
41 0.0015984
42 0.0017719
CHD → CHD mortality [12] 0.147
Healthy → mortality [13] Mortality by age
Effect of therapy
CHD [17] 0.70
All-cause mortality [18] 0.87
CHD, coronary heart disease.
Table 1. Transition probability of base case parameter
States Utility [22]
Healthy 1
Dyslipidemia 0.962
Coronary heart disease 0.847
Death 0
Table 3. Input of health-state utilities
Dyslipidemia screening costs [23] were obtained from the health insurance medical costs, and hospitalization and outpatient services cost of dyslipidemia and CHD patients as well as pharmacy costs were obtained from the health insurance claim data 2011. Transportation and time costs were obtained from the national health and nutrition survey 2005 [24], Korea health panel 2008 [25], and labor conditions [13] by employment type adjusting for 2013, respectively. Nursing assistant costs were obtained from the Statistics Korea Consumer Price 2008 adjusting for 2013 [13]. After the first year, remaining dyslipidemia-positive/negative cases from all screening arms are screened for high cholesterol and are not screened if CHD diagnosed until all individuals are on the death state. Costs in dyslipidemia/CHD event state for all screening arms include first-year treatment costs for dyslipidemia/CHD hospitalizations and outpatient services, as well as
ongoing annual costs for each event in subsequent years.
5. Sensitivity analyses
As a result of imperfect information on the effectiveness of an intervention and the resources consumed for treatment, the costs and effects of health interventions are inevitably associated with some degree of uncertainty, which introduces the possibility of error into decision-making. Sensitivity analyses were necessary to address the lack of complete dyslipidemia screening and treatment data from a Korean population. One-way sensitivity analyses of the ICER for dyslipidemia versus no Screening were conducted to determine model robustness. When available, all other parameters were varied by four categories limit of base case parameter. Probabilistic sensitivity analyses were conducted using Monte Carlo simulations to obtain cost-effectiveness acceptability curves. Monte Carlo simulation generated the sampling distribution of the joint mean cost and efficacy to quantify the uncertainty around the estimates of costs and effects.
Accuracy of test results [19] TC 200 TC 210 TC 220 TC 230 TC 240
True (+) (yr)
40–44 0.07973 0.07599 0.07292 0.07103 0.07025
45–49 0.13247 0.12375 0.11514 0.10938 0.10658
50–54 0.16697 0.15417 0.14215 0.13387 0.12975
55–59 0.25210 0.23512 0.21912 0.20837 0.20293
≥60 0.28449 0.25945 0.23642 0.22137 0.21397
False (+) (yr)
40–44 0.42949 0.35419 0.29606 0.26204 0.24681
45–49 0.43113 0.35643 0.29751 0.26223 0.24570
50–54 0.45517 0.38295 0.32228 0.28293 0.26360
55–59 0.39104 0.32637 0.27101 0.23476 0.21729
≥60 0.33199 0.27953 0.23581 0.20790 0.19409
True (-) (yr)
40–44 0.48003 0.55533 0.61346 0.64749 0.66271
45–49 0.41815 0.49285 0.55177 0.58705 0.60358
50–54 0.35097 0.42318 0.48386 0.52321 0.54254
55–59 0.31948 0.38414 0.43950 0.47576 0.49323
≥60 0.32149 0.37395 0.41767 0.44558 0.45938
False (-) (yr)
40–44 0.01075 0.01449 0.01756 0.01945 0.02023
45–49 0.01825 0.02697 0.03558 0.04134 0.04414
50–54 0.02689 0.03969 0.05172 0.05999 0.06411
55–59 0.03739 0.05437 0.07037 0.08111 0.08656
≥60 0.06203 0.08708 0.11011 0.12516 0.13256
TC, total cholesterol (mg/dL).
Table 2. Transition probability of base case parameter for dyslipidemia screening accuracy
RESULTS
1. Cost-effectiveness ratios
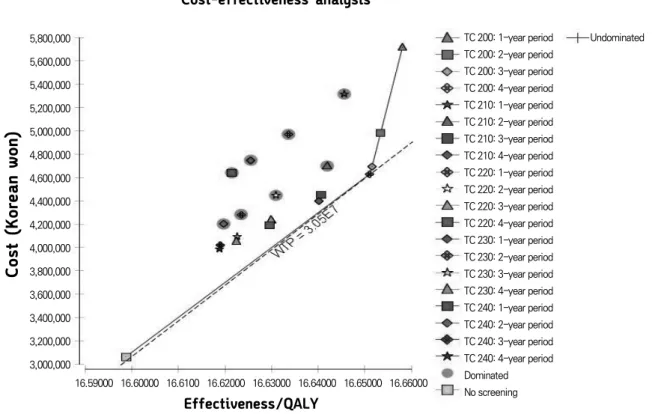
Results are presented in discounted total costs and QALYs per individual in each screening arm, as well as incremental costs and QALYs and ICERs between arms. Based on the ranking algorithm for comparing cost-effectiveness among multiple strategies, strategy with TC 200 mg/dL and the 4-, 3-, and 1-year interval was chosen as the most superior strategy (Figure 3). Strategy with TC 200 mg/dL and 3-year period cost ₩66,324 more per person than a strategy with TC
200 mg/dL and 4-year period, but only produced 0.00059 more QALYs, resulting in an ICER of ₩113,526,883/QALY, which is not cost-effective at a Korea willingness-to-pay threshold of
₩30,500,000/QALY. Strategy with TC 200 mg/dL and 4-year period compared to a strategy with no screening produced ICERs of
₩29,916,271/QALY (Table 5). Strategy with TC 200 mg/dL and 3-year period cost ₩1,630,399 more per person than a strategy with no screening, but only produced 0.05287 more QALYs, resulting in an ICER of ₩30,837,885/QALY, which is not cost-effective at a Korea willingness-to-pay threshold of ₩30,500,000/QALY. Because dyslipidemia screening mainly affects the accuracy of diagnosis, strategy with TC 200 mg/dL and 4-year interval lead to more improvement in health outcomes and QALY gain than other strategies.
2. Sensitivity analysis results
We performed a one-way sensitivity analysis on variables that had uncertain estimates. One-way sensitivity analyses showed that the main drivers for the ICER results included the discount factor, reduction of CHD-related mortality due to treatment, reduction of CHD incidence due to treatment, age of dyslipidemia screening, and CHD-related mortality, but results did not exceed ₩30,500,000/QALY
(Figure 4). However, only discount factor had a large effect on the ICER results between strategy with TC 200 mg/dL and 4-year interval and strategy with no screening, which ranges from ₩24,151,166 to
₩36,363,048/QALY at a Korea willingness-to-pay threshold of
₩30,500,000/QALY. All other parameters only produced slight changes in this ICER. Overall, all model results were robust to the parameters varied.
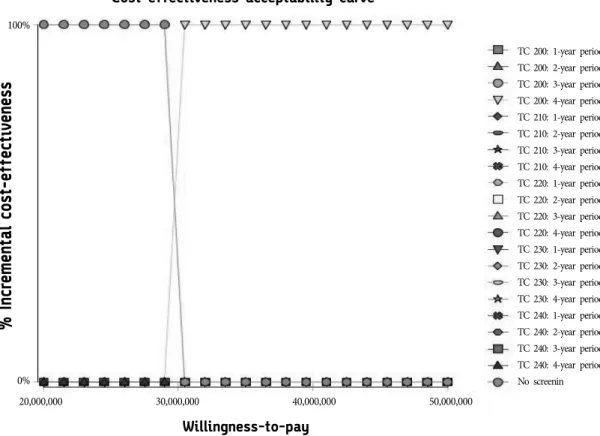
We assessed uncertainty around this ICER by Monte Carlo simulation using 1,000 iterations. Figure 5 illustrates the probability that any one strategy is cost-effective, as a function of the willingness
Variable Effect (costs)
Dyslipidemia screening cost [23] 23,850
Direct cost [24]
Dyslipidemia
40–49 514,696
50–59 541,758
≥60 778,866
CHD
40–49 1,257,720
50–59 1,206,644
≥60 1,549,154
Indirect cost [15,24,25]
Dyslipidemia
40–49 382,941
50–59 396,391
≥60 376,794
CHD
40–49 1,133,799
50–59 1,081,861
≥60 918,463
Friction cost (productivity loss) Dyslipidemia
40–49 169,597
50–59 158,077
≥60 99,507
CHD
40–49 598,905
50–59 530,357
≥60 285,052
CHD, coronary heart disease.
Table 4. Input cost of base case parameter
Strategies Costs Incremental costs Effectiveness Incremental effectiveness ICER
No screening 3,061,372 16.59877
TC 200, 4-year interval 4,625,446 1,564,074 16.65105 0.05228 29,916,271
TC 200, 3-year interval 4,691,771 66,324 16.65164 0.00059 113,526,883
TC 200, 1-year interval 5,714,621 10,22,850 16.65807 0.00643 158,972,333
ICER, incremental cost-effectiveness ratio; TC, total cholesterol (mg/dL).
Table 5. Markov model results
5,800,000 5,600,000 5,400,000 5,200,000 5,000,000 4,800,000 4,600,000 4,400,000 4,200,000 4,000,000 3,800,000 3,600,000 3,400,000 3,200,000 3,000,000
TC 200: 1-year period TC 200: 2-year period TC 200: 3-year period TC 200: 4-year period TC 210: 1-year period TC 210: 2-year period TC 210: 3-year period TC 210: 4-year period TC 220: 1-year period TC 220: 2-year period TC 220: 3-year period TC 220: 4-year period TC 230: 1-year period TC 230: 2-year period TC 230: 3-year period TC 230: 4-year period TC 240: 1-year period TC 240: 2-year period TC 240: 3-year period TC 240: 4-year period Dominated No screening
Undominated
Effectiveness/QALY
16.59000 16.60000 16.6100 16.62000 16.63000 16.64000 16.65000 16.66000
Cost-effectiveness analysis
Figure 3. ICER of 21 different strategies for dyslipidemia screening. ICER, incremental cost-effectiveness ratio; QALY, quality-adjusted life year; TC, total cholesterol (mg/dL); WTP, willingness-to-pay.
Tornado analysis (ICER)
Rate_discount (0.03 to 0.07) CHD_death_treatmant (0.0 to 0.85) CHD_death (0.0 to 0.147) Startage (0.0 to 40.0) CHD_indidencd_treat (0.0 to 0.8)
15,000,000 20,000,000 25,000,000 30,000,000 35,000,000 40,000,000 EV : 29916271.23965
Figure 4. One-way sensitivity analysis tornado plot of strategy with total cholesterol 200 mg/dL and 4-year interval versus strategy with no
screening. ICER, incremental cost-effectiveness ratio; CHD, coronary heart disease; EV, expected value.
to pay. Given a maximum acceptable ceiling ratio of ₩30,500,000/QALY, the probability that strategy with TC 200 mg/dL and the 4-year interval is cost-effective compared with a strategy with no screening is 100%. Therefore, given the data, there is a 100% chance that the additional cost of strategy with TC 200 mg/dL and 4-year interval, compared with the other strategies including strategy with no screening, is at or below ₩30,500,000/QALY gained.
DISCUSSION
Our CEA model compared the cost-effectiveness of 21 different screening strategies for early diagnosis and treatment of dyslipidemia according to TC cutoff value and dyslipidemia screening intervals among 40 years or more in Korea. In our decision-analytic model, based on model parameters derived from peer-reviewed literature and publically available reports, we found that dyslipidemia screening of strategy with 200 mg/dL and 4-year interval among 40 years or more
was a cost-effective intervention compared with a strategy with no screening from a Korea societal perspective.
Sensitivity analyses of parameters included in the analysis showed that while the ICER for a strategy with TC 200 mg/dL and 4-year interval compared with a strategy with no screening is sensitive to some model parameters, the result is robust within a wide range of sensitivity analyses given a Korea willingness-to-pay of
₩30,500,000/QALY or less. Cholesterol measurement and intervention in the context of secondary prevention are generally cost-effective, and the cost of the TC and lipoprotein measurement component is assumed to be small in comparison to the cost of long-term therapy [26]. However, although treatment of very high-risk individuals, such as young men with familial hypercholesterolemia, may provide one of the most cost-beneficial interventions available [27], the situation concerning primary prevention is more complicated. For example, poor cost-benefit can easily be demonstrated in low-risk individuals or the general population [28].
Cost-effectiveness acceptability curve
Willingness-to-pay
20,000,000 30,000,000 40,000,000 50,000,000
TC 200: 1-year period TC 200: 2-year period TC 200: 3-year period TC 200: 4-year period TC 210: 1-year period TC 210: 2-year period TC 210: 3-year period TC 210: 4-year period TC 220: 1-year period TC 220: 2-year period TC 220: 3-year period TC 220: 4-year period TC 230: 1-year period TC 230: 2-year period TC 230: 3-year period TC 230: 4-year period TC 240: 1-year period TC 240: 2-year period TC 240: 3-year period TC 240: 4-year period No screenin