Plantar Pressure Distribution During Level Walking, and Stair Ascent and Descent in Asymptomatic Flexible Flatfoot
Jeong-ah Kim1, BHSc, PT, One-bin Lim1, MSc, PT, Chung-hwi Yi2,3, PhD, PT
1Dept. of Physical Therapy, The Graduate School, Yonsei University
2Dept. of Physical Therapy, College of Health Science, Yonsei University
3Dept. of Ergonomic Therapy, The Graduate School of Health and Environment, Yonsei University
Abstract
1)The first purpose was to identify the plantar pressure distributions (peak pressure, pressure integral time, and contact area) during level walking, and stair ascent and descent in asymptomatic flexible flatfoot (AFF). The second purpose was to investigate whether peak pressure data during level walking could be used to predict peak pressure during stair walking by identifying correlations between the peak pressures of level walking and stair walking. Twenty young adult subjects (8 males and 12 females, age 21.0±1.7 years) with AFF were recruited. A distance greater than 10 ㎜ in a navicular drop test was defined as flexible flatfoot. Each subject performed at least 10 steps during level walking, and stair ascent and descent. The plantar pressure distribution was measured in nine foot regions using a pressure measurement system. A two-way repeated analysis of variance was conducted to examine the differences in the three dependent variables with two within-subject factors (activity type and foot region). Linear regression analysis was conducted to predict peak pressure during stair walking using the peak pressure in the metatarsal regions during level walking. Significant interaction effects were observed between activity type and foot region for peak pressure (F=9.508, p<.001), pressure time integral (F=5.912, p=.003), and contact area (F=15.510, p<.001). The regression equations predicting peak pressure during stair walking accounted for variance in the range of 25.7% and 65.8%. The findings indicate that plantar pressures in AFF were influenced by both activity type and foot region. Furthermore the findings suggest that peak pressure data during level walking could be used to predict the peak pressure data during stair walking. These data collected for AFF can be useful for evaluating gait patterns and for predicting pressure data of flexible flatfoot subjects who have difficulty performing activities such as stair walking.
Further studies should investigate plantar pressure distribution during various functional activities in symptomatic flexible flatfoot, and consider other predictors for regression analysis.
Key Words: Flatfoot; Level walking; Navicular drop; Plantar pressure; Stair walking.
Introduction
Flatfoot describes a dropped or abnormally low medial longitudinal arch (Kitaoka et al, 1997).
Flexible flatfoot is an especially common form of dropped arch (Neumann, 2002). During weight bear- ing, the heel is in valgus, the medial arch flattens and the forefoot deviates in abduction (Mosca, 2010).
The medial longitudinal arch reappears during non- weight bearing (Neumann, 2002). Asymptomatic flex- ible flatfoot (AFF) is understood as a physiological variant (Moraleda and Mubarak, 2011). It is not pos- sible to determine whether AFF will become symp- tomatic or remain asymptomatic throughout the in- dividual’s life (Cappello and Song, 1998). Some stud- ies have suggested that individuals with AFF might
Corresponding author: Chung-hwi Yi [email protected]
This work was supported by the Students’ Association of the Graduate School of Yonsei University funded by the Graduate School of Yonsei University.
lose flexibility after skeletal maturity, resulting in several deformities and soft tissue injuries [e.g. hal- lux valgus (Coughlin and Jones, 2007), tibialis poste- rior dysfuction (Dyal et al, 1997), patellar tendinitis, plantar fasciitis (Willilams et al, 2001), tibialis ante- rior inflammation (Wallensten and Eriksson, 1984), and patella-femoral joint pain (Franco, 1987)]. These deformities and soft tissue injuries would eventually require more complex surgical interventions (Kelikian et al, 2011; Labovitz, 2006).
Therefore, it is important to provide recom- mendations for the prevention of AFF (Rodriguez and Volpe, 2010). Analysis of the current dynamic foot function is important for AFF (Hosl et al, 2013).
For example, stair walking is a common daily living activities that places a higher demand than level walking on the lower extremities (Costigan et al, 2002; Rao and Carter, 2012). Information regarding the plantar pressure distribution during stair walking would be valuable in reducing results of the complex surgical interventions.
Plantar pressure measurement can be used to de- scribe dynamic function of the foot (Cavanagh et al, 1997), and to analyze loading patterns (Bryant et al, 1999). In the plantar pressure measurements, peak pressure, the pressure time integral, and the contact area are the most commonly analyzed variables (Orlin and McPoil, 2000). The peak pressure repre- sents the highest pressure in the foot during one step (Bus and Waaijman, 2013). The pressure time integral represents the amount of total pressure maintained through a specific region multiplied by the time taken to complete the step of gait (Tsung et al, 2004). The contact area represents the amount of surface contact between the plantar surface of the foot and an insole sensor (Orlin and McPoil, 2013).
Plantar pressure distributions have been examined in flatfoot during static standing and walking. Jonely et al (2011) examined peak pressures in the medial region of the foot during static standing and walking. Walker and Fan (1998) evaluated peak pressures in metatarsal regions during walking.
Ledoux and Hillstrom (2002) investigated peak forces in seven regions of the foot during walking. Rao et al (2011) examined peak pressures in three regions of the foot during walking. Teyhen et al (2011) as- sessed peak pressure, contact area, maximum force, and force time integral in 10 regions of the foot dur- ing walking. Sánchez-Rodríguez et al (2012) studied peak pressure in 10 regions of the foot during walk- ing, and Hong (2012) examined peak pressure and the center of pressure trajectory in the medial fore- foot and the lateral forefoot during one leg standing.
However, plantar pressure distribution during stair walking has not been established for AFF. For nor- mal feet, only a few studies have examined plantar pressure distributions during stair walking (Lundeen et al, 1994; Maluf et al, 2004). Therefore, the first purpose of this study was to identify level walking, stair ascent and descent influence the plantar pres- sure distributions (peak pressure, pressure integral time, and contact area) in AFF. The second purpose was to investigate whether peak pressure data dur- ing level walking could be used to predict peak pressure during stair walking by identifying correla- tions between the peak pressures. The research hy- potheses were that interaction effects would be ob- served between the activity and the region of the foot for the three dependent variables (peak pressure, pressure integral time, and contact area), and moder- ate to strong correlations would be observed between the peak pressure data during level walking and stair walking.
Methods
Subjects
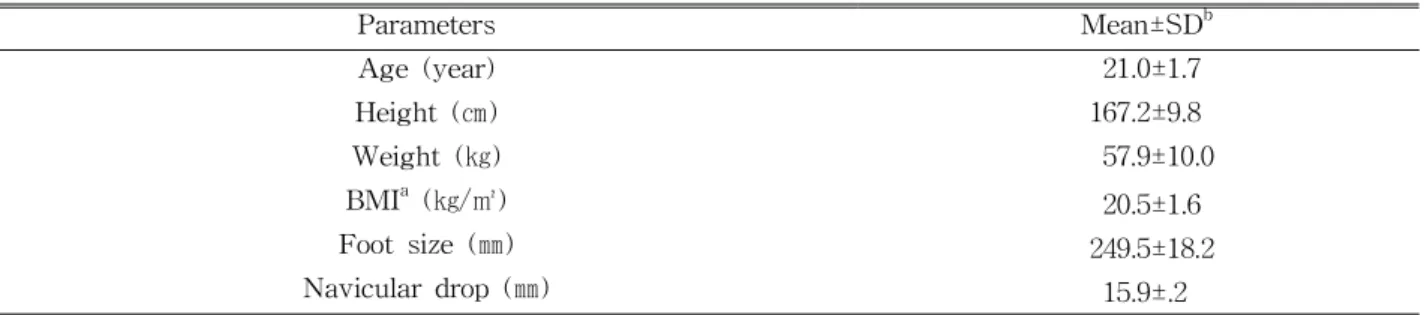
Twenty young subjects (8 males and 12 females) with AFF were recruited to this study (Table 1).
The inclusion criteria were: (1) more than 10 ㎜ dis- crepancy in a navicular drop test (Cote et al, 2005), (2) lower than 5 ㎜ discrepancy in the leg length (Hong et al, 2012), and (3) normal joint range of
Parameters Mean±SDb
Age (year) 21.0±1.7
Height (㎝) 167.2±9.8
Weight (㎏) 57.9±10.0
BMIa (㎏/㎡) 20.5±1.6
Foot size (㎜) 249.5±18.2
Navicular drop (㎜) 15.9±.2
abody mass index, bmean±standard deviation.
Table 1. General characteristics of subjects (N=20)
motion, and normal muscle strength of lower ex- tremity (Hong et al, 2012). The exclusion criteria were: (1) persistent pain of lower extremity within the past six months (Hong et al, 2012), (2) orthope- dic maladies that would prevent a normal stance, (Ledoux and Hillstrom, 2002), and (3) a history of lower extremity surgery (Hong et al, 2012). All the subjects signed an informed consent form.
Instrumentation
Navicular Drop Test
The Navicular drop test was used to measure the mobility of the medial longitudinal arch, and to quantify the amount of vertical navicular excursion between neutral subtalar joint positions and relaxed bilateral standing positions (Brody, 1982). The most prominent aspect of the navicular tuberosity was marked with a dot. The first placement was marked on an index ruler at the dot level of the navicular tuberosity when the subject maintained the subtalar joint in a neutral position while sitting. The exam- iner aligned the index ruler perpendicular to the me- dial side of the foot. The subtalar joint was deemed to be in a neutral position when the talar head was located equally between the examiner’s thumb and index finger. The second placement was marked on the ruler when the subject maintained both feet bearing equal weight while standing. The distance between the two placements on the ruler showed the amount of navicular tuberosity drop from the neutral subtalar joint position to the standing position. A
distance value greater than 10 ㎜ was considered as the flatfoot (Cote et al, 2005). Prior to the navicular drop test, to minimize measurement error, the exam- iner participated in 10 hours of hands-on training on the test protocol. The training provided instruction on the marked placements, the joint positions of the foot, and the hand positions required (Brody, 1982).
The intrarater test-retest reliability of the navicular drop test was determined using an intraclass corre- lation coefficient [ICC (3,1)] model (Portney and Watkins, 2009) and standard error of measurement (SEM). The intrarater test-retest reliability for the navicular drop test was .88 and SEM was .83 in this study.
Pressure Measurements
The measuring system was a Tekscan insole pressure system (F-Scan Versa System, Tekscan Inc., MA, USA). The Tekscan system uses a thin two-layer (.18 ㎜) insole sensor containing 960 in- dividual sensors. This system is useful for compar- isons of plantar pressure distributions under constant conditions (Kong and De Heer, 2009). The pressure data were analyzed using F-Scan Research ver. 6.70 software (F-Scan Versa System, Tekscan Inc., MA, USA). A dominant foot from each subject was ana- lyzed to satisfy the assumption of independence (Menz et al, 2004). The dominant foot was defined by asking the subjects which foot would be used to kick a ball (Bohannon et al, 1984). The software au- tomatically divided the foot into nine regions [hallux (H), first to fifth metatarsal heads (M1 to M5), mid
A B
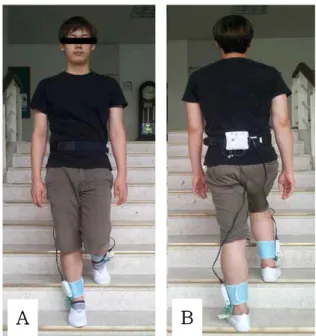
Figure 2. Stair walking (A: ascent, B: descent).
Figure 1. Nine foot regions (H: hallux, M1:
first metatarsal head, M2: second metatarsal head, M3: third metatarsal head, M4: fourth metatarsal head, M5: fifth metatarsal head, MF: mid foot, MH: medial heel, LH: lateral heel).
foot (MF), medial heel (MH), and lateral heel (LH)]
(Figure 1). The division was realized to assure a high level of precision. Three dependent variables (peak pressure, pressure time integral, and contact area) were calculated in these nine regions. For each of the three activities (level walking, stair ascent, and descent), a minimum of 10 steps was analyzed at a sampling rate of 50 ㎐ (Jonely, 2011). The initial, fi- nal, and mid steps at the turning point were removed to avoid acceleration and deceleration effects, which could influence the results (Bacarin et al, 2009).
Procedures
The examiner performed the navicular drop test.
The Tekscan insole sensors were trimmed to the subject’s foot size and inserted into standard flat floor shoes provided by the examiner. The insole sensor connector was inserted into cuffs attached to ankle bands. The subjects placed the ankle bands around their ankles and were equipped with a waist belt with a wireless data-logger unit. When the Tekscan system was in place, the examiner ex- plained the experimental procedures to the subjects.
Prior to the experiment, the subjects performed a procedure to familiarize themselves with the device for approximately five minutes (Bacarin et al, 2009).
Each insole sensor was calibrated using a walk cali- bration procedure and set to zero prior to each ac- tivity as recommended by the Tekscan system guideline. The first activity was 20 m level walking, and the second activity was stair ascent (stair
height: 17 ㎝, depth: 30 ㎝, width: 217 ㎝, 12 steps) (Figure 2-A). The last activity was a stair descent (Figure 2-B). Each of these activities was performed at a self-selected speed for a habitual walking. The subjects were not permitted to use the handrails during these activities.
Statistical analysis
A two-way repeated analysis of variance (ANOVA) was conducted to examine the differences in the three dependent variables with two within subject factors (activity type and foot region). If a significant activity type by foot region interaction ef- fect was found, then one-way ANOVAs were con- ducted to assess simple effects of activity at each of the nine foot regions. An assessment of the assump- tions of the repeated ANOVA was conducted.
Greenhouse and Geissers method was used to correct departures from sphericity. Post hoc analyses were conducted to determine pair-wise differences using Bonferroni corrections at a significance level of .017 and a 95% confidence interval. A linear regression was conducted to predict peak pressures during the stair ascent and descent by using the peak pressure in metatarsal regions during level walking. The level
Variable Activity Ha M1b M2c M3d M4e M5f MFg MHh LHi
Peak pressure
(kPa)
Level waking
299.2 (144.8j)
187.3 (98.4)
240.2 (71.0)
275.2 (92.52)
195.5 (80.6)
135.0 (55.8)
78.8 (27.3)
230.1 (89.2)
207.8 (77.9) Stair
ascent
213.7 (97.2)†
191.5 (91.44)
225.2 (97.9)‡
236.1 (94.3)†,‡
160.4 (49.5)†
128.3 (65.4)
70.6 (24.0)
136.2 (69.5)†,‡
126.0 (100.0)† Stair
descent
260.1 (155.0)
184.7 (108.4)
160.4 (65.8)†,‡
182.5 (59.6)†,‡
159.9 (60.0)†
116.6 (51.2)
79.9 (19.9)
93.8 (49.3)†,‡
84.6 (48.83)† Pressure
time integral (kPa×s)
Level waking
31.9 (16.0)
28.1 (9.5)
37.4 (13.9)
42.2 (16.3)
34.8 (12.9)
29.5 (10.2)
17.6 (7.0)
30.3 (12.9)
29.2 (19.5) Stair
ascent
32.7 (24.1)
37.9 (20.9)
50.6 (40.5)
49.5 (29.6)
39.2 (20.3)
31.9 (11.9)
20.4 (5.3)
29.6 (13.0)‡
27.3 (15.3)‡ Stair
descent
45.3 (25.8)
40.5 (14.0)†
46.6 (19.6)
49.8 (18.2)
43.7 (13.2)
33.4 (11.5)
18.9 (6.2)
17.7 (11.2)†,‡
17.8 (11.6)†,‡
Contact area (㎠)
Level waking
5.6 (1.6)
10.4 (2.0)
7.3 (1.5)
8.3 (1.5)
8.1 (1.4)
7.3 (1.6)
18.6 (10.5)
15.3 (2.0)
14.5 (1.9) Stair
ascent
5.1 (1.6)†
10.8 (2.4)
7.5 (1.4)‡
8.2 (1.5)
7.9 (1.5)
7.1 (1.8)
20.5 (11.3)†
14.6 (1.7)‡
12.2 (2.7)†,‡
Stair descent
4.8 (1.8)†
11.4 (2.4)†
7.8 (1.5)†,‡
8.2 (1.4)
7.8 (1.2)
7.4 (1.4)
22.6 (11.3)†
12.2 (3.1)†,‡
9.9 (4.1)†,‡
ahallux,bfirst metatarsal head, csecond metatarsal head, dthird metatarsal head,efourth metatarsal head, ffifth metatarsal head, gmid foot, hmedial heel,ilateral heel, jstandard deviation, †significance differences compared to level walking, ‡significance differences between stair ascent and descent.
Table 2. Plantar pressure distribution in the nine foot regions (N=20) of significance was set at α=.05. Statistical analysis
was performed using SPSS ver. 20.0 software (IBM Inc., Somers, NY, USA). All the data are expressed as the mean and standard deviation.
Results
Interaction effect
A significant interaction effect between the activity and the foot region was observed for peak pressure (F=9.508, p<.001) (Table 2). A significant simple ef- fect of activity was found at the H (F=4.963, p=.012), M2 (F=21.083, p<.001), M3 (F=26.504, p<.001), M4 (F=5.822, p=.006), MH (F=52.388, p<.001), and LH (F=33.177, p<.001) regions. Peak pressures were sig- nificantly greater during level walking than during the both stair ascent and descent in the M3, M4, MH, and LH regions. The peak pressure of H was greater during level walking than during the stair ascent, and the peak pressure of M2 was greater
during level walking than during the stair descent.
A significant interaction effect between the activity and the foot region was observed for the pressure time integral (F=5.912, p=.003) (Table 2). To assess the simple effects of activity by foot regions. A sig- nificant simple effect of activity was found at the M1 (F=5.134, p=.011), MH (F=28.620, p<.001), and LH (F=17.366, p<.001). The pressure time integrals were significantly greater during both level walking and the stair ascent than during the stair descent in the MH and LH regions. The pressure time integral of M1 was greater during the stair descent than during level walking.
A significant interaction effect between the activity and foot region was observed for the contact area (F=15.510, p<.001) (Table 2). To assess the simple effects of the activity by foot regions. A significant simple effect of activity was found at the H (F=13.162, p<.001), M1 (F=7.780, p=.003), M2 (F=6.398, p=.010), MF (F=8.208, p=.004), MH (F=17.156, p<.001), and LH (F=35.996, p<.001)
Independent variable
Dependent
variable b Constant R2 Adjusted R2 p
Level M1a Ascent M1 .639 71.822 .472 .443 .001*
Descent M1 .887 18.522 .648 .629 <.001*
Level M2b Ascent M2 .979 -9.948 .504 .476 <.001*
Descent M2 .632 8.631 .464 .434 .001*
Level M3c Ascent M3 .704 31.474 .443 .412 .001*
Descent M3 .470 53.000 .534 .508 <.001*
Level M4d Ascent M4 .505 61.656 .676 .658 <.001*
Descent M4 .499 62.234 .450 .419 .001*
Level M5e Ascent M5 .638 42.227 .296 .257 .013*
Descent M5 .295 76.744 .104 .054 .166
afirst metatarsal head,bsecond metatarsal head, cthird metatarsal head, dfourth metatarsal head, efifth metatarsal head,
*significant findings.
Table 3. Prediction of peak pressure data in the five metatarsal regions during stair ascent and descent from
data during level walking (N=20)
regions. The contact areas were significantly greater during level walking than during either the stair as- cent or descent in the H, MF, and LH regions. The contact area of MH was greater during level walking than during the stair descent, whereas the contact areas of M1 and M2 were greater during the stair descent than during level walking.
Linear relationship
A significant linear relationship between the peak pressure data during level walking and during stair walking was observed. Based on the data, the peak pressure in the five metatarsal regions during the stair ascent and descent was predicted from the data during level walking, except for M5. The regression equations predicting peak pressure during the stair ascent and descent accounted for variance in the range of 25.7% and 65.8% (Table 3).
Discussion
The first purpose of this study was to identify the plantar pressure distributions during level walking,
stair ascent, and descent in AFF. Our results dem- onstrate that activities in the foot region influence the peak pressure. Our results correspond with those of previous studies, which reported that flatfoot ex- hibits hallucal loading patterns during level walking.
The previous studies reported that flatfoot had the highest pressure in H during level walking (Jonely, 2011; Ledoux and Hillstrom, 2002; Rao, 2011). The highest peak pressure data could be explained by flatfoot hypermobility. Ledoux and Hillstrom (2002) reported that foot mobility, especially vertical na- vicular mobility in flatfoot, induces the high pressure.
In another study, Rao et al (2011) reported that a low arch has more metatarsophalangeal joint flexi- bility than a normal arch and induces higher pres- sures in H. In accordance with these studies, our study showed that H had the highest peak pressure during level walking. However, the overall patterns of peak pressure are in close agreement with those reported for normal feet in a previous studies (Rao and Carter, 2012; Wervey et al, 1997). These similar patterns might be due to muscular compensation in AFF. Previous studies suggested that the medial longitudinal arch in AFF is supplemented by com-
pensations by extrinsic muscles, such as the tibialis anterior and peroneus longus (Gray and Basmajian, 1968; Ledoux and Hillstrom, 2002).
The pressure time integral data of our study were influenced by activities in MH and LH. A previous study reported that the pressure time integral data was increased in H, M1 to M5, and MF during stair walking more than level walking in subjects with normal feet (Rao and Carter, 2012). However, in the present study, the total demands applied to H, M1 to M5, and MF were similar among the activities in the subjects with AFF. Instead, the pressure time in- tegrals of MH and LH during the stair descent were reduced significantly more than those during level walking and the stair ascent. The results may be related to the contact pattern of the forefoot includ- ing H and M1 to M5, with the forefoot steps occur- ring first. During the stair walking, the forefoot con- tact pattern dominated the stance phase more than heel initial contact pattern (McFadyen and Winter, 1988). This suggests that a decrease in the heel contact time could contribute to a decreased pressure time integral in MH and LH.
The activities of the foot region were influenced by the contact area in the current study. Previous studies reported that the contact areas in medial parts of foot were increased in flatfoot compared with a normal foot (Ledoux and Hillstrom, 2002;
Sneyers et al, 1995). In accordance with previous studies, our results indicate that the contact area of M1 and M2 increased significantly during the stair ascent and descent and that the contact area of MF increased more than during level walking. In addi- tion, they suggest that the contact area of H was reduced during the stair ascent and descent. These findings could be associated with excessive pronation in flexible flatfoot. Pronation is comprised of forefoot abduction, dorsiflexion, and heel eversion. The hyper- mobility of flexible flatfoot and the more demanding nature of stair walking compared with level walking could induce excessive pronation of the foot (Snook, 2001; Wervey et al, 1997). This could increase the
contact area of the medial part of the foot. In our study, the contact area data of MH and LH sig- nificantly decreased during the stair ascent and de- scent more than level walking. This decrease in MH and LH is in agreement with the pressure time in- tegral data. It may be related to the forefoot contact pattern during stair walking, with a larger area of the metatarsal region inducing a lower contact area of the heel.
The second purpose of this study was to inves- tigate whether peak pressure data during level walk- ing could be used to predict peak pressure during stair walking. Our result shows strong to moderate correlations between the peak pressure in M1-M4 during level walking and stair walking. The pre- diction data of this study indicates that metatarsal regions show a similar pattern during three activities.
In a previous study of subject with normal feet, cor- relation coefficients ranged between 37% and 70%
(Rao and Carter, 2012). The correlation coefficients in the current study (between 25.7% and 65.8%) are lower than those of the previous study. The differ- ences may be related to the hypermobility of flexible flatfoot. As a result of this hypermobility of flexible flatfoot, the activities may induce navicular drop. The differences in the level of navicular drop between in- dividuals make it difficult to predict the peak pres- sure of flatfoot than normal feet. Nevertheless, the model of our study could be useful for evaluating gait patterns and for predicting pressure data of symptomatic flexible flatfoot subjects who have diffi- culty performing activities such as stair walking.
Moreover, the plantar pressure distribution in AFF suggested in this study can be used to analyze gait patterns and to prevent symptoms that could be in- duced in the future by corrections of the gait patterns.
Some limitations of this study need be considered for future studies. First, this study included only ac- tivities of level walking and stair walking. Further studies of flatfoot should include other functional ac- tivities such as jumping, running, and hill climbing.
We used only peak pressure data as a predictor for explaining the differences in the peak pressure be- tween level walking and stair walking. Considering other predictors that may include gender, amount of navicular drop, and symptom are needed in the future.
Conclusion
The first purpose of our study was to determine the plantar pressure distributions during level walk- ing and stair walking in subjects with asymptomatic flatfoot. We conclude that the plantar pressure dis- tributions in asymptomatic flexible flatfoot are differ- ent between level walking and stair walking. The second purpose of our study was to determine whether peak pressure data during level walking could predict peak pressure data during stair walking. The regression results suggest that peak pressure data during level walking could be used to predict peak pressure data during stair walking. We believe that these findings can be used to evaluate gait patterns of asymptomatic flexible flatfoot.
Moreover, they can be used to predict gait patterns in subjects with symptomatic flexible flatfoot who have difficulty performing functional activities be- cause of pain. Further studies are recommended to investigate the plantar pressure distribution during other functional activities, add other predictors to the regression analysis, and include subjects with symp- tomatic flexible flatfoot.
References
Bacarin TA, Sacco IC, Hennig EM. Plantar pressure distribution patterns during gait in diabetic neu- ropathy patients with a history of foot ulcers.
Clinics (Sao Paulo). 2009;64(2):113-120.
Bohannon RW, Larkin PA, Cook AC, et al. Decrease in timed balance test scores with aging. Phys
Ther. 1984;64:1067-1070.
Brody DM. Techniques in the evaluation and treat- ment of the injured runner. Orthop Clin North Am. 1982;13(3):541-558.
Bryant A, Singer K, Tinley P. Comparison of the re- liability of plantar pressure measurements using the two-step and midgait methods of data collection. Foot Ankle Int. 1999;20(10):646-650.
Bus SA, Waaijman R. The value of reporting pres- sure-time integral data in addition to peak pres- sure data in studies on the diabetic foot: A sys- tematic review. Clin Biomech (Bristol, Avon).
2013;28(2):117-121.
Cappello T, Song KM. Determining treatment of flat- feet in children. Curr Opin Pediatr. 1998;10(1):
77-81.
Cavanagh PR, Morag E, Boulton AJ, et al. The rela- tionship of static foot structure to dynamic foot function. J Biomech. 1997;30(3):243-250.
Costigan PA, Deluzio KJ, Wyss UP. Knee and hip kinetics during normal stair climbing. Gait Posture. 2002;16(1):31-37.
Cote KP, Brunet ME, Gansneder BM, et al. Effects of pronated and supinated foot postures on stat- ic and dynamic postural stability. J Athl Train.
2005;40(1):41-46.
Coughlin MJ, Jones CP. Hallux valgus and first ray mobility. A prospective study. J Bone Joint Surg Am. 2007;89(9):1887-1898.
Dyal CM, Feder J, Deland JT, et al. Pes planus in patients with posterior tibial tendon in- sufficiency: Asymptomatic versus symptomatic foot. Foot Ankle Int. 1997;18(2):85-88.
Franco AH. Pes cavus and pes planus. Analyses and treatment. Phys Ther. 1987;67(5):688-694.
Gray EG, Basmajian JV. Electromyography and cine- matography of leg and foot (“normal” and flat) during walking. Anat Rec. 1968;161(1):1-15.
Hong JA. Effects of orthotic insole on peak plantar pressure, center of pressure trajectory, and muscle activity of lower limb during one leg standing in adults with flexible flat foot. Seoul,
Yonsei University, Master Thesis. 2012.
Hӧsl M, Bӧhm H, Multerer C, et al. Does excessive flatfoot deformity affect function? A comparison between symptomatic and asymptomatic flatfeet using the oxford foot model. Gait Posture. 2013.
doi: 10.1016/j.gaitpost.2013.05.017. [Epub ahead of print]
Jonely H, Brismée JM, Sizer PS Jr, et al.
Relationships between clinical measures of static foot posture and plantar pressure during static standing and walking. Clin Biomech (Bristol, Avon). 2011;26(8):873-879.
Kelikian A, Mosca V, Schoenhaus HD, et al. When to operate on pediatric flatfoot. Foot Ankle Spec.
2011;4(2):112-119.
Kitaoka HB, Luo ZP, An KN. Subtalar arthrodesis versus flexor digitorum longus tendon transfer for severe flatfoot deformity: An in vitro bio- mechanical analysis. Foot Ankle Int. 1997;18(11):
710-715.
Kong PW, De Heer H. Wearing the f-scan mobile in-shoe pressure measurement system alters gait characteristics during running. Gait Posture.
2009;29(1):143-145.
Labovitz JM. The algorithmic approach to pediatric flexible pes planovalgus. Clin Podiatr Med Surg.
2006;23(1):57-76, viii.
Laubenthal KN, Smidt GL, Kettelkamp DB. A quan- titative analysis of knee motion during activities of daily living. Phys Ther. 1972;52(1):34-43.
Ledoux WR, Hillstrom HJ. The distributed plantar vertical force of neutrally aligned and pes planus feet. Gait Posture. 2002;15(1):1-9.
Lundeen S, Lundquist K, Cornwall MW, et al.
Plantar pressures during level walking compared with other ambulatory activities. Foot Ankle Int.
1994;15(6):324-328.
Maluf KS, Morley RE Jr, Richter EJ, et al. Foot pressures during level walking are strongly as- sociated with pressures during other ambulatory activities in subjects with diabetic neuropathy.
Arch Phys Med Rehabil. 2004;85(2):253-260.
McFadyen BJ, Winter DA. An integrated bio- mechanical analysis of normal stair ascent and descent. J Biomech. 1988;21(9):733-744.
Menz HB, Latt MD, Tiedemann A, et al. Reliability of the gaitrite walkway system for the quantifi- cation of temporo-spatial parameters of gait in young and older people. Gait Posture. 2004;20(1):
20-25.
Moraleda L, Mubarak SJ. Flexible flatfoot:
Differences in the relative alignment of each segment of the foot between symptomatic and asymptomatic patients. J Pediatr Orthop. 2011;
31(4):421-428.
Mosca VS. Flexible flatfoot in children and adolescents. J Child Orthop. 2010;4(2):107-121.
Neumann DA. Kinesiology of The Musculoskeletal System: Foundations for physical rehabilitation.
1st ed. St Louis, MO, Mosby, 2002:496-500.
Orlin MN, McPoil TG. Plantar pressure assessment.
Phys Ther. 2000;80(4):399-409.
Portney LG, Watkins MP. Foundations of clinical re- search: Applications to practice. 3rd ed. Upper Saddle River, NJ, Pearson/Prentice Hall, 2009:
588-598.
Rao S, Carter S. Regional plantar pressure during walking, stair ascent and descent. Gait Posture.
2012;36(2):265-270.
Rodriguez N, Volpe RG. Clinical diagnosis and as- sessment of the pediatric pes planovalgus deformity. Clin Podiatr Med Surg. 2010;27(1):
43-58.
Sánchez-Rodríguez R, Martínez-Nova A, Escamilla -Martínez E, et al. Can the foot posture index or their individual criteria predict dynamic plan- tar pressures? Gait Posture. 2012;36 (3):591-595.
Sneyers CJ, Lysens R, Feys H, et al. Influence of malalignment of feet on the plantar pressure pattern in running. Foot Ankle Int. 1995;16(10):
624-632.
Snook AG. The relationship between excessive pro- nation as measured by navicular drop and iso- kinetic strength of the ankle musculature. Foot
This article was received August 19, 2013, was reviewed August 19, 2013, and was accepted October 16, 2013.
Ankle Int. 2001;22(3):234-240.
Tsung BY, Zhang M, Mak AF, et al. Effectiveness of insoles on plantar pressure redistribution. J Rehabil Res Dev. 2004;41(6A):767-774.
Teyhen DS, Stoltenberg BE, Eckard TG, et al. Static foot posture associated with dynamic plantar pressure parameters. J Orthop Sports Phys Ther. 2011;41(2):100-107.
Walker M, Fan HJ. Relationship between foot pres- sure pattern and foot type. Foot Ankle Int.
1998;19(6):379-383.
Wallensten R, Eriksson E. Intramuscular pressures in exercise-induced lower leg pain. Int J Sports Med. 1984;5(1):31-35.
Wervey RA, Harris GF, Wertsch JJ. Plantar pressure characteristics during stair climbing and descent.
IEEE. 1997;4:1746-1748.
Williams DS 3rd, McClay IS, Hamill J. Arch struc- ture and injury patterns in runners. Clin Biomech (Bristol, Avon). 2001;16(4):341-347.
Yagerman SE, Cross MB, Positano R, et al.
Evaluation and treatment of symptomatic pes planus. Curr Opin Pediatr. 2011;23(1):60-67.