ISSN 2287-8130(Online) Particle and Aerosol Research
Part. Aerosol Res. Vol. 12, No. 4: December 2016 pp. 161-168 http://dx.doi.org/10.11629/jpaar.2016.12.31.161
입자상물질과 VOCs 동시제거 실증장치에서 자동차 페인트 부스 발생 paint aerosol과 VOCs의 동시제거 성능 특성
이 재 랑1,2)⋅Naim Hasolli1)⋅전 성 민1)⋅이 강 산1)⋅김 광 득1)*⋅박 영 옥1)**
1)
한국에너지기술연구원,
2)고려대학교 화공생명공학과
(2016년 12월 12일 투고, 2016년 12월 26일 수정, 2016년 12월 26일 게재확정)
Performance characteristics of simultaneous removal equipment for paint particulate matter and VOCs generated from a spraying paint booth
Jae-Rang Lee
1,2), Naim Hasolli
1), Seong-Min Jeon
1), Kang-San Lee
1), Kwang-Deuk Kim
1), Young-Ok Park
1)*1)
Climate Change Research Division, Korea Institute of Energy Research
2)
Department of Chemical Biological Engineering, Korea University
Abstract
The purpose of this study is to determine the performance characteristics of the paint particulate and volatile organic compounds(VOCs) simultaneous removal from the spraying paint booth in the laboratory and real site by sticky paint particulate and VOCs simultaneous removal demonstration unit. The sticky paint particulate and VOCs simultaneous removal unit is composed of the horizontal type pleated filter modules and the zig-zag type granular activated carbon packing modules. The test conditions at the laboratory are 50.15 g/m
3of average paint aerosol concentration and 300 ppm of VOCs concentration which were same as the working conditions of spraying paint booth in the real site. But, the demonstration conditions at the real site are varied according to the working condition of spraying paint booth for the kind of passenger car bodies. The test results at the laboratory obtained that 99% of total particulate collection efficiency at 0.62 m/min of filtration velocity and 84% at 1.77 m/min of filtration velocity. The VOCs removal efficiencies are 97% at 3500 hr
-1of gas hour space velocity and 59% at 10,000 hr
-1of gas hour space velocity.
In the real site test, the average removal efficiency of PM10 was measured to be 99.65%, the average removal efficiency of PM2.5 was 99.38%, the average removal efficiency of PM1 was 98.52%, and the average removal efficiency of VOCs was 89%.
Keywords:Paint particulate, Gas hour space velocity, Filter, Paint spraying booth, Filtration velocity
* Corresponding author.
Y.-O. Park, Tel:+82-(0)42-860-3625, E-mail:[email protected],
K.-D. Kim, Tel:+82-(0)42-860-3731, E-mail:[email protected]
1. 서 론
VOCs는 대기에서 광화학반응을 발생하여 2차 오 염물질을 생성하여 세계의 여러에서는 VOCs 농도 규제를 매년 엄하게 하고 있는 추세이다. 이러한 VOCs는 페인트 희석제에 주로 함유하고 있으며, 페 인트 도장과정에서 가장 심하게 VOCs가 발생하는 것을 알 수 있다(Khan, F. I., and Ghoshal, A. K 2000;
Li, F., Niu, J., and Zhang, L.. 2006).
동시적으로 자동차 페인트 도장시설에서는 페인 트 에어로졸 등 다량의 입자상물질이 고농도로 발 생되고 있어 이를 효율적으로 제거하는 기술개발이 필요하다(Duello, L., Reaman, D., and McPhail, H.
2002). VOCs와 페인트 에어로졸 등 입자상물질을 동시 제거하기 위한 처리설비의 개발은 현재까지 이루어지지 않고 있으며, 국내에서는 VOCs와 입자 상물질을 각각 제거하기 위한 기술개발로 한정적으 로 이루지고 있는 실정이다(Yin et al., 2010 and Bong et al., 2013). 자동차 페인트 도장시설에서 발 생하는 대기오염물질을 동시에 제거하는 방법으로 여과필터와 활성탄 모듈을 이용하여, VOCs와 입자 상물질을 동시에 제거하는 방법이 가능하다(Yoo, E.
C., Cho, G. J., and Kim, Y. T. 2004; Lee et al., 2015).
본 연구에서는 국내의 승용차 외장도장시설 현장 에서 배출되는 VOCs와 입자상물질의 평균농도를 파악하고, 이 오염물질을 단일장치 구조 내에서 동 시제거가 가능한 실증규모의 실험장치를 개발하여, 실증장치에 대한 성능특성 평가를 실험실과 자동차 외장도장 booth 현장에서 수행하였다. 또한 실증장 치에 현장실증 실험결과를 토대로 국내의 자동차 외장도장 booth에 VOCs와 입자상물질을 동시제거가 가능한 제어장치를 공급하기 위한 인증자료로 활용 하고자 하는데 목적이 있었다.
2. 실험재료 및 방법
2.1 실험용 페인트
본 연구에서는 입자상물질과 VOCs 동시제거 실 증장치의 성능특성을 실험하기 위해 실험실에서는 자동차 외장도장 booth에서 사용하고 있는 페인트를 실험용 페인트로 사용하였고, 실험용 페인트의 조성
성분을 GC-MSD(Agilent 5975, USA)로 분석하였으 며 조성성분의 분석결과를 표 1에 나타내었다.
Table 1. Compositions of test paint Compounds Mole fraction, -
Toluene 0.801
m/p-Xylene 0.042
Butylacetate 0.054 Methyl Ethyl Ketone 0.025 Ethylbenzene 0.065
o-Xylene 0.004
Ethylacetate 0.005
Acetone 0.004
2.2 실험용 활성탄
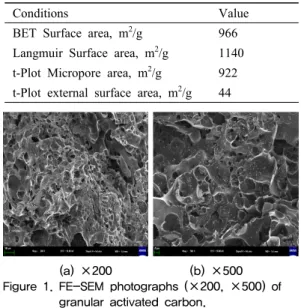
입자상물질과 VOCs 동시제거 실증장치에서 자동 차 외장도장 booth에서 발생되는 VOCs 흡착제거하 기 위해 과립형 활성탄을 사용하였고, 과립형 활성 탄의 물리적 특성을 비표면적 측정분석장비(Micromeritics ASAP 2420, USA)로 분석하였으며, 분석결과를 표 2 에 나타냈었다. 또한 과립형 활성탄의 표면을 고해 상도 전자현미경(Field Emission Scanning Electron Microscope, Sigma HD, Germany)으로 배율 200배와, 500배로 관찰하였으며 그림 1에 나타내었다.
Table 2. Physical characteristics of granular activated carbon
Conditions Value
BET Surface area, m
2/g 966 Langmuir Surface area, m
2/g 1140 t-Plot Micropore area, m
2/g 922 t-Plot external surface area, m
2/g 44
(a) ×200 (b) ×500 Figure 1. FE-SEM photographs (×200, ×500) of
granular activated carbon.
2.3 실험방법 및 실험조건
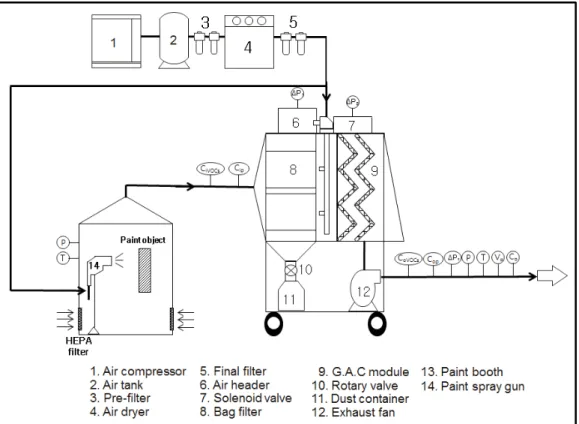
실험실에서 Paint aerosol과 VOCs 동시제거 실증 장치의 성능을 실험하기 위한 실험장치의 흐름도를 그림 2에 나타내었다. 실험장치의 구성으로는 입자 상물질을 제거하는 수평형 여과필터 4본과 VOCs를 제거하기 위해 활성탄이 들어가 있는 지그재그 형 태의 모듈이 있다. 실험은 Paint spray booth에서 자 동차 외장도장 booth에서 사용하는 페인트를 희석용 액과 1:1로 희석하여 분사용 압축공기 3.0kg/cm
2조 건으로 paint spray gun에서 도장물을 향해 분사시켰 으며, 실증장치의 입구에서 VOCs의 농도가 300ppm 이 일정하게 유지되는 조건에서 paint의 분사량을 고정시켜 연속으로 분사하였다. Paint spray booth에 서 유출되는 입자상물질과 VOCs는 수평형 절곡필 터 모듈에서 입자상물질은 제거되고 VOCs 만이 과 립형 활성탄 모듈에 유입되어 제거하였다. 실증장치 의 입구와 출구에서 VOCs의 농도는 총 탄화수소 측 정 장치(Micro Flame Ionization Monitor, Photovac,
Inc, USA)로 축정하였고, 입자상물질의 농도는 입자 상물질 측정 장비(GRIMM Dust monitor 1108)로 측 정하였다. 입자상물질과 VOCs 동시제거 실증장치의 제원을 표 3에 나타냈고, 실험실에서 성능특성을 실 험하기 위한 실험조건을 표 4에 나타내었다.
Table 3. Specification of sticky paint particulate and VOCs simultaneous removal demonstration unit.
Components Value
Type of granular activated
carbon module Zigzag(two channel) Total packing weight of
granular activated carbon, kg 80.5 Number of pleated filter
elements, - 2
Filter media Membrane coated non-woven polyester Filtration area, m
28.28
Figure 2. Flow diagram of the test unit.
Table 4. Experimental conditions for laboratory test
Conditions Value
Flow rate, Nm
3/min 5, 10, 15 Inlet concentration of VOCs, ppm 300 Inlet concentration of particulate
aerosol, g/m
32.44
Operating temperature, ℃ 25 Volume of spraying paint booth, m
35
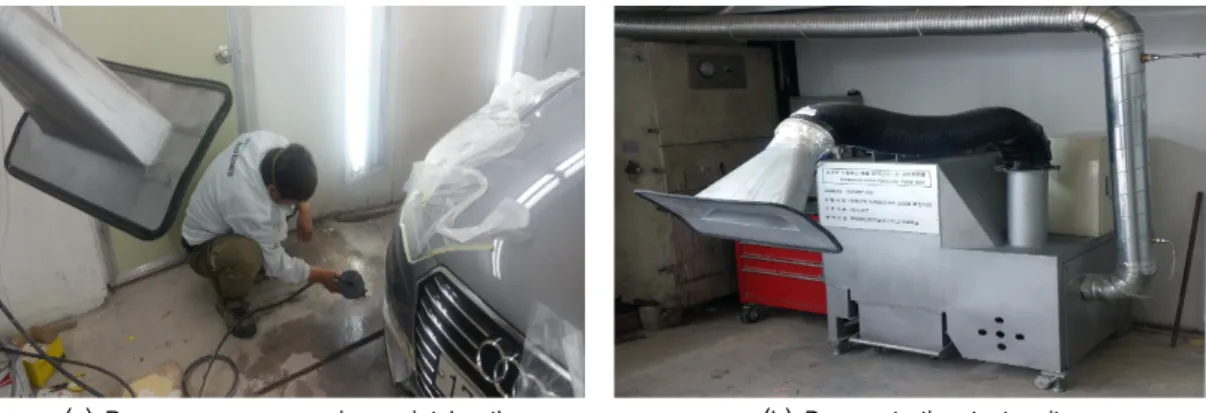
자동차 외장도장 booth 현장에서 실증장치의 실험 방법은 실험실에서 실증장치 성능측정 방법과 같으 며, 자동차 외장도장 booth 내부에서 입자상물질의 농도 측정과 VOCs 농도측정은 실험실에서 사용한 동일한 측정 장비로 도장 작업 시 자동차와 1m 떨 어진 거리에서 측정하였다. 그림 3에 자동차 외장도 장 booth 현장내부와 실증장치를 나타냈고 실험조건 을 표 5에 나타냈다.
Table 5. Experimental conditions for real site test
Conditions Value
Flow rate, Nm
3/min 5
VOCs inlet concentration, ppm 322 Inlet particulate aerosol concentration, g/m
34 Time of paint spray/no. of times, min 25 Indoor temperature, ℃ 25 Volume of spraying paint booth, m
357.48
실증장치의 입자상물질 제거방법은 수평형 백 필 터로 입자를 여과하였다. 입자는 유선(streamline)을 벗어나 여과포의 표면과 충돌하여 포집된다. 입자의 포집 메커니즘은 확산(Diffusion), 차단(Interception), 관성충돌(Inertial Impaction), 중력침강(Gravitational Settling), 그리고 정전기력(Electrostatic Forces)으로 다섯 가지로 분류하고 있다. 단일섬유에 대한 입자 포집 메커니즘은 그림 4에 나타내었다(Hinds, W. C.
1982).
Figure 4. Collection mechanisms of particle for mono fiber.
실증장치의 입구와 출구에서 입자상물질의 농도 를 측정한 값을 토대로 식(1)에 의해 총괄집진효율 을 계산하였고(Hasolli et al., 2013), 입자상물질 크기 별 포집효율, 부분집진효율은 식(2)에 의해 계산하 였다(Leung et al., 2009).
(a) Passenger car spraying paint booth (b) Demonstration test unit
Figure 3. Passenger car spraying paint booth(a) and demonstration unit(b).
η
t=
× 100 (%) (1)
여기서, η
t는 총괄집진효율(%), C
IN는 입구 입자 상물질 개수농도(#/cm
3), C
OUT는 출구 입자상물질의 개수농도(#/cm
3)를 나타낸다.
η
fx= (
) × 100 (%) (2)
여기서, η
fx는 부분집진효율(%)을 나타내며, C
ix는 해당분진 크기에서의 입구 입자상물질의 개수농도 (#/cm
3)를 나타내며, C
ox는 해당분진 크기에서의 출 구 입자상물질의 개수농도(#/cm
3)를 나타낸다.
실증장치의 입구와 출구에서 VOCs의 농도를 측 정한 갓을 토대로 식(3)에 의해 VOCs 제거 효율을 계산하였다(Gallego et al., 2013).
× (3)
여기서, 는 VOCs의 제거효율, C
iVOCs은 실험장 치 입구에서의 VOCs 농도, C
oVOCs은 실험장치 출구 에서의 VOCs 농도를 의미한다.
3 결과 및 고찰
3.1 실험실에서의 실증장치 성능
3.1.1 총괄집진효율여과면적 8.24 m
2에서 여과속도 0.62, 1.24, 1.77 m/min 증가에 따라 총괄집진 효율을 그림 5에 나타 냈다. 페인트 도장 공정에서 발생하는 페인트 aerosol 농도는 2.44 g/m
3으로 유입되었고 배출농도 0.059, 0.063, 0.069 g/m
3으로 총괄집진효율은 98.58, 93.4, 84.13%으로 나타났다.
유체가 필터를 통과하는 것을 여과속도하고 한다.
여과속도가 증가하면 paint aerosol은 필터의 섬유와 섬유사이를 통과하면서 총괄집진효율이 감소하는 경향을 알아볼 수 있으며, 여과속도 변화에 따른 총 괄집진효율 경향을 알아보는 실험을 통해 증명된바 있다(Lee et al., 2015).
Figure 5. Total collection efficiency trend according to filtration velocity of laboratory test.
3.1.2 부분집진효율
0.3 ~ 20 ㎛ 범위의 입자크기에 따른 부분집진효 율을 여과속도 0.62, 1.24, 1.77 m/min 입자크기 1 ㎛ 에서 집진효율은 99.12, 89.22, 74.25% 유지되었고 입자크기 2.5㎛에서는 99.55, 98.21, 92.25%로 유지되 었고 입자크기 10 ㎛에서 집진효율은 100, 99.82, 99.07%로 유지되었고 그림 6에 나타내었다.
이론과 많은 실험을 통해, 먼지 입자가 커지면 커 질수록 부분 집진효율은 커지는 경향을 알 수 있다.
10㎛이하 입자크기의 먼지는 필터를 이용하여 제거 할 수 있다(Hinds, W. C. 1982). 결론적으로, 여과속 도가 1.77 m/min보다 0.62 m/min에서 0.3 ~ 20 ㎛까 지 입자의 부분집진효율이 좋았다. 그러므로 1.77 m/min보다 0.62 m/min에서 페인트 도장업체에서 운 전을 한다면, 높은 부분집진효율 결과를 알 수 있다.
Figure 6. Fractional efficiency trend according to
filtration velocity of laboratory test.
3.1.3 VOCs 제거효율
VOCs 제거효율을 정확히 알기위해, Gas Hour Space Velocity의 적절한 속도를 알아야한다. GHSV 가 낮으면 낮을수록 좋은 제거효율이 나오지만, 한 없이 낮출 수는 없다. 장치 성능에 맞는 효율적인 GHSV를 찾는 것이 중요하다(Guillemot et al., 2007).
실증장치에는 활성탄 지그재그 모듈의 부피는 0.088 m
3, 활성탄의 양은 80.5 kg, VOCs 입구농도는 300 ppm으로 고정하였고 GHSV 3,500, 7,000, 10,000 hr
-1으로 변화시킨 실험결과로는 VOCs 제거효율 97.28, 87.39, 58.89 %를 나타낸 결과, GHSV 3,500 hr
-1실험조건이 가장 우수한 VOCs 제거효율을 보였 고 그 결과를 그림 7에 나타내었다.
Figure 7. VOCs removal efficiency result according to GHSV of laboratory test.
3.2. 자동차 외장 도장 booth에서의 실증장치 성능
3.2.1. 실증장치 입구, 출구에서의 입자상물질 크기분포 및 제거효율
필터의 여과면적을 고정하고 유량을 변화시켜 여 과속도 변화에 따른 총괄집진효율을 파악하여, 가장 좋은 실험조건을 파악하는 것이 중요하다(Lee, et al., 2015). 국내 페인트 도장업체에 적용 가능한 실 증장치로 현장에 실증 실험평가를 해보았으며, 실증 장치로 유입되는 입자 평균 크기는 4 ㎛로 알 수 있 었고 크기별 농도분포 그림 8에 나타내었다. lab scale 실험에서 가장 효율이 좋았던 Filtration velocity 0.62 m/min 조건으로 현장에서 10번의 페인트 도장 시 발생하는 입자 크기별 농도 분포 및 paint aerosol 성능측정 결과를 그림 9, 10, 11에 나타내었다.
PM10의 평균 제거효율은 99.65%, PM2.5의 평균 제거효율은 99.38%, PM1의 평균 제거효율은 98.52%
를 나타내었다.
Figure 8. PM concentration distribution of real site.
Figure 9. PM inlet concentration trend result of real site.
Figure 10. PM outlet concentration trend result of
real site.
Figure 11. PM outlet concentration trend result of real site.
3.2.2. 실증장치의 VOCs 제거효율
국내 페인트 도장업체에 적용 가능한 실증장치로 현장에 실증 실험평가를 해보았다. VOCs 입구농도, 출구농도를 알아야, VOCs 제거효율을 정확히 알 수 있다. 입구농도가 높을수록 출구농도에 영향을 줄 수 있고 장치의 유량이 다르거나 활성탄이 채워진 모듈의 부피가 변한다면, 실험결과에 신뢰성은 현저 히 떨어진다(Ahmad, A. A., & Hameed, B. H., 2010).
본 실증실험에서는 국내 페인트 도장업체에서 실증 장치를 배치하여, laboratory scale에서 VOCs 제거효 율이 좋은 유량 5 Nm
3/min, 활성탄 모듈 부피 0.088 m
3, GHSV 3500 hr
-1실험조건으로 10번의 페인트 도 장 시 1 m 이내 범위에서 VOCs 입구농도로 확인하 고 실증장치의 활성탄 모듈이 지나고 난 뒤 배관부 분에 출구 농도로 확인하여 그림 12를 통하여, VOCs 제거효율을 나타내었고 실증 실험결과 VOCs 평균 제거효율 89%를 나타내었다.
Figure 12. VOCs inlet, outlet concentration and removal efficiency trend result of real site.
4. 결 론
본 연구에서는 페인트 도장부스에서 발생하는 페 인트 aerosol과 VOCs를 동시제거하기 위해 실증장치 를 개발하여 연구하였다. 국내 페인트 도장시설에서 사용 가능한 실증장치에서 여과속도, GHSV 변화에 따른 총괄집진효율, 부분집진효율, VOCs 제거효율 을 고찰하였다. 실험조건으로 여과속도 0.62 m/min, 1.24 m/min, 1.77 m/min 변화를 통해, 여과속도가 가 장 낮은 0.62 m/min에서 총괄집진효율 98.58%로 나 타났다. 또한, 부분집진효율로는 Particulate Matter 2.5 ㎛에서 집진효율 99.55%, Particulate Matter 10㎛
에서 집진효율 99.99%로 가장 좋았다. GHSV 3,500, 7,000, 10,000 hr
-1변화에 따른 VOCs 제거효율로는 GHSV 3,500 hr
-1에서 가장 높은 효율인 97.28%로 나타났다. 실증실험에서는 여과속도 0.62 m/min, GHSV 3,500 hr
-1조건에서 PM10의 평균 제거효율은 99.65%, PM2.5의 평균 제거효율은 99.38 %, PM1의 평균 제거효율은 98.52%, VOCs의 평균 제거효율은 89% 나타내었다. 본 연구를 통해, 페인트 aerosol과 VOCs를 동시제거 가능한 실증장치의 효율적인 운 전조건을 파악하고 국내 페인트 도장 업체에 적용 하여 연구하였다.
감사의 글
본 연구는 한국환경산업기술원에서 주관하는 미 래유망 녹색환경기술 산업화 촉진사업의 연구결과 의 일부이며, 연구비를 지원해 주셔서 감사합니다.
참고문헌