D I A B E T E S & M E T A B O L I S M J O U R N A L
This is an Open Access article distributed under the terms of the Creative Commons At- tribution Non-Commercial License (http://creativecommons.org/licenses/by-nc/3.0/) which permits unrestricted non-commercial use, distribution, and reproduction in any medium, provided the original work is properly cited.
Effectiveness of 3-Day Continuous Glucose Monitoring for Improving Glucose Control in Type 2 Diabetic
Patients in Clinical Practice
Soo Kyoung Kim1,*, Hye Jeong Kim2,*, Taehun Kim2, Kyu Yeon Hur2, Sun Wook Kim2, Moon-Kyu Lee2, Yong-Ki Min2, Kwang-Won Kim2, Jae Hoon Chung2, Jae Hyeon Kim2
1Division of Endocrinology and Metabolism, Department of Internal Medicine, Gyeongsang National University School of Medicine, Jinju,
2Division of Endocrinology and Metabolism, Department of Medicine, Samsung Medical Center, Sungkyunkwan University School of Medicine, Seoul, Korea
Background: The aim of this study was to investigate whether adjusting diabetic treatment regimens according to the informa- tion obtained from a continuous glucose monitoring system (CGMS) might lead to improved glycemic control in patients with type 2 diabetes.
Methods: We reviewed the medical charts of 172 patients who used the CGMS for 1 year starting in December 2008 and the re- cords of 1,500 patients who visited their regular outpatient clinics during December 2008. Of these patients, a total of 65 CGMS patients and 301 regular outpatients (control group) were enrolled in the study after propensity score matching. There were no differences in baseline glycated hemoglobin (HbA1c), age, and duration of diabetes between the CGMS and the control groups after propensity score matching. The changes in the HbA1c levels from baseline to 6 months were calculated.
Results: The CGMS group showed a significant improvement in the HbA1c level compared to the control group at 3 months (7.9%±1.6% vs. 7.4%±1.2%, P=0.001) and at 6 months (7.4%±1.2% vs. 7.9%±1.6%, P=0.010). There were significant differenc- es in the treatment modality changes between the CGMS group and the control group.
Conclusion: Using a 3-day CGMS was advantageous for improving glucose control in patients with type 2 diabetes and may help these patients to optimize glycemic control in clinical practice.
Keywords: Continuous glucose monitoring; Diabetes mellitus, type 2; Hemoglobin A, glycosylated
Corresponding author: Jae Hyeon Kim
Division of Endocrinology and Metabolism, Department of Medicine, Samsung Medical Center, Sungkyunkwan University School of Medicine, 81 Irwon-ro, Gangnam-gu, Seoul 135-710, Korea
E-mail: [email protected]
*Soo Kyoung Kim and Hye Jeong Kim contributed equally to this study as
INTRODUCTION
The United Kingdom Prospective Diabetes Study has suggest- ed that early intensive glucose control may be associated with reductions in microvascular and macrovascular complications [1]. Glycated hemoglobin (HbA1c) is the standard measure of average glycemic control; therefore, normalizing the HbA1c level is important for preventing diabetic complications in pa- tients with type 2 diabetes. However, several studies have re- ported that postprandial hyperglycemia or fluctuation in glu-
cose levels is an independent risk factor for chronic complica- tions of diabetes [2,3]. Current diabetes care depends on mea- surements of HbA1c levels and self-monitored blood glucose (SMBG) levels to assess the quality of glycemic control and to adjust management. SMBG has been shown to be effective for improving glycemic control in patients with insulin treated type 2 diabetes mellitus [4]. However, the usefulness of SMBG in the management of patients with non-insulin treated type 2 diabetes mellitus is not convincing [5,6]. This is, in part, due to limited SMBG measurements and a lack of education. A meth- http://dx.doi.org/10.4093/dmj.2014.38.6.449
pISSN 2233-6079 · eISSN 2233-6087
od for continuous glucose monitoring (CGM) has recently been developed with the aim of evaluating detailed daily glucose pro- files. The continuous glucose monitoring system Gold (CGMS;
Medtronic MiniMed, Northridge, CA, USA) provides retro- spective glucose profiles that allow physicians to detect post- prandial glucose excursions and hypoglycemia [7]. This infor- mation from CGMS is important for determining the appropri- ate treatment and for educating patients concerning food intake and lifestyle.
Several studies have reported that therapeutic adjustments based on CGM data are associated with improvement in HbA1c levels and reduction in hypoglycemia [8,9]. However, other studies have shown that similar improvement in glycemic con- trol is observed in patients performing SMBG [10-12]. The ma- jority of these studies have been performed in patients with type 1 diabetes or in patients with insulin treated type 2 diabetes.
The American Diabetes Association recommends that CGM in conjunction with intensive insulin regimens is a useful tool in lowering HbA1c levels in selected adults (older than 25 years) with type 1 diabetes mellitus [13]; however, this recommenda- tion is for real-time CGM devices [14], and there is no consen- sus regarding the use of CGM in patients with type 2 diabetes.
CGMS provides the glucose profiles retrospectively. CGMS alone does not result in better metabolic control; however, CGMS provides clinicians and patients with detailed glucose profiles that allow for improved glycemic control. Improved glycemic control could therefore result from a change in the pa- tient’s diabetic regimen or from the patient’s education.
A lack of data exists regarding the effectiveness of CGM for improving glucose control in patients with type 2 diabetes. Dai- ly CGM could be useful for managing diabetic patients; howev- er, long-term CGM is expensive and difficult to apply. There- fore, CGM is usually performed for 3 to 5 days. In Korea, CGM has so far been available for only a 3-day period in clinical set- tings.
In the present study, we report our experience using CGMS in a single diabetes clinic. We investigated whether adjusting the diabetic treatment regimens obtained from the CGMS in- formation might lead to improved glycemic control in patients with type 2 diabetes compared to the control group.
METHODS
Subjects, material, and methods
We started using CGMS in our clinic for managing patients
with type 2 diabetes mellitus in December 2008. At that time, our clinic was staffed by five endocrinologists and three certi- fied diabetes educators. All of the patients who used CGMS underwent a one-on-one 90-minute training and evaluation session. Sensor placement was performed by one of our certi- fied diabetes educators. During the CGMS use, the patients were instructed to obtain a minimum of three SMBG mea- surements per day and to record in a logbook the glucose val- ues, meals, insulin doses, and symptoms of hypoglycemia.
The charts of all patients were reviewed by the same impar- tial physician. All of the patients used the CGMS for 3 days be- fore returning to the hospital, where their CGMS glucose pro- files were downloaded onto a personal computer. The patients’
CGMS glucose values were retrospectively reported in the range of 40 to 400 mg/dL. The glucose profiles were reviewed by an endocrinologist who adjusted the patients’ diabetic man- agement regimens. A total of 172 patients were started on the CGMS between December 2008 and November 2009. The de- cision to use the CGMS was made by an endocrinologist. Of these patients, one patient had gestational diabetes, 45 patients had type 1 diabetes mellitus, and 101 patients had type 2 dia- betes mellitus. Seventeen of these patients were excluded from the study because of a lack of HbA1c measurements before the CGMS period and at 3 months post-CGMS use. A total of 84 patients with type 2 diabetes were finally enrolled in the study.
There were no significant differences in the clinical character- istics between the enrolled group and the excluded group of patients with type 2 diabetes during the CGMS period (data not shown).
We selected the insulin treated control group from the pa- tients who visited our clinics over a 3-month starting in De- cember 2008 (n=658), and we selected the non-insulin treated control group from the patients who visited our clinics over a 2-week period in December 2008 (n=842). Patients with can- cer or severe illness and those with creatinine levels exceeding 2 mg/dL were excluded from the study, as were patients with no HbA1c data. During their regular outpatient clinic visits, the control patients were instructed by a doctor to modify their lifestyle or diabetic medications according to their HbA1c lev- els. Of the 1,500 patients screened, a total of 747 patients with type 2 diabetes were enrolled in the control group. There were significant differences in age, baseline HbA1c, and body mass index (BMI) between the CGMS and the control groups; thus, a propensity score matching analysis was performed. The final samples for the matched comparisons comprised 65 CGMS
subjects and 301 control subjects.
The following types of recommendations were made based on the CGMS data and HbA1c levels for the CGMS group and HbA1c data for the control group: (1) no change in medications;
(2) add or change the dose of the oral hypoglycemic agents (OHAs); (3) add insulin therapy to the OHAs in the non-insulin treated subgroup, and (1) no change in medications; (2) add or change the dose of the OHAs; and (3) change the insulin regi- mens (from basal to biphasic or basal and prandial insulin regi- men or from biphasic to basal and prandial insulin regimen) in the insulin treated subgroup.
The HbA1c levels were measured 3 months before enroll- ment in the study, at the time of enrollment, and at 3 and 6 months postenrollment.
We obtained approval for this study design from the Ethical Committee of Samsung Medical Center at Sungkyunkwan Uni- versity School of Medicine in Seoul, Korea.
Statistical analysis
The data are presented as the mean±standard deviation (SD) or median values (25th percentile to 75th percentile).
A subgroup analysis was performed according to the type of treatment (noninsulin therapy vs. insulin therapy). The mean glucose, SD, continuous overall net glycemic action (CONGA), mean of daily differences (MODDs) [15], and percentage of the hypoglycemic event were calculated from the CGMS data. The CONGA, the MODD, and SD have been developed to evaluate glycemic variability using the CGM data [15]. The hypoglyce- mic events (levels less than 60 mg/dL) were measured as a per- centage of the total events during the CGMS.
To reduce confounding effects and to adjust baseline differ- ences between the two groups, a propensity score matching analysis was performed. Clinical significance guided the initial choice of covariates, which included age, sex, BMI, baseline HbA1c, duration of diabetes, and treatment modality. A com- parison between the two groups was performed using the chi- squared or Fisher exact tests for categorical variables and the Mann-Whitney test for continuous variables. To evaluate the CGMS effect on the reduction in the HbA1c level from base- line to 3 and 6 months, we performed the repeated-measure analysis of variance after propensity score weights.
A statistical analysis was performed using PASW version 18.0 (IBM Co., Armonk, NY, USA). For all statistical analyses, a P<0.05 (two-sided) was considered to be statistically significant.
RESULTS
Baseline characteristics
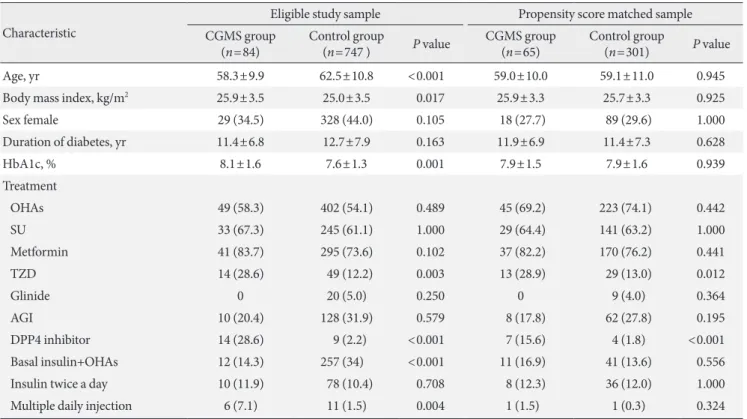
The overall baseline characteristics of the CGMS patients and the control patients are shown in Table 1. There were significant differences between the CGMS group and the control group in terms of age, glycemic control status (HbA1c), BMI, and treat- ment modality. However, the baseline characteristics, including age, baseline HbA1c, and BMI, were not significantly different between the CGMS patients and the control patients after pro- pensity score adjustment (Table 1). With respect to treatment modality, there was no difference between the CGMS group and the control group regarding the use of sulfonylurea or met- formin; however, the CGMS group more frequently used di- peptidyl peptidase 4 (DPP4) inhibitors and thiazolidinediones.
There was no significant difference in insulin treatment modal- ity between the CGMS group and the control group after pro- pensity score adjustment (Table 1).
Clinical outcomes
The CGMS results of 65 patients are shown in Table 2. The mean glucose value during CGMS was 157.7 mg/dL, and 24 patients (37%) experienced the hypoglycemia events during CGMS. Of these patients who experienced the hypoglycemic events, 15 patients (62.5%) were treated with OHAs and nine patients (37.5%) were treated with insulin therapy. Fourteen patients (93.3%) with OHAs changed the dose of OHAs after using CGMS (four patients reduced the dose of OHAs and 10 patients added the DPP4 inhibitors). Seven patients (77.7%) with insulin therapy changed the insulin regimen after using CGMS (from basal to biphasic or basal and prandial insulin regimen).
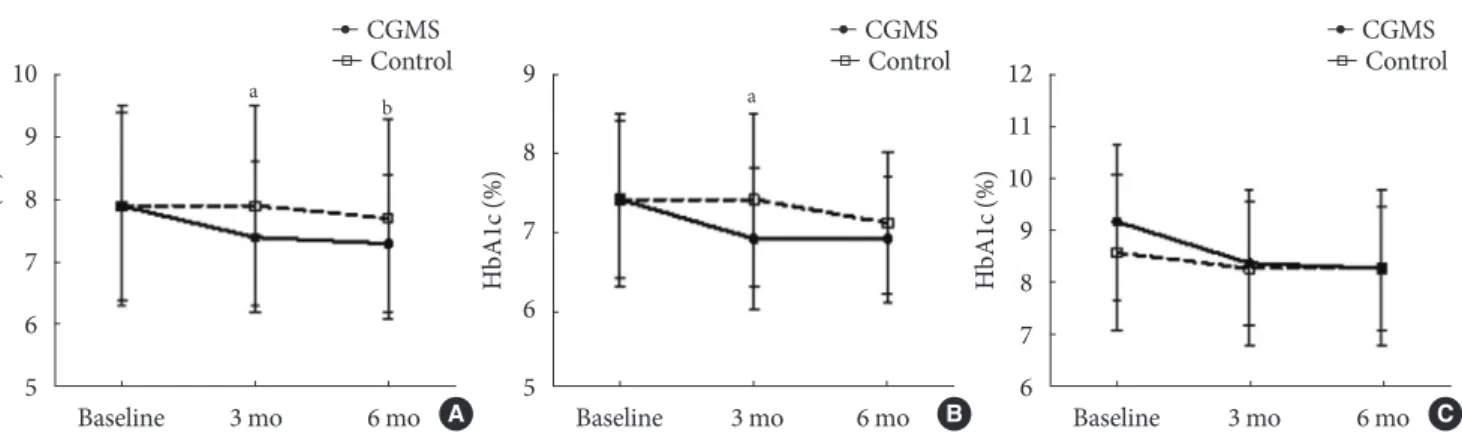
The CGMS group showed a significant improvement in HbA1c levels compared to the control group at 3 months (7.4%±1.2% vs.
7.9%±1.6%, P=0.001) and at 6 months (7.3%±1.1% vs. 7.7%±
1.6%, P=0.010) after propensity score matching (Fig. 1A).
There was no significant difference in baseline HbA1c levels between the non-insulin treated CGMS subgroup (n=45) and the non-insulin treated control subgroup (n=223) after pro- pensity score matching (7.4%±1.0% vs. 7.1%±1.1%, P=0.660).
There was a significant difference in the reduction of HbA1c levels between the CGMS and the control groups at 3 months (6.9%±0.9% vs. 7.4%±1.1%, P=0.006) after propensity score matching (Fig. 1B). However, there was no difference between the CGMS and the control groups at 6 months (6.9%±0.8% vs.
7.1%±0.9%, P=0.153).
Additionally, there was no significant difference in baseline HbA1c levels between the insulin treated CGMS subgroup (n=20) and the insulin treated control subgroup (n=78) after propensity score matching (9.2%±1.5% vs. 8.6%±1.5%, P=
0.744). The mean HbA1c level was not significantly improved in the insulin treated CGMS subgroup compared to the insu-
lin treated control subgroup at 3 months (8.4%±1.2% vs. 8.3%
±1.5%, P=0.768) and at 6 months (8.3%±1.2% vs. 8.3%±
1.5%, P=0.388) after propensity score matching (Fig. 1C).
Tables 3 and 4 show the percentage of patients whose diabet- ic regimens were altered. In the insulin treated CGMS sub- group (n=20), five patients (25.0%) added or changed the dose of OHAs, eight patients (40%) received only education on insu- lin dose titration, and seven patients (35%) changed their insu- lin regimen (from basal to biphasic in one patient, from basal to basal and prandial in four patients, and from biphasic to basal and prandial in two patients).
In the insulin treated control subgroup, four patients (5.1%) added or changed the dose of OHAs, 66 patients (84.6%) did not change the treatment modality, and eight patients (10.3%) changed their insulin regimen (from basal to biphasic in five patients, from basal to basal and prandial in two patients, and from biphasic to basal and prandial in one patient). There were significant differences in the change of diabetic treatment regi- mens between the insulin treated CGMS and the insulin treat- ed control subgroups (Table 3). The insulin treated CGMS sub- Table 1. Baseline characteristics of CGMS and control groups
Characteristic
Eligible study sample Propensity score matched sample CGMS group
(n=84) Control group
(n=747 ) P value CGMS group
(n=65) Control group
(n=301) P value
Age, yr 58.3±9.9 62.5±10.8 <0.001 59.0±10.0 59.1±11.0 0.945
Body mass index, kg/m2 25.9±3.5 25.0±3.5 0.017 25.9±3.3 25.7±3.3 0.925
Sex female 29 (34.5) 328 (44.0) 0.105 18 (27.7) 89 (29.6) 1.000
Duration of diabetes, yr 11.4±6.8 12.7±7.9 0.163 11.9±6.9 11.4±7.3 0.628
HbA1c, % 8.1±1.6 7.6±1.3 0.001 7.9±1.5 7.9±1.6 0.939
Treatment
OHAs 49 (58.3) 402 (54.1) 0.489 45 (69.2) 223 (74.1) 0.442
SU 33 (67.3) 245 (61.1) 1.000 29 (64.4) 141 (63.2) 1.000
Metformin 41 (83.7) 295 (73.6) 0.102 37 (82.2) 170 (76.2) 0.441
TZD 14 (28.6) 49 (12.2) 0.003 13 (28.9) 29 (13.0) 0.012
Glinide 0 20 (5.0) 0.250 0 9 (4.0) 0.364
AGI 10 (20.4) 128 (31.9) 0.579 8 (17.8) 62 (27.8) 0.195
DPP4 inhibitor 14 (28.6) 9 (2.2) <0.001 7 (15.6) 4 (1.8) <0.001
Basal insulin+OHAs 12 (14.3) 257 (34) <0.001 11 (16.9) 41 (13.6) 0.556
Insulin twice a day 10 (11.9) 78 (10.4) 0.708 8 (12.3) 36 (12.0) 1.000
Multiple daily injection 6 (7.1) 11 (1.5) 0.004 1 (1.5) 1 (0.3) 0.324
Values are presented as mean±standard deviation or number (%).
CGMS, continuous glucose monitoring system; HbA1c, glycated hemoglobin; OHA, oral hypoglycemic agent; SU, sulfonylurea; TZD, thiazoli- dinedione; AGI, α-glucosidase inhibitor; DPP4, dipeptidyl peptidase 4.
Table 2. Results of CGMS in 65 patients
CGMS parameter All subjects
Mean glucose, mg/dL 157.7±49.0
SD of glucose, mg/dL 49.0±21.9
CONGA 24, mg/dL 49.2±19.9
MODD, mg/dL 46.9±20.8
Hypoglycemic events during CGMS, % 0.0 (0.0–3.0) Values are presented as mean±standard deviation or median (25th percentile to 75th percentile). Hypoglycemia, <60 mg/dL.
CGMS, continuous glucose monitoring system; SD, standard devia- tion; CONGA24, continuous overall net glycemic action 24 hours;
MODD, mean of daily difference.
group had made more changes to their insulin regimens and added or changed OHAs compared to the control group (P=
0.001).
In the non-insulin treated CGMS subgroup, 35 patients (77.8%) added or changed the dose of OHAs, one patient (2.2%) added basal insulin, and nine patients (20%) did not change their treat- ment modality. In the non-insulin treated control subgroup, 85 patients (38.1%) added or changed the dose of OHAs, one pa- tient (0.5%) added basal insulin, and 137 patients (61.4%) did not change their treatment modality. The non-insulin treated CGMS subgroup had added or changed the dose of OHAs more than the non-insulin treated control subgroup (Table 4).
DISCUSSION
The results of the present study showed that using CGMS in clinical practice benefits the patients with type 2 diabetes. The glucose data from the CGMS revealed distinct glucose profiles
that physicians can use to optimize patient therapy, leading to lifestyle changes and improved diabetic treatment regimens.
We monitored patients for 6 months after CGMS use to deter- mine if these alterations had contributed to sustained improve- ments in glycemic control, as assessed by the patients’ HbA1c values. The patients’ HbA1c values were improved at 3 months post CGMS and were sustained at 6 months.
A recent study has shown that the additional information provided by the CGMS did not result in improved HbA1c lev- els compared to the standard control group in patients with in- sulin treated diabetes [16]. The authors indicated that their study group was heterogeneous and that their patients were re- ceiving a variety of treatment regimens that may have limited the impact of CGMS on the patients’ glycemic control. Our study showed that CGMS did not result in improved HbA1c levels in patients with insulin treated diabetes. However, the patients with OHAs in the CGMS group showed improved glu- cose control. In our study group, the control group did not Baseline 3 mo 6 mo
HbA1c (%)
10 9 8 7 6 5
CGMSControl
a b
Baseline 3 mo 6 mo
HbA1c (%)
12 11 10 9 8 7 6
CGMSControl
Baseline 3 mo 6 mo
HbA1c (%)
9
8
7
6
5
CGMSControl
a
A B C
Fig. 1. Change in the mean glycated hemoglobin (HbA1c) level in the (A) propensity score matched continuous glucose moni- toring system (CGMS) and control groups, (B) propensity score matched non-insulin treated CGMS and control groups, and (C) propensity score matched insulin-treated CGMS and control groups. Values are presented as mean±standard deviation.
aP<0.05 vs. control at 3 months, bP<0.05 vs. control at 6 months.
Table 3. Recommended changes for diabetic treatment regi- mens between the insulintreated CGMS and the insulintreat- ed control subgroups after propensity score matching
Variable CGMS group
(n=20) Control group (n=78) P value Change in insulin regimens 7 (35.0) 8 (10.3) 0.036 Adding or change in OHAs 5 (25.0) 4 (5.1) 0.012 No change in regimen 8 (40.0) 66 (84.6) 0.001 Values are presented as number (%).
CGMS, continuous glucose monitoring system; OHA, oral hypogly- cemic agent.
Table 4. Recommended changes for diabetic treatment regi- mens between the non-insulin treated CGMS and the non-in- sulin treated control subgroups after propensity score matching
Variable CGMS group
(n=45) Control group (n=223) P value Add insulin therapy 1 (2.2) 1 (0.5) 0.324 Adding or change in OHAs 35 (77.8) 85 (38.1) 0.001
No change 9 (20.0) 137 (61.4) 0.001
Values are presented as number (%).
CGMS, continuous glucose monitoring system; OHA, oral hypogly- cemic agent.
show a significant improvement in HbA1c levels at 3 months.
The non-insulin treated CGMS subgroup showed significant improvements in mean HbA1c levels compared to the non-in- sulin treated control subgroup at 3 months. The reason for these different results may be explained in the following man- ner. The percentage of patients in the non-insulin treated con- trol subgroup whose diabetic regimen was altered was different from that of the CGMS group. The non-insulin treated CGMS subgroup had more changes made to their noninsulin treat- ment regimen compared to the non-insulin treated control subgroup (P=0.001). After CGMS, the clinician could detect postprandial glucose excursions and hypoglycemia; thus, the clinician could educate patients or change their diabetic regi- mens. For example, many patients who experienced hypogly- cemia while using the CGMS showed patterns of postprandial hyperglycemia and fasting hypoglycemia. In these patients, al- though we did not compare the detailed changes in the OHAs regimens between the CGMS and the control groups, the hy- poglycemic group after CGMS changed their diabetic regimen with DDP4 inhibitors and reduced the dosage of OHAs. We believe that these factors led to the improvement of glycemic control. These factors imply that CGMS not only should pro- vide education and motivate patients but also should be used as a tool for making therapeutic adjustments in clinical practice.
Many studies have shown that inadequate glycemic control might reflect the delay or the absence of the initiation of inten- sification of antidiabetic treatment. In our study, physicians changed the diabetic regimen more frequently after CGMS. As previously stated, the CGMS is not in itself a treatment tool. An important factor for improving glycemic control after a 3-day use of CGMS may be the opportunity for clinicians to change treatment modality, to escape from clinical inertia, to provide education and to motivate the patients.
Previous randomized, controlled trials have compared the effects of CGMS with those of frequent capillary monitoring for improving metabolic control and have studied the effects of additional information obtained from the use of CGMS with SMBG on the improvement of metabolic control [17,18]. In clinical practice, patients with type 2 diabetes practice SMBG less frequently than what is described as the recommended fre- quency [19]; in such cases, a CGMS is useful for educating and motivating for patients with type 2 diabetes in clinical practice.
One limitation in this study is that the data were collected retrospectively. First, the glucose control status was different from that of the control group. The insulin treated CGMS sub-
group had poorer glycemic control than the insulin treated control subgroup. We reanalyzed the data after propensity score matching. After propensity score matching, there was a significant improvement in glucose control after CGMS. Sec- ond, there were no records regarding hypoglycemia, patients’
education, reasons for CGMS, and the reasons for no diabetic regimen changes or changes in the control group and in the CGMS group. Third, there was no detailed information con- cerning diabetic regimen changes; hence, the precise reasons for improved glucose control in the CGMS group are uncer- tain. However, this study was conducted to evaluate the effects of CGMS in clinical practice. An additional study with a larger prospective study sample is needed to clarify the effects of CGMS on metabolic control in patients with type 2 diabetes.
Our study showed that the 3-day application of CGMS is useful in improving glucose control in clinical practice. CGMS represents a useful tool for optimizing glycemic control in clin- ical practice and in patients with type 2 diabetes.
CONFLICTS OF INTEREST
No potential conflict of interest relevant to this article was re- ported.
REFERENCES
1. Holman RR, Paul SK, Bethel MA, Matthews DR, Neil HA. 10- year follow-up of intensive glucose control in type 2 diabetes.
N Engl J Med 2008;359:1577-89.
2. Monnier L, Mas E, Ginet C, Michel F, Villon L, Cristol JP, Co- lette C. Activation of oxidative stress by acute glucose fluctua- tions compared with sustained chronic hyperglycemia in pa- tients with type 2 diabetes. JAMA 2006;295:1681-7.
3. Ceriello A. Postprandial hyperglycemia and diabetes compli- cations: is it time to treat? Diabetes 2005;54:1-7.
4. Varanauskiene E. Can blood glucose self-monitoring improve treatment outcomes in type 2 diabetes? Diabetes Res Clin Pract 2008;82 Suppl 2:S112-7.
5. Farmer A, Wade A, Goyder E, Yudkin P, French D, Craven A, Holman R, Kinmonth AL, Neil A. Impact of self monitoring of blood glucose in the management of patients with non-insulin treated diabetes: open parallel group randomised trial. BMJ 2007;335:132.
6. Farmer AJ, Wade AN, French DP, Simon J, Yudkin P, Gray A, Craven A, Goyder L, Holman RR, Mant D, Kinmonth AL, Neil
HA, DiGEM Trial Group. Blood glucose self-monitoring in type 2 diabetes: a randomised controlled trial. Health Technol Assess 2009;13:iii-iv, ix-xi, 1-50.
7. Gross TM, Bode BW, Einhorn D, Kayne DM, Reed JH, White NH, Mastrototaro JJ. Performance evaluation of the MiniMed continuous glucose monitoring system during patient home use. Diabetes Technol Ther 2000;2:49-56.
8. Lagarde WH, Barrows FP, Davenport ML, Kang M, Guess HA, Calikoglu AS. Continuous subcutaneous glucose monitoring in children with type 1 diabetes mellitus: a single-blind, random- ized, controlled trial. Pediatr Diabetes 2006;7:159-64.
9. Ludvigsson J, Hanas R. Continuous subcutaneous glucose mon- itoring improved metabolic control in pediatric patients with type 1 diabetes: a controlled crossover study. Pediatrics 2003;
111(5 Pt 1):933-8.
10. Tanenberg R, Bode B, Lane W, Levetan C, Mestman J, Harmel AP, Tobian J, Gross T, Mastrototaro J. Use of the continuous glu- cose monitoring system to guide therapy in patients with insu- lin-treated diabetes: a randomized controlled trial. Mayo Clin Proc 2004;79:1521-6.
11. Yates K, Hasnat Milton A, Dear K, Ambler G. Continuous glu- cose monitoring-guided insulin adjustment in children and ad- olescents on near-physiological insulin regimens: a randomized controlled trial. Diabetes Care 2006;29:1512-7.
12. Chase HP, Kim LM, Owen SL, MacKenzie TA, Klingensmith GJ, Murtfeldt R, Garg SK. Continuous subcutaneous glucose monitoring in children with type 1 diabetes. Pediatrics 2001;
107:222-6.
13. Funnell MM, Brown TL, Childs BP, Haas LB, Hosey GM, Jen- sen B, Maryniuk M, Peyrot M, Piette JD, Reader D, Siminerio LM, Weinger K, Weiss MA. National standards for diabetes self-management education. Diabetes Care 2010;33 Suppl 1:
S89-96.
14. Juvenile Diabetes Research Foundation Continuous Glucose Monitoring Study Group, Tamborlane WV, Beck RW, Bode BW, Buckingham B, Chase HP, Clemons R, Fiallo-Scharer R, Fox LA, Gilliam LK, Hirsch IB, Huang ES, Kollman C, Kowal- ski AJ, Laffel L, Lawrence JM, Lee J, Mauras N, O’Grady M, Ruedy KJ, Tansey M, Tsalikian E, Weinzimer S, Wilson DM, Wolpert H, Wysocki T, Xing D. Continuous glucose monitor- ing and intensive treatment of type 1 diabetes. N Engl J Med 2008;359:1464-76.
15. Rodbard D. Interpretation of continuous glucose monitoring data: glycemic variability and quality of glycemic control. Dia- betes Technol Ther 2009;11 Suppl 1:S55-67.
16. Cooke D, Hurel SJ, Casbard A, Steed L, Walker S, Meredith S, Nunn AJ, Manca A, Sculpher M, Barnard M, Kerr D, Weaver JU, Ahlquist J, Newman SP. Randomized controlled trial to as- sess the impact of continuous glucose monitoring on HbA(1c) in insulin-treated diabetes (MITRE Study). Diabet Med 2009;
26:540-7.
17. Chico A, Vidal-Rios P, Subira M, Novials A. The continuous glucose monitoring system is useful for detecting unrecognized hypoglycemias in patients with type 1 and type 2 diabetes but is not better than frequent capillary glucose measurements for improving metabolic control. Diabetes Care 2003;26:1153-7.
18. Boland E, Monsod T, Delucia M, Brandt CA, Fernando S, Tam- borlane WV. Limitations of conventional methods of self-mon- itoring of blood glucose: lessons learned from 3 days of contin- uous glucose sensing in pediatric patients with type 1 diabetes.
Diabetes Care 2001;24:1858-62.
19. Karter AJ, Ferrara A, Darbinian JA, Ackerson LM, Selby JV.
Self-monitoring of blood glucose: language and financial barri- ers in a managed care population with diabetes. Diabetes Care 2000;23:477-83.