D I A B E T E S & M E T A B O L I S M J O U R N A L
This is an Open Access article distributed under the terms of the Creative Commons Attribution Non-Commercial License (https://creativecommons.org/licenses/by-nc/4.0/) which permits unrestricted non-commercial use, distribution, and reproduction in any medium, provided the original work is properly cited.
Glucagon-Like Peptide-1 Receptor Agonist Differentially Affects Brain Activation in Response to Visual Food
Cues in Lean and Obese Individuals with Type 2 Diabetes Mellitus
Jae Hyun Bae1,2,*, Hyung Jin Choi3,4,5,*, Kang Ik Kevin Cho6,7, Lee Kyung Kim1,8, Jun Soo Kwon6,7,9, Young Min Cho10
1Department of Medicine, Seoul National University College of Medicine, Seoul,
2Department of Internal Medicine, Korea University Anam Hospital, Korea University College of Medicine, Seoul,
3Department of Anatomy, Seoul National University College of Medicine, Seoul,
4Neuroscience Research Institute, 5Wide River Institute of Immunology, Seoul National University, Seoul,
6Department of Brain and Cognitive Sciences, Seoul National University College of Natural Sciences, Seoul,
7Institute of Human Behavioral Medicine, Seoul National University Medical Research Center, Seoul,
8Department of Internal Medicine, Cheju Halla General Hospital, Jeju,
Departments of 9Psychiatry, 10Internal Medicine, Seoul National University College of Medicine, Seoul, Korea
Background: To investigate the effects of a glucagon-like peptide-1 receptor agonist on functional brain activation in lean and obese individuals with type 2 diabetes mellitus (T2DM) in response to visual food cues.
Methods: In a randomized, single-blinded, crossover study, 15 lean and 14 obese individuals with T2DM were administered lix- isenatide or normal saline subcutaneously with a 1-week washout period. We evaluated brain activation in response to pictures of high-calorie food, low-calorie food, and nonfood using functional magnetic resonance imaging and measured appetite and ca- loric intake in participants who were given access to an ad libitum buffet.
Results: Obese individuals with T2DM showed significantly greater activation of the hypothalamus, pineal gland, parietal cortex (high-calorie food vs. low-calorie food, P<0.05), orbitofrontal cortex (high-calorie food vs. nonfood, P<0.05), and visual cortex (food vs. nonfood, P<0.05) than lean individuals with T2DM. Lixisenatide injection significantly reduced the functional activa- tion of the fusiform gyrus and lateral ventricle in obese individuals with T2DM compared with that in lean individuals with T2DM (nonfood vs. high-calorie food, P<0.05). In addition, in individuals who decreased their caloric intake after lixisenatide injection, there were significant interaction effects between group and treatment in the posterior cingulate, medial frontal cortex (high-calo- rie food vs. low-calorie food, P<0.05), hypothalamus, orbitofrontal cortex, and temporal lobe (food vs. nonfood, P<0.05).
Conclusion: Brain responses to visual food cues were different in lean and obese individuals with T2DM. In addition, acute ad- ministration of lixisenatide differentially affected functional brain activation in these individuals, especially in those who de- creased their caloric intake after lixisenatide injection.
Keywords: Appetite; Brain; Diabetes mellitus, type 2; Energy intake; Functional neuroimaging; Glucagon-like peptide 1; Lix- isenatide; Magnetic resonance imaging; Obesity
Corresponding author: Young Min Cho https://orcid.org/0000-0002-2331-6126 Department of Internal Medicine, Seoul National University College of Medicine, 101 Daehak-ro, Jongno-gu, Seoul 03080, Korea
E-mail: [email protected]
INTRODUCTION
Obesity is a major risk factor for type 2 diabetes mellitus
(T2DM) [1,2], and its prevalence has been increased globally over the past four decades [3]. The pathogenesis of obesity is complex, but abnormalities in neural circuits that regulate en- https://doi.org/10.4093/dmj.2019.0018
pISSN 2233-6079 · eISSN 2233-6087
ergy intake and energy expenditure are crucial to the develop- ment of obesity [4]. In the control of energy homeostasis, the hypothalamus plays an essential role by integrating internal and external signals and influencing consequent metabolic re- sponses [5,6]. The hypothalamus also has extrahypothalamic connections to the brainstem, mesolimbic system, pituitary gland, and vagus nerve, all of which help to maintain metabol- ic homeostasis [5]. In this process, leptin, the melanocortin system, and gut-derived peptides, including glucagon-like peptide-1 (GLP-1), serve as regulators of appetite and feeding behavior [4,5]. Therefore, the central regulation of energy bal- ance is a key component of the pathophysiology of obesity [7].
GLP-1 is an incretin hormone that is mainly secreted from enteroendocrine L cells in response to the ingestion of nutri- ents. GLP-1 enhances glucose-stimulated insulin secretion and suppresses glucagon secretion in a glucose-dependent manner [8]. Currently, guidelines recommend GLP-1 receptor agonists for the treatment of T2DM [9,10]. GLP-1 receptor agonists also promote significant weight loss in obese individuals [11], and 3.0 mg of liraglutide has been approved for the treatment of obesity [12]. A recent study showed that 0.05 to 0.4 mg of oral semaglutide per day resulted in a >15% and >20% weight loss in 7% to 56% and 4% to 27% of obese individuals without diabetes mellitus, respectively [13]. In rodents, the GLP-1 re- ceptor agonist not only decreases energy intake but also in- creases energy expenditure through white adipose tissue browning and brown adipose tissue thermogenesis [14-16].
On the other hand, in humans, the GLP-1 receptor agonist in- duces weight loss by decreasing appetite and energy intake rather than increasing energy expenditure [17]. GLP-1 directly stimulates proopiomelanocortin/cocaine- and amphetamine- regulated transcript neurons and indirectly inhibits agouti-re- lated peptide/neuropeptide Y neurons via gamma-aminobu- tyric acid signaling in the arcuate nucleus to reduce food intake [18]. Moreover, GLP-1 affects the hindbrain and vagal affer- ents, leading to meal termination [19-21]. However, the mech- anism underlying the effects of GLP-1 on energy intake is not fully understood.
In studies using functional magnetic resonance imaging (fMRI), individuals with obesity or T2DM exhibited differenc- es in the functional activities of the brain compared with those in normal individuals. The affected brain regions were associ- ated with appetite, the reward system, and emotions [22,23]. In obese individuals with or without T2DM, peripherally admin- istered GLP-1 receptor agonists altered the activation of the
hypothalamus, insula, putamen, and amygdala in response to visual food cues [23-27]. On the other hand, in lean individu- als without T2DM, intravenous exenatide infusion did not af- fect the functional activities of these brain regions [25]. How- ever, it is uncertain whether the functional activation of the brain and its response to GLP-1 receptor agonist are different in lean and obese individuals with T2DM. Therefore, in the present study, we investigated the effects of a GLP-1 receptor agonist on functional brain activation in lean and obese indi- viduals with T2DM in response to visual food cues.
METHODS
Study participants and ethical statement
Fifteen lean (body mass index [BMI] <23 kg/m2) and 15 obese (BMI >26 kg/m2) individuals with T2DM were included in the present study. The BMI categories used were based on obesity- related health risk in the East Asian population [28]. Eligible participants were adults aged 19 to 70 years with an estimated glomerular filtration rate of >30 mL/min/1.73 m2, aspartate aminotransferase and alanine aminotransferase levels of <2.5 times of the upper limit of the normal range, and a glycosylat- ed hemoglobin (HbA1c) of <8.5%. All participants were treat- ed for T2DM through lifestyle modification and/or oral antidi- abetic drugs. We excluded individuals who were diagnosed with type 1 diabetes mellitus, had a history of insulin therapy, and could not perform magnetic resonance imaging (MRI) scan due to the adverse effects of contrast media or claustro- phobia. The present study is registered at ClinicalTrials.gov (ClinicalTrails.gov Identifier: NCT02745470). The study pro- tocol was approved by the Institutional Review Board of Seoul National University Hospital (IRB No. 1507-038-686). All par- ticipants provided written informed consent before participat- ing in any study-related activities.
Study design and procedure
The present study was a randomized, single-blinded, crossover study. The study consisted of two interventions with a 1-week washout period. Ten micrograms of lixisenatide or normal sa- line was administered subcutaneously to the participants at 9:00 AM after an overnight (12 hours) fast. At 30 minutes after the lixisenatide or saline injection, the functional activity of the brain was evaluated in response to visual food cues with fMRI.
Seventy minutes after the fMRI session, the participants were presented with an ad libitum buffet consisting of bread, banan-
as, boiled eggs, and juice for 20 minutes. We calculated their food intake in calories by measuring the amount of food before and after the buffet. Appetite was assessed using visual analog scales for five domains (hunger, satiety, fullness, craving, and nausea) [29] before the lixisenatide or saline injection, after the MRI session, and after the ad libitum buffet as follows: 0 (none), 1 to 3 (mild), 4 to 7 (moderate), 8 to 10 (severe). After 1 week, the participants switched from a lixisenatide to a saline injection or from a saline to a lixisenatide injection, depending upon which they received during the first intervention, and the same protocol was performed. Fig. 1 shows the study design and procedure.
Task fMRI protocol
The participants were asked to look at a screen through a mir- ror on the head coil of the MRI instrument and to focus on the screen contents during the fMRI. There were three types of pictures that showed food with high caloric content, food with low caloric content, and nonfood (Supplementary Fig. 1). The pictures were obtained from a database of food images for the
study of eating and appetite (http://www.eat.sbg.ac.at/) [30].
As shown in Fig. 1, seven consecutive pictures of the same type were presented in a block for 21 seconds followed by 9 seconds of a white ‘+’ sign on a black background (baseline block). A set of each type of picture block and the white ‘+’ sign was in- cluded twice in each run. There were two runs in total, in which the second run used a different order for the picture type blocks to prevent the sequence effect.
Image acquisition and analyses
The T1-weighted (T1) and task fMRI data were acquired using a 3 Tesla scanner with 32 channels that had a coil (MAGNE- TOM TrioTim syngo MR B17; Siemens, Erlangen, Germany).
The T1 images had the following parameters: repetition time 1,670 ms, echo time 1.89 ms, voxel size 1×1×1 mm3, field of view 250 mm, flip angle 9°, and number of slices 208. The task fMRI images were acquired using echo-planar imaging with the following parameters: repetition time 2,000 ms, echo time 30 ms, voxel size 3.4×3.4×3.4 mm3, field of view 220 mm, flip angle 80°, and a generalized autocalibrating partially parallel
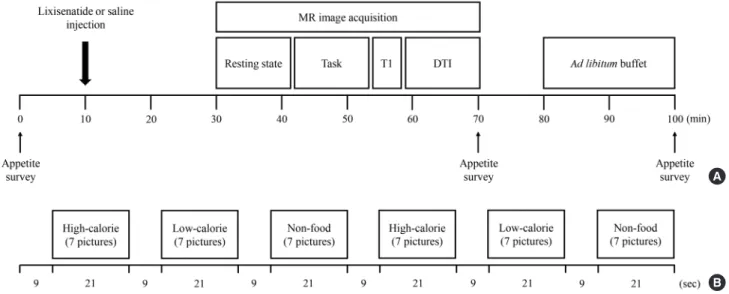
Fig. 1. Study design and procedure. Fifteen lean and 14 obese individuals with type 2 diabetes mellitus were studied in a random- ized, single-blinded, crossover study. (A) The study participants were randomly assigned to either the lixisenatide or saline injec- tion group after an overnight fast. After administration of the injection, the brain responses to visual food cues were evaluated us- ing functional magnetic resonance imaging (fMRI). After the fMRI session, the participants were given access to an ad libitum buffet to measure caloric intake. Appetite surveys were taken before the injection, after the fMRI session, and after the ad libitum buffet. One week apart, the participants were switched to the other condition group and performed the same procedure. (B) fMRI paradigm. One run consisted of six blocks of pictures that included high-calorie food, low-calorie food, and nonfood contents.
Each type of picture was presented in a block with seven other pictures for 21 seconds and were shown twice in each run. The blocks were separated by 9 seconds of a black background with a white fixation cross. Each fMRI session had two runs of blocks with different orders to prevent the sequence effect. MR, magnetic resonance; T1, T1-weighted; DTI, diffusion tensor imaging.
A
B
acquisition factor of 2.
The magnetic resonance images were preprocessed using a standard process in the Statistical Parametric Mapping 12 soft- ware (SPM12; Wellcome Trust Centre for Neuroimaging, Lon- don, UK). First, two time point volumes were removed from each image to reduce magnetic inhomogeneity at the begin- ning of the scans. After correcting for the slice timing differ- ence, the functional images were coregistered to the structural image, which was followed by segmentation and normaliza- tion to the Montreal Neurological Institute standard template.
Finally, the resulting images were smoothed with a Gaussian kernel of full width at a half maximum of 6 mm. Using a gen- eral linear model implemented in SPM12, the β parameter of each type of picture was estimated, which was used to obtain the contrast map between food with high caloric content ver- sus food with low caloric content and food versus nonfood.
Each contrast map was tested for whole brain group differenc- es using factorial analyses implemented in the second level general linear models in SPM12 on the basis of the main fac- tors, including group and treatment, and the interaction be- tween them. In addition, we performed subgroup analyses for individuals whose caloric intake was decreased after lixisena- tide injection. The cluster-level threshold was set to 10 voxels with an uncorrected P<0.001 for multiple comparisons. We presented the distinct brain areas in one data set when they showed simultaneous changes in functional activation in the same contrast map.
Statistical analyses
The sample size was determined to yield a power of 90% at a significance level of 0.01 based on the minimum sample size needed to achieve statistical significance in fMRI neuroimag- ing studies [31]. All data except the images were analyzed by GraphPad Prism 5 (GraphPad Software Inc., San Diego, CA, USA). The baseline characteristics of the participants are pre- sented as the mean±standard deviation for continuous vari- ables and the number or proportion for categorical variables.
In the image analyses, the β parameter for each type of picture is presented as the mean±standard error of the mean in the graphs. Caloric intake was analyzed by repeated measures analysis of variance (ANOVA). The association between the β parameters and the results of the appetite survey was assessed by the Pearson correlation coefficient. P values <0.05 were re- garded as statistically significant.
RESULTS
Characteristics of the study participants
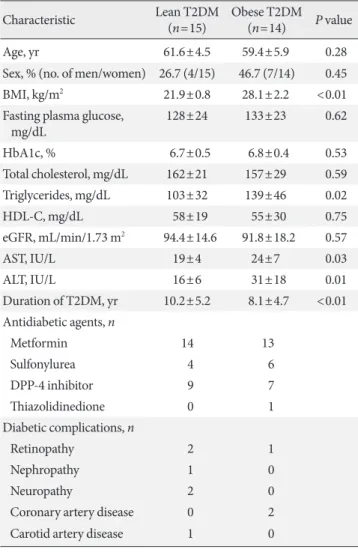
A total of 30 individuals with T2DM were evaluated for the present study, but one individual was excluded because of in- sufficient fMRI data to obtain an image. Ultimately, 29 individ- uals (15 lean and 14 obese individuals) were included in the analysis. In lean individuals, the mean age was 61.6±4.5 years, BMI was 21.9±0.8 kg/m2, and HbA1c level was 6.7%±0.5%. In obese individuals, the mean age was 59.4±5.9 years, BMI was 28.1±2.2 kg/m2, and HbA1c level was 6.8%±0.4%. The base- line characteristics of the participants are described in Table 1.
Table 1. Baseline characteristics of the study participants
Characteristic Lean T2DM
(n=15) Obese T2DM (n=14) P value
Age, yr 61.6±4.5 59.4±5.9 0.28
Sex, % (no. of men/women) 26.7 (4/15) 46.7 (7/14) 0.45
BMI, kg/m2 21.9±0.8 28.1±2.2 <0.01
Fasting plasma glucose,
mg/dL 128±24 133±23 0.62
HbA1c, % 6.7±0.5 6.8±0.4 0.53
Total cholesterol, mg/dL 162±21 157±29 0.59
Triglycerides, mg/dL 103±32 139±46 0.02
HDL-C, mg/dL 58±19 55±30 0.75
eGFR, mL/min/1.73 m2 94.4±14.6 91.8±18.2 0.57
AST, IU/L 19±4 24±7 0.03
ALT, IU/L 16±6 31±18 0.01
Duration of T2DM, yr 10.2±5.2 8.1±4.7 <0.01 Antidiabetic agents, n
Metformin 14 13
Sulfonylurea 4 6
DPP-4 inhibitor 9 7
Thiazolidinedione 0 1
Diabetic complications, n
Retinopathy 2 1
Nephropathy 1 0
Neuropathy 2 0
Coronary artery disease 0 2
Carotid artery disease 1 0
Values are presented as mean±standard deviation.
T2DM, type 2 diabetes mellitus; BMI, body mass index; HbA1c, gly- cosylated hemoglobin; HDL-C, high density lipoprotein cholesterol;
eGFR, estimated glomerular filtration rate; AST, aspartate amino- transferase; ALT, alanine aminotransferase; DPP-4, dipeptidyl pepti- dase-4.
The participants reported no treatment-emergent adverse events except for nausea. The incidence of nausea was 34.5%
and 20.7% for lixisenatide and saline, respectively, and most cases were mild to moderate according to the visual analog scales. Two participants reported severe nausea after lixisena- tide injection but completed the study.
Brain responses to visual food cues
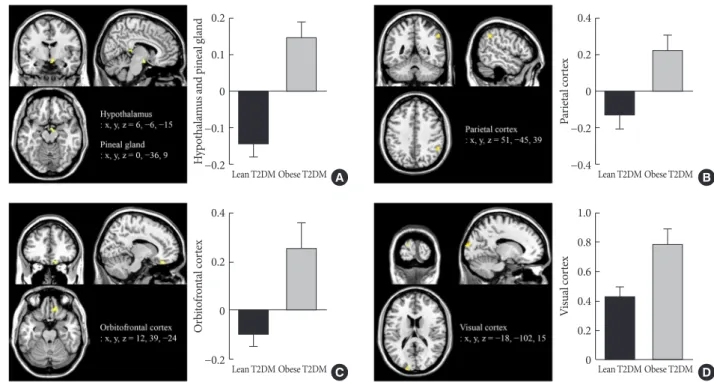
Obese individuals showed significantly greater functional acti- vation of the hypothalamus, pineal gland, and parietal cortex in the high-calorie food versus low-calorie food contrast than lean individuals (P<0.05) (Fig. 2A and B). Obese individuals also showed greater activation of the orbitofrontal cortex in the high- calorie food versus nonfood contrast than lean individuals (P<0.05) (Fig. 2C). In the food versus nonfood contrast, the functional activation of the visual cortex was significantly higher in obese individuals than in lean individuals (P<0.05) (Fig. 2D).
Effects of lixisenatide injection on brain responses to visual food cues
Lixisenatide injection significantly reduced the functional acti- vation of the fusiform gyrus and lateral ventricle in obese indi- viduals compared with lean individuals, only for the nonfood versus high-calorie food contrast (P<0.05) (Fig. 3). The direc- tion of the treatment effect was opposing between the two groups. In the subgroup analysis of individuals whose caloric intake was decreased after lixisenatide injection (n=17), there were significant interaction effects between group and treat- ment in the posterior cingulate and medial frontal cortex for the high-calorie food versus low-calorie food contrast (P<0.05) (Fig. 4A). For the food versus nonfood contrast, significant in- teraction effects were also shown between group and treatment in the hypothalamus, temporal lobe, and orbitofrontal cortex (P<0.05) (Fig. 4B).
Fig. 2. Differences in brain responses to visual food cues in lean and obese individuals with type 2 diabetes mellitus (T2DM). (A) Activation of the hypothalamus and pineal gland in response to viewing high-calorie food pictures (high-calorie food vs. low-cal- orie food). (B) Activation of the parietal cortex in response to viewing low-calorie food pictures (low-calorie food vs. high-calorie food). (C) Activation of the orbitofrontal cortex in response to viewing high-calorie food pictures (high-calorie food vs. non- food). (D) Activation of the visual cortex in response to viewing food pictures (food vs. nonfood). The color bar indicates the T value of the functional activity in each voxel. The blood oxygen level-dependent signal intensity (effect size) is presented as the mean and the standard error of the mean. The cluster level threshold was set to 10 voxels with an uncorrected P<0.001. x, y, and z indicate the x-axis (sagittal plane), y-axis (coronal plane), and z-axis (transverse plane) used in magnetic resonance imaging.
0.2
0.1
0
−0.1
−0.2
0.4
0.2
0
−0.2
0.4
0.2
0
−0.2
−0.4
1.0 0.8 0.6 0.4 0.2 0
Hypothalamus and pineal glandOrbitofrontal cortex Parietal cortexVisual cortex
Lean T2DM
Lean T2DM
Lean T2DM
Lean T2DM Obese T2DM
Obese T2DM
Obese T2DM
Obese T2DM D C
B A
Fig. 3. Alteration in the responses to visual food cues in the brain in lean and obese individuals with type 2 diabetes mellitus (T2DM) after the administration of lixisenatide. The color bar indicates the T value of the functional activity in a voxel. The clus- ter level threshold was set to 10 voxels with an uncorrected P<0.001. x, y, and z indicate the x-axis (sagittal plane), y-axis (coronal plane), and z-axis (transverse plane) used in magnetic resonance imaging.
Fig. 4. Alteration in brain responses to visual food cues in 17 of 29 individuals (eight lean and nine obese individuals) with type 2 diabetes mellitus (T2DM) who had decreased caloric intake after the administration of lixisenatide. (A) Activation of the posteri- or cingulate and medial frontal cortex in response to viewing high-calorie food pictures (high-calorie food vs. low-calorie food).
(B) Activation of the hypothalamus, temporal lobe, and orbitofrontal cortex in response to viewing food pictures (food vs. low- calorie food). The color bar indicates the T value of the functional activity in a voxel. The cluster level threshold was set to 10 vox- els with an uncorrected P<0.001. x, y, and z indicate the x-axis (sagittal plane), y-axis (coronal plane), and z-axis (transverse plane) used in magnetic resonance imaging.
0.4 0.2 0
−0.2
−0.4
0.4 0.2 0
−0.2
−0.4
0.4 0.2 0
−0.2
−0.4
0.4 0.2 0
−0.2
−0.4 Posterior cingulate and medial frontal cortexHypothalamus, temporal lobe, and orbitofrontal cortex
Saline
Saline
Saline
Saline Lean T2DM
Lean T2DM
Obese T2DM
Obese T2DM Lixisenatide
Lixisenatide
Lixisenatide
Lixisenatide A
B 0.4
0.2
0
−0.2
−0.4
0.4
0.2
0
−0.2
Fusiform gyrus and lateral ventricle −0.4
Saline Saline
Lean T2DM Obese T2DM
Lixisenatide Lixisenatide
Changes in caloric intake and appetite
Lixisenatide injection reduced caloric intake in 17 of 29 partic- ipants, including eight lean and nine obese individuals. Chang- es in caloric intake were not significantly different between lean and obese individuals (1±72 kcal vs. −8±62 kcal, P=0.56).
However, in the high-calorie food versus low-calorie food con- trast, the functional activation of the hypothalamus and pineal gland was associated with baseline fullness (r=0.34, P=0.01), post-fMRI satiety (r=0.31, P=0.01), and post-fMRI fullness (r=0.41, P<0.01). Moreover, in the food and nonfood contrast, the functional activation of the visual cortex was inversely cor- related with post-buffet satiety (r=0.40, P<0.01), post-buffet fullness (r=0.38, P<0.01), post-fMRI satiety (r=0.25, P=0.03), and post-fMRI craving (r=0.25, P=0.03). In the subgroup analysis of individuals with decreased caloric intake after lix- isenatide injection, the functional activation of the posterior cingulate and medial frontal cortex was associated with base- line craving (r=0.38, P=0.02) and post-fMRI hunger (r=0.31, P=0.04) in the high-calorie food versus low-calorie food con- trast (Supplementary Fig. 2). The results of the appetite assess- ment are detailed in Supplementary Table 1.
DISCUSSION
We found that brain responses to visual food cues were differ- ent in lean and obese individuals with T2DM. The functional activation of certain brain regions was associated with appetite.
We also found that lixisenatide injection differentially affected the functional activation of the fusiform gyrus and lateral ven- tricle in lean and obese individuals with T2DM. The changes in caloric intake were not significantly different between the two groups. However, in individuals with decreased caloric in- take after lixisenatide injection, there were significant interac- tion effects between group and treatment in brain regions that are known to be involved in appetite and the reward system.
In response to visual food cues, lean and obese individuals who did not receive a lixisenatide injection showed differential functional activation of the hypothalamus, pineal gland, pari- etal cortex, orbitofrontal cortex, and visual cortex. These brain regions are included in central nervous system (CNS) circuits that regulate appetite, feeding behavior, and body weight [32,33]. The hypothalamus is crucial to nutrient sensing and signaling [34], and its dysfunction contributes to impaired en- ergy homeostasis [35]. Previously, differences in hypothalamic activity were reported between lean and obese individuals
without T2DM [25]. In our study, we found that these differ- ences were also present in those with T2DM. However, little is known about the functional activation of the pineal gland in obesity. In a small study using MRI, pineal gland volume was found to be smaller in obese individuals than in lean individu- als [36]. Given that melatonin deficiency is associated with cir- cadian disruption and metabolic disorders [37], it may be plausible that pineal gland activity is different in lean and obese individuals. The parietal cortex integrates sensory, cognitive, and motor functions during a variety of tasks [38]. In fMRI studies, the activation of the parietal cortex was decreased in response to images of highly desirable food [26] and inversely correlated with weight loss [39]. The expression of GLP-1 re- ceptors observed in the human parietal cortex [26] and the si- multaneous alteration of the functional activation of the pari- etal cortex and hypothalamus in our study suggest that lix- isenatide could have direct and indirect effects on this region.
The orbital cortex is involved in food rewards [40,41] and un- derlies the valuation of food by incorporating information about nutritional constituents [42]. For this reason, the func- tional activation of the orbitofrontal cortex might be associated with a change in food preference after GLP-1 receptor agonist treatment [43]. In addition, adaptation in the visual cortex was attenuated in individuals prone to weight gain compared with those resistant to weight gain [44], and obese individuals showed enhanced attention to visual food cues [45,46]. In our study, the functional activation of the hypothalamus, pineal gland, and visual cortex were associated with satiety, fullness, and craving, but they were not associated with changes in ca- loric intake. Overall, CNS responses to visual food cues were different in lean and obese individuals with T2DM, and this affected the control of appetite in these individuals.
Lixisenatide injection altered the functional activation of the fusiform gyrus in response to visual food cues differentially in lean and obese individuals with T2DM. The fusiform gyrus is an important region involved in high-level object recognition [47,48] and is related to the neural processing of visual food cues [49]. Recently, researchers demonstrated that the func- tional connectivity of the fusiform gyrus and prefrontal cortex was involved in the estimation of food energy density and as- sociated with central reward circuits in humans [50]. In line with these findings, functional changes in the fusiform gyrus were observed only in contrasts with high-calorie food in our study. Notably, the fusiform gyrus has not been found to ex- press GLP-1 receptor [51,52]. However, the activity of the fusi-
form gyrus was inversely correlated with plasma insulin levels [53] and reduced after intranasal insulin administration [54]
in healthy normal-weight individuals. Obese individuals were found to have a low cerebrospinal fluid (CSF) to plasma insulin ratio despite hyperinsulinemia due to insulin resistance [55].
These findings suggest that decreased insulin levels in the brain might be related to different responses to visual food cues and lixisenatide injection in the fusiform gyrus in lean and obese individuals, but this needs to be confirmed.
Along with functional changes in the fusiform gyrus, lix- isenatide injection also differentially altered the functional ac- tivation in the lateral ventricle, which appeared to occur in the region of the choroid plexus [56] in lean and obese individuals with T2DM. In adult mice, the choroid plexus supports the re- cruitment and proliferation of neural stem cells [57] and ex- presses receptors for several hormones, including GLP-1 [58]
and leptin [59]. The GLP-1 receptors in the choroid plexus are involved in the modulation of CSF [58], but their metabolic role is unknown. The choroid plexus also plays a role as a bar- rier or transporter in the brain along with the blood-brain bar- rier. GLP-1 reached pharmacologically active concentrations in the CSF after intracerebroventricular injection but not after subdural or intraparenchymal injection [60]. In addition, plas- ma liraglutide concentrations were not associated with CSF li- raglutide concentrations in individuals with T2DM [61]. Inter- estingly, megalin, which is a promiscuous receptor expressed in the choroid plexus, mediated the transport of leptin across the blood-CSF barrier [62]. Similar to megalin, the GLP-1 re- ceptor in the choroid plexus might be involved in the transport of GLP-1 or GLP-1 receptor agonists to the brain, and this needs to be evaluated in additional studies. Further investiga- tion is required to determine the role of GLP-1 receptor that is expressed in the choroid plexus.
Finally, there were significant interaction effects between obesity and lixisenatide injection in the posterior cingulate, medial frontal cortex, hypothalamus, orbitofrontal cortex, and temporal lobe in individuals whose caloric intake was de- creased. These brain regions are involved in appetite control and central reward circuits [33]. In our study, the functional activation of the posterior cingulate and medial frontal cortex was associated with craving and hunger. Glycemic and weight responses to GLP-1 receptor agonists vary in individuals with T2DM or obesity [63-65]. The interaction effects found in our study may explain the differences in the treatment responses to GLP-1 receptor agonists in these individuals.
Previous studies showed that both short-acting [23,25] and long-acting GLP-1 receptor agonists [26,27] affected CNS acti- vation that was involved in the regulation of appetite and the food reward system. Accordingly, GLP-1 receptor agonists may have similar effects on brain activity. However, short-act- ing and long-acting GLP-1 receptor agonists vary in their pharmacokinetics and pharmacodynamics and have different effects on postprandial insulin secretion and gastric emptying time, which might influence the neural control of appetite and feeding behavior [66]. Therefore, further investigation is need- ed to elucidate the effects of different GLP-1 receptor agonists on brain activity in terms of dose, treatment duration, and dif- ferent study populations.
The present study has some limitations. First, we evaluated the effects of acute administration of lixisenatide injection on functional brain activation. The long-term effects should be examined in lean and obese individuals with T2DM. Second, we did not assess the dose-response relationship between lix- isenatide and functional activities in the brain. Third, we did not evaluate differences in brain responses in consideration of the presence of oral antidiabetic drugs. Finally, we did not evaluate explanatory variables in more detail because the pow- er and sample size calculations were performed for the prima- ry endpoint.
In conclusion, our study showed that brain responses to vi- sual food cues were different in lean and obese individuals with T2DM, and acute administration of lixisenatide differen- tially affected the functional activation of the brain in these in- dividuals, especially those with decreased caloric intake after treatment.
SUPPLEMENTARY MATERIALS
Supplementary materials related to this article can be found online at https://doi.org/10.4093/dmj.2019.0018.
CONFLICTS OF INTEREST
No potential conflict of interest relevant to this article was re- ported.
AUTHOR CONTRIBUTIONS
Conception or design: J.H.B., H.J.C., Y.M.C.
Acquisition, analysis, or interpretation of data: J.H.B., H.J.C.,
K.I.K.C., L.K.K., Y.M.C.
Drafting the work or revising: J.H.B., H.J.C., K.I.K.C., Y.M.C.
Final approval of the manuscript: J.H.B., H.J.C., K.I.K.C., L.K.K., J.S.K., Y.M.C.
ORCID
Jae Hyun Bae https://orcid.org/0000-0002-1384-6123 Hyung Jin Choi https://orcid.org/0000-0003-0593-6978 Young Min Cho https://orcid.org/0000-0002-2331-6126
ACKNOWLEDGMENTS
This study was supported by grants from the Korean Diabetes Association (Young Min Cho, 2016S-1) and the Cooperative Research Program of Basic Medical Science and Clinical Sci- ence at the Seoul National University College of Medicine (800- 20150083).
REFERENCES
1. Prospective Studies Collaboration, Whitlock G, Lewington S, Sherliker P, Clarke R, Emberson J, Halsey J, Qizilbash N, Col- lins R, Peto R. Body-mass index and cause-specific mortality in 900 000 adults: collaborative analyses of 57 prospective studies.
Lancet 2009;373:1083-96.
2. Singh GM, Danaei G, Farzadfar F, Stevens GA, Woodward M, Wormser D, Kaptoge S, Whitlock G, Qiao Q, Lewington S, Di Angelantonio E, Vander Hoorn S, Lawes CM, Ali MK, Mozaf- farian D, Ezzati M; Global Burden of Metabolic Risk Factors of Chronic Diseases Collaborating Group; Asia-Pacific Cohort Studies Collaboration (APCSC); Diabetes Epidemiology: Col- laborative analysis of Diagnostic criteria in Europe (DE- CODE); Emerging Risk Factor Collaboration (ERFC); Pro- spective Studies Collaboration (PSC). The age-specific quanti- tative effects of metabolic risk factors on cardiovascular diseas- es and diabetes: a pooled analysis. PLoS One 2013;8:e65174.
3. NCD Risk Factor Collaboration (NCD-RisC). Worldwide trends in body-mass index, underweight, overweight, and obe- sity from 1975 to 2016: a pooled analysis of 2416 population- based measurement studies in 128.9 million children, adoles- cents, and adults. Lancet 2017;390:2627-42.
4. Schwartz MW, Seeley RJ, Zeltser LM, Drewnowski A, Ravussin E, Redman LM, Leibel RL. Obesity pathogenesis: an endocrine society scientific statement. Endocr Rev 2017;38:267-96.
5. Waterson MJ, Horvath TL. Neuronal regulation of energy ho- meostasis: beyond the hypothalamus and feeding. Cell Metab 2015;22:962-70.
6. Gautron L, Elmquist JK, Williams KW. Neural control of ener- gy balance: translating circuits to therapies. Cell 2015;161:133- 45.
7. Spiegelman BM, Flier JS. Obesity and the regulation of energy balance. Cell 2001;104:531-43.
8. Cho YM, Fujita Y, Kieffer TJ. Glucagon-like peptide-1: glucose homeostasis and beyond. Annu Rev Physiol 2014;76:535-59.
9. Davies MJ, D’Alessio DA, Fradkin J, Kernan WN, Mathieu C, Mingrone G, Rossing P, Tsapas A, Wexler DJ, Buse JB. Manage- ment of hyperglycemia in type 2 diabetes, 2018. A consensus report by the American Diabetes Association (ADA) and the European Association for the Study of Diabetes (EASD). Dia- betes Care 2018;41:2669-701.
10. Ko SH, Hur KY, Rhee SY, Kim NH, Moon MK, Park SO, Lee BW, Kim HJ, Choi KM, Kim JH; Committee of Clinical Prac- tice Guideline of Korean Diabetes Association. Antihypergly- cemic agent therapy for adult patients with type 2 diabetes mellitus 2017: a position statement of the Korean Diabetes As- sociation. Diabetes Metab J 2017;41:337-48.
11. Pi-Sunyer X, Astrup A, Fujioka K, Greenway F, Halpern A, Krempf M, Lau DC, le Roux CW, Violante Ortiz R, Jensen CB, Wilding JP; SCALE Obesity and Prediabetes NN8022-1839 Study Group. A randomized, controlled trial of 3.0 mg of lira- glutide in weight management. N Engl J Med 2015;373:11-22.
12. U.S. Food and Drug Administration: Highlights of prescribing information. SAXENDA (liraglutide [rDNA origin] injection), solution for subcutaneous use. Available from: https://www.ac- cessdata.fda.gov/drugsatfda_docs/label/2014/206321Orig1s000lbl.
pdf (cited 2019 Sep 26).
13. O’Neil PM, Birkenfeld AL, McGowan B, Mosenzon O, Peders- en SD, Wharton S, Carson CG, Jepsen CH, Kabisch M, Wild- ing JPH. Efficacy and safety of semaglutide compared with li- raglutide and placebo for weight loss in patients with obesity: a randomised, double-blind, placebo and active controlled, dose-ranging, phase 2 trial. Lancet 2018;392:637-49.
14. Lockie SH, Heppner KM, Chaudhary N, Chabenne JR, Mor- gan DA, Veyrat-Durebex C, Ananthakrishnan G, Rohner- Jeanrenaud F, Drucker DJ, DiMarchi R, Rahmouni K, Oldfield BJ, Tschop MH, Perez-Tilve D. Direct control of brown adipose tissue thermogenesis by central nervous system glucagon-like peptide-1 receptor signaling. Diabetes 2012;61:2753-62.
15. Xu F, Lin B, Zheng X, Chen Z, Cao H, Xu H, Liang H, Weng J.
GLP-1 receptor agonist promotes brown remodelling in mouse white adipose tissue through SIRT1. Diabetologia 2016;59:1059- 69.
16. Beiroa D, Imbernon M, Gallego R, Senra A, Herranz D, Villar- roya F, Serrano M, Ferno J, Salvador J, Escalada J, Dieguez C, Lopez M, Frühbeck G, Nogueiras R. GLP-1 agonism stimulates brown adipose tissue thermogenesis and browning through hypothalamic AMPK. Diabetes 2014;63:3346-58.
17. van Can J, Sloth B, Jensen CB, Flint A, Blaak EE, Saris WH. Ef- fects of the once-daily GLP-1 analog liraglutide on gastric emp- tying, glycemic parameters, appetite and energy metabolism in obese, non-diabetic adults. Int J Obes (Lond) 2014;38:784-93.
18. Secher A, Jelsing J, Baquero AF, Hecksher-Sorensen J, Cowley MA, Dalboge LS, Hansen G, Grove KL, Pyke C, Raun K, Schaf- fer L, Tang-Christensen M, Verma S, Witgen BM, Vrang N, Bjerre Knudsen L. The arcuate nucleus mediates GLP-1 recep- tor agonist liraglutide-dependent weight loss. J Clin Invest 2014;124:4473-88.
19. Alhadeff AL, Rupprecht LE, Hayes MR. GLP-1 neurons in the nucleus of the solitary tract project directly to the ventral teg- mental area and nucleus accumbens to control for food intake.
Endocrinology 2012;153:647-58.
20. Richard JE, Farkas I, Anesten F, Anderberg RH, Dickson SL, Gribble FM, Reimann F, Jansson JO, Liposits Z, Skibicka KP.
GLP-1 receptor stimulation of the lateral parabrachial nucleus reduces food intake: neuroanatomical, electrophysiological, and behavioral evidence. Endocrinology 2014;155:4356-67.
21. Krieger JP, Arnold M, Pettersen KG, Lossel P, Langhans W, Lee SJ. Knockdown of GLP-1 receptors in vagal afferents affects normal food intake and glycemia. Diabetes 2016;65:34-43.
22. Jastreboff AM, Lacadie C, Seo D, Kubat J, Van Name MA, Gi- annini C, Savoye M, Constable RT, Sherwin RS, Caprio S, Sinha R. Leptin is associated with exaggerated brain reward and emotion responses to food images in adolescent obesity.
Diabetes Care 2014;37:3061-8.
23. van Bloemendaal L, IJzerman RG, Ten Kulve JS, Barkhof F, Konrad RJ, Drent ML, Veltman DJ, Diamant M. GLP-1 recep- tor activation modulates appetite- and reward-related brain ar- eas in humans. Diabetes 2014;63:4186-96.
24. Schlogl H, Kabisch S, Horstmann A, Lohmann G, Muller K, Lepsien J, Busse-Voigt F, Kratzsch J, Pleger B, Villringer A, Stumvoll M. Exenatide-induced reduction in energy intake is associated with increase in hypothalamic connectivity. Diabe- tes Care 2013;36:1933-40.
25. Eldor R, Daniele G, Huerta C, Al-Atrash M, Adams J, DeFron-
zo R, Duong T, Lancaster J, Zirie M, Jayyousi A, Abdul-Ghani M. Discordance between central (brain) and pancreatic action of exenatide in lean and obese subjects. Diabetes Care 2016;39:
1804-10.
26. Farr OM, Sofopoulos M, Tsoukas MA, Dincer F, Thakkar B, Sahin-Efe A, Filippaios A, Bowers J, Srnka A, Gavrieli A, Ko BJ, Liakou C, Kanyuch N, Tseleni-Balafouta S, Mantzoros CS.
GLP-1 receptors exist in the parietal cortex, hypothalamus and medulla of human brains and the GLP-1 analogue liraglutide alters brain activity related to highly desirable food cues in in- dividuals with diabetes: a crossover, randomised, placebo-con- trolled trial. Diabetologia 2016;59:954-65.
27. Ten Kulve JS, Veltman DJ, van Bloemendaal L, Barkhof F, Drent ML, Diamant M, IJzerman RG. Liraglutide reduces CNS activa- tion in response to visual food cues only after short-term treat- ment in patients with type 2 diabetes. Diabetes Care 2016;39:
214-21.
28. WHO Expert Consultation. Appropriate body-mass index for Asian populations and its implications for policy and interven- tion strategies. Lancet 2004;363:157-63.
29. Flint A, Raben A, Blundell JE, Astrup A. Reproducibility, power and validity of visual analogue scales in assessment of appetite sensations in single test meal studies. Int J Obes Relat Metab Disord 2000;24:38-48.
30. Blechert J, Meule A, Busch NA, Ohla K. Food-pics: an image database for experimental research on eating and appetite.
Front Psychol 2014;5:617.
31. Desmond JE, Glover GH. Estimating sample size in functional MRI (fMRI) neuroimaging studies: statistical power analyses. J Neurosci Methods 2002;118:115-28.
32. Morton GJ, Cummings DE, Baskin DG, Barsh GS, Schwartz MW. Central nervous system control of food intake and body weight. Nature 2006;443:289-95.
33. Sweeney P, Yang Y. Neural circuit mechanisms underlying emotional regulation of homeostatic feeding. Trends Endocri- nol Metab 2017;28:437-48.
34. Stefater MA, Seeley RJ. Central nervous system nutrient signal- ing: the regulation of energy balance and the future of dietary therapies. Annu Rev Nutr 2010;30:219-35.
35. Thaler JP, Guyenet SJ, Dorfman MD, Wisse BE, Schwartz MW.
Hypothalamic inflammation: marker or mechanism of obesity pathogenesis? Diabetes 2013;62:2629-34.
36. Grosshans M, Vollmert C, Vollstaedt-Klein S, Nolte I, Schwarz E, Wagner X, Leweke M, Mutschler J, Kiefer F, Bumb JM. The association of pineal gland volume and body mass in obese and
normal weight individuals: a pilot study. Psychiatr Danub 2016;28:220-4.
37. Gamble KL, Berry R, Frank SJ, Young ME. Circadian clock control of endocrine factors. Nat Rev Endocrinol 2014;10:466- 75.
38. Freedman DJ, Ibos G. An integrative framework for sensory, motor, and cognitive functions of the posterior parietal cortex.
Neuron 2018;97:1219-34.
39. Murdaugh DL, Cox JE, Cook EW 3rd, Weller RE. fMRI reactiv- ity to high-calorie food pictures predicts short- and long-term outcome in a weight-loss program. Neuroimage 2012;59:2709- 21.
40. Grabenhorst F, Rolls ET. Value, pleasure and choice in the ven- tral prefrontal cortex. Trends Cogn Sci 2011;15:56-67.
41. Levy DJ, Glimcher PW. Comparing apples and oranges: using reward-specific and reward-general subjective value represen- tation in the brain. J Neurosci 2011;31:14693-707.
42. Suzuki S, Cross L, O’Doherty JP. Elucidating the underlying components of food valuation in the human orbitofrontal cor- tex. Nat Neurosci 2017;20:1780-6.
43. Raun K, von Voss P, Gotfredsen CF, Golozoubova V, Rolin B, Knudsen LB. Liraglutide, a long-acting glucagon-like peptide-1 analog, reduces body weight and food intake in obese candy- fed rats, whereas a dipeptidyl peptidase-IV inhibitor, vilda- gliptin, does not. Diabetes 2007;56:8-15.
44. Cornier MA, Salzberg AK, Endly DC, Bessesen DH, Rojas DC, Tregellas JR. The effects of overfeeding on the neuronal re- sponse to visual food cues in thin and reduced-obese individu- als. PLoS One 2009;4:e6310.
45. Castellanos EH, Charboneau E, Dietrich MS, Park S, Bradley BP, Mogg K, Cowan RL. Obese adults have visual attention bias for food cue images: evidence for altered reward system func- tion. Int J Obes (Lond) 2009;33:1063-73.
46. Nijs IM, Muris P, Euser AS, Franken IH. Differences in atten- tion to food and food intake between overweight/obese and normal-weight females under conditions of hunger and satiety.
Appetite 2010;54:243-54.
47. Kanwisher N, McDermott J, Chun MM. The fusiform face area: a module in human extrastriate cortex specialized for face perception. J Neurosci 1997;17:4302-11.
48. Grill-Spector K, Kourtzi Z, Kanwisher N. The lateral occipital complex and its role in object recognition. Vision Res 2001;41:
1409-22.
49. van der Laan LN, de Ridder DT, Viergever MA, Smeets PA. The first taste is always with the eyes: a meta-analysis on the neural
correlates of processing visual food cues. Neuroimage 2011;55:
296-303.
50. DiFeliceantonio AG, Coppin G, Rigoux L, Edwin Thanarajah S, Dagher A, Tittgemeyer M, Small DM. Supra-additive effects of combining fat and carbohydrate on food reward. Cell Metab 2018;28:33-44.
51. Richards P, Parker HE, Adriaenssens AE, Hodgson JM, Cork SC, Trapp S, Gribble FM, Reimann F. Identification and char- acterization of GLP-1 receptor-expressing cells using a new transgenic mouse model. Diabetes 2014;63:1224-33.
52. Cork SC, Richards JE, Holt MK, Gribble FM, Reimann F, Trapp S. Distribution and characterisation of glucagon-like peptide-1 receptor expressing cells in the mouse brain. Mol Metab 2015;
4:718-31.
53. Kroemer NB, Krebs L, Kobiella A, Grimm O, Vollstadt-Klein S, Wolfensteller U, Kling R, Bidlingmaier M, Zimmermann US, Smolka MN. (Still) longing for food: insulin reactivity modu- lates response to food pictures. Hum Brain Mapp 2013;34:2367- 80.
54. Guthoff M, Grichisch Y, Canova C, Tschritter O, Veit R, Hallschmid M, Haring HU, Preissl H, Hennige AM, Fritsche A.
Insulin modulates food-related activity in the central nervous system. J Clin Endocrinol Metab 2010;95:748-55.
55. Kern W, Benedict C, Schultes B, Plohr F, Moser A, Born J, Fehm HL, Hallschmid M. Low cerebrospinal fluid insulin levels in obese humans. Diabetologia 2006;49:2790-2.
56. Johnson KA, Becker JA. The whole brain atlas. Philadelphia:
Lippincott Williams & Wilkins; 1999.
57. Silva-Vargas V, Maldonado-Soto AR, Mizrak D, Codega P, Doetsch F. Age-dependent niche signals from the choroid plexus regulate adult neural stem cells. Cell Stem Cell 2016;19:
643-52.
58. Botfield HF, Uldall MS, Westgate CSJ, Mitchell JL, Hagen SM, Gonzalez AM, Hodson DJ, Jensen RH, Sinclair AJ. A glucagon- like peptide-1 receptor agonist reduces intracranial pressure in a rat model of hydrocephalus. Sci Transl Med 2017;9:eaan0972.
59. Zlokovic BV, Jovanovic S, Miao W, Samara S, Verma S, Farrell CL. Differential regulation of leptin transport by the choroid plexus and blood-brain barrier and high affinity transport sys- tems for entry into hypothalamus and across the blood-cere- brospinal fluid barrier. Endocrinology 2000;141:1434-41.
60. Glage S, Klinge PM, Miller MC, Wallrapp C, Geigle P, Hedrich HJ, Brinker T. Therapeutic concentrations of glucagon-like pep- tide-1 in cerebrospinal fluid following cell-based delivery into the cerebral ventricles of cats. Fluids Barriers CNS 2011;8:18.
61. Christensen M, Sparre-Ulrich AH, Hartmann B, Grevstad U, Rosenkilde MM, Holst JJ, Vilsboll T, Knop FK. Transfer of lira- glutide from blood to cerebrospinal fluid is minimal in patients with type 2 diabetes. Int J Obes (Lond) 2015;39:1651-4.
62. Dietrich MO, Spuch C, Antequera D, Rodal I, de Yebenes JG, Molina JA, Bermejo F, Carro E. Megalin mediates the transport of leptin across the blood-CSF barrier. Neurobiol Aging 2008;
29:902-12.
63. Imai K, Tsujimoto T, Goto A, Goto M, Kishimoto M, Yamamo- to-Honda R, Noto H, Kajio H, Noda M. Prediction of response to GLP-1 receptor agonist therapy in Japanese patients with
type 2 diabetes. Diabetol Metab Syndr 2014;6:110.
64. Monami M, Dicembrini I, Nreu B, Andreozzi F, Sesti G, Man- nucci E. Predictors of response to glucagon-like peptide-1 re- ceptor agonists: a meta-analysis and systematic review of ran- domized controlled trials. Acta Diabetol 2017;54:1101-14.
65. Vilsboll T, Christensen M, Junker AE, Knop FK, Gluud LL. Ef- fects of glucagon-like peptide-1 receptor agonists on weight loss: systematic review and meta-analyses of randomised con- trolled trials. BMJ 2012;344:d7771.
66. Meier JJ. GLP-1 receptor agonists for individualized treatment of type 2 diabetes mellitus. Nat Rev Endocrinol 2012;8:728-42.