D I A B E T E S & M E T A B O L I S M J O U R N A L
This is an Open Access article distributed under the terms of the Creative Commons Attribution Non-Commercial License (http://creativecommons.org/licenses/by-nc/4.0/) which permits unrestricted non-commercial use, distribution, and reproduction in any medium, provided the original work is properly cited.
Features of Long-Standing Korean Type 2 Diabetes Mellitus Patients with Diabetic Retinopathy: A Study Based on Standardized Clinical Data
Sejeong Park1,*, Sang Youl Rhee1,*, Su Jin Jeong2, Kiyoung Kim3, Suk Chon1, Seung-Young Yu3, Jeong-Taek Woo1
1Department of Endocrinology and Metabolism, Kyung Hee University School of Medicine, Seoul,
2Statistics Support Department, Medical Science Research Institute, Kyung Hee University Medical Center, Kyung Hee University School of Medicine, Seoul,
3Department of Ophthalmology, Kyung Hee University School of Medicine, Seoul, Korea
Background: This is part of a prospective study carried out as a national project to secure standardized public resources for type 2 diabetes mellitus (T2DM) patients in Korea. We compared various characteristics of long-standing T2DM patients with diabetic retinopathy (DR) and macular edema (ME).
Methods: From September 2014 to July 2015, T2DM patients with disease duration of at least 15 years were recruited at a single university hospital. Clinical data and samples were collected according to the common data elements and standards of procedure developed by the Korean Diabetes Association Research Council. Each participant was assessed by ophthalmologists for DR and ME.Results: Among 220 registered patients, 183 completed the ophthalmologic assessment. DR was associated with longer disease duration (odds ratio [OR], 1.071; 95% confidence interval [CI], 1.001 to 1.147 for non-proliferative diabetic retinopathy [NPDR]) (OR, 1.142; 95% CI, 1.051 to 1.242 for proliferative diabetic retinopathy [PDR]) and the use of long-acting insulin (OR, 4.559;
95% CI, 1.672 to 12.427 for NPDR) (OR, 4.783; 95% CI, 1.581 to 14.474 for PDR), but a lower prevalence of a family history of cancer (OR, 0.310; 95% CI, 0.119 to 0.809 for NPDR) (OR, 0.206; 95% CI, 0.063 to 0.673 for PDR). ME was associated with higher glycosylated hemoglobin levels (OR, 1.380; 95% CI, 1.032 to 1.845) and the use of rapid-acting insulin (OR, 5.211; 95% CI, 1.445 to 18.794).
Conclusion: Various clinical features were associated with DR and ME. Additional epidemiological and biorepository-based studies using this cohort are being conducted to deepen our understanding of diabetic complications in Korea.
Keywords: Diabetes complications; Diabetes mellitus, type 2; Diabetic retinopathy; Macular edema
Corresponding author: Jeong-Taek Woo https://orcid.org/0000-0001-9201-0713 Department of Endocrinology and Metabolism, Kyung Hee University School of Medicine, 23 Kyungheedae-ro, Dongdaemun-gu, Seoul 02447, Korea E-mail: [email protected]
INTRODUCTION
Diabetes mellitus is a leading cause of mortality, with an esti- mated 1.3 million diabetes-related deaths worldwide in 2010, which is twice as many as occurred in 1990 [1]. Diabetes and diabetes-related chronic complications, such as retinopathy, neuropathy, nephropathy, cardiovascular, and cerebrovascular diseases, peripheral artery occlusive diseases, and amputations,
also significantly increase medical costs [2-4]. While the prev- alence of diabetes is increasing in Korea, proper glycemic con- trol has not been achieved in Korean type 2 diabetes mellitus (T2DM) patients [5,6]. The risk of diabetic complications is strongly associated with hyperglycemia, whereas proper glyce- mic control is likely to reduce complications [2,7].
Recently, research based on -omics data has been on the rise following the rapid development of large-scale genome analy- https://doi.org/10.4093/dmj.2017.41.5.393
pISSN 2233-6079 · eISSN 2233-6087
sis techniques. Such studies may be particularly valuable in T2DM, which is a complex and multifactorial disease with variable clinical features and courses [8]. Success in metabolo- mics studies relies on proper sample preparation, innovative instrumentation, and bioinformatics tools [9]. The unmet need for a long-term prospective study based on -omics data might be partly due to the difficulty of collecting standardized clinical and biological data [10].
In this context, the establishment of a structurally designed large-scale registry with standardized data collection methods is needed to draw clinically significant conclusions. This study is part of a national project to provide standardized clinical data and biospecimens for future long-term prospective stud- ies. It is a fundamental study aimed at identifying the proper- ties of diabetic retinopathy (DR) and macular edema (ME) in Korean T2DM patients. Our main goal was to compare the characteristics of long-standing T2DM patients with their DR and/or ME status. DR and ME were used as criteria because they are the most specific complications of T2DM [11].
METHODS
Subjects and study design
This cross-sectional study was carried out as part of a prospec- tive study at Kyung Hee University Hospital in Korea. From September 2014 to July 2015, T2DM patients with disease du- ration of longer than 15 years were recruited. Clinical data, along with blood and urine samples, were collected from each participant after obtaining informed consent. The statuses of DR and ME were assessed in each participant through oph- thalmological exams.
Common data elements and standard operating procedure To secure standardized clinical and biochemical data and to establish a practical action plan, common data elements (CDEs) and standard operating procedures (SOPs) were estab- lished. CDEs were initially selected from the case report form (CRF) of a previous Korea National Diabetes Program (KNDP) cohort study [2]. Then the initial draft of the CRF was estab- lished by referring to the critical items recommended by the Korean Diabetes Association (KDA) and the American Diabe- tes Association clinical guidelines [12,13]. The SOP was estab- lished referring to methods from Korean National Biobank guidelines [14].
The final forms of the CRF and SOP were announced and
confirmed at the opening symposium of the KDA clinical standardization group in January 2015. It was then approved by the board of directors of the KDA in July 2015 Participant clinical data were managed electronically through the iCReaT (Internet based Clinical Research and Trial management) Sys- tem (Korea Centers for Disease Control and Prevention, Cheongju, Korea), which was developed by the Korea National Research Institute of Health for multicenter registration and long-term follow-up.
Outcome definition
The DR status of each participant was assessed through color fundus photographs (FF 450 Plus; Carl Zeiss Meditec, Jena, Germany). According to Early Treatment Diabetic Retinopa- thy Study (ETDRS) criteria, DR was graded into three catego- ries: no DR, non-proliferative diabetic retinopathy (NPDR), or proliferative diabetic retinopathy (PDR) [15,16]. If the eyes of a single patient were rated at different stages, the grade of the worse eye was used. The presence of DME was confirmed us- ing thickness measurements as assessed by Cirrus High-Defi- nition Optical Coherence Tomography (HD-OCT; Carl Zeiss Meditec, Dublin, CA, USA). Two or more ophthalmologists classified the DR and ME statuses based on the exam results.
In cases of discordance between the evaluators, they reviewed the images again and agreed on the final interpretation.
Trained interviewers assessed the presence of underlying co- morbidities by surveying the participants and checking the medical records for the use of relevant medications. The status of physical activities and other socioeconomic statuses were also assessed through interviews. Obesity was defined as a body mass index at or above 25 kg/m2. Dyslipidemia was de- fined as raised triglyceride (≥150 mg/dL) and/or low high den- sity lipoprotein cholesterol (<40 mg/dL in men and <50 mg/dL in women) or on a specific treatment, according to the Third Report of the National Cholesterol Education Program Expert Panel on Detection, Evaluation, and Treatment of High Blood Cholesterol in Adults [17].
Ethics statement
This study was approved by the Institutional Review Board of Kyung Hee University Hospital (IRB No. KMC IRB 1428-04).
Written informed consent was obtained from all participants.
Data from this study were registered at the Clinical Research Information Service (CRIS, No. KCT0001269). CRIS is a Ko- rean National Service connected to the International Clinical
Trials Registry Platform of the World Health Organization.
Statistical analyses
Means, proportions, and distributions of characteristics were compared between patients with or without DR and ME. Chi- square tests were used to measure the significance of associa- tions for categorical variables, and Student t-tests for continu- ous variables. Multiple logistic regression analysis was per- formed to assess the independent contribution of variables to DR and/or ME. Variables that were significant in univariate analyses were included as covariates in the model. Statistical analyses were conducted independently by a specialized statis- tician at the Statistics Support Department of Kyung Hee Uni- versity Medical Center Medical Science Research Institute.
SAS software version 9.3 (SAS Institute Inc., Cary, NC, USA) was used to perform all statistical tests.
RESULTS
Study progression
Among 220 patients recruited, clinical data and samples were collected from 198 patients who consented to the study. A total of 183 ophthalmologic exams were completed (Fig. 1). The mean age of the participants was 66.8 years, the median duration of DM was 22.6 years, and 49.7% of the participants were male.
Comparison of characteristics with DR status
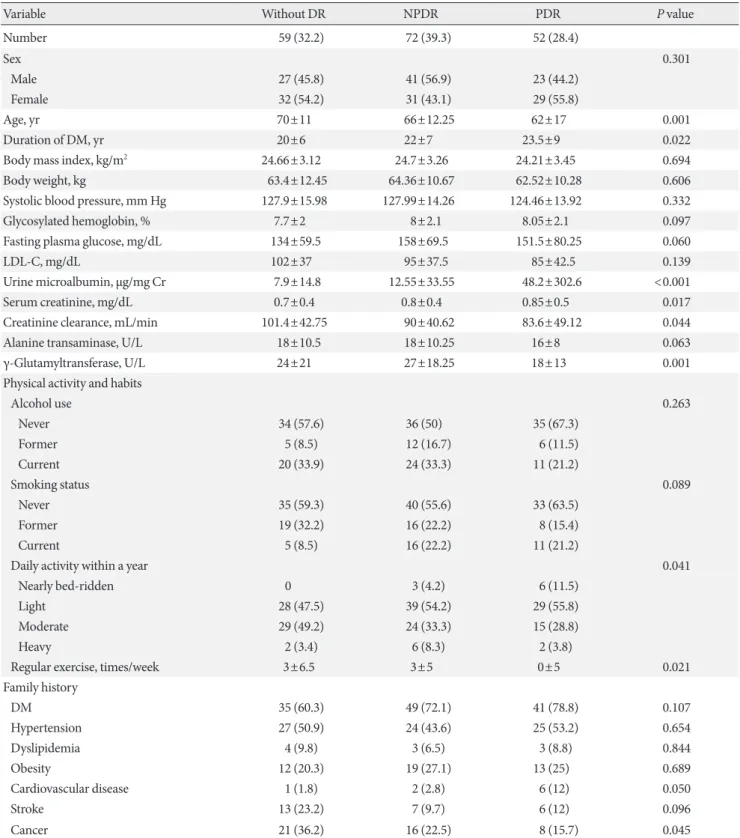
Tables 1 and 2 show selected characteristics compared to the grade of DR. Among a total of 183 participants who under- went ophthalmological assessment, 124 (67.76%) were diag-
nosed with DR. A total of 72 patients (39.3%) had NPDR and 52 (28.4%) had PDR. Statistically significant differences were found for several factors.
More severe DR was associated with a younger age (70±11 years old without DR, 66±12.25 years old with NPDR, and 62±17 years old with PDR, P=0.001) and longer duration of DM (20±6 years without DR, 22±7 years with NPDR, and 23.5±9 years with PDR, P=0.022). Urine microalbumin levels (7.9±14.8 μg/mg Cr without DR, 12.55±33.55 μg/mg Cr with NPDR, and 48.2±302.6 μg/mg Cr with PDR, P<0.001) and serum creatinine levels (0.7±0.4 mg/dL without DR, 0.8±
0.4 mg/dL with NPDR, and 0.85±0.5 mg/dL with PDR, P=
0.017) were higher and creatinine clearance was lower (101.4±
42.75 mL/min without DR, 90±40.62 mL/min with NPDR, and 83.6±49.12 mL/min with PDR, P=0.044) in patients with more severe DR. In addition, patients with more severe DR had a lower γ-glutamyltransferase level (24±21 U/L without DR, 27±18.25 U/L with NPDR, and 18±13 U/L with PDR, P=0.001). Groups with more severe DR had a higher propor- tion of patients with a family history of cardiovascular disease (1.8% without DR, 2.8% with NPDR, and 12% with PDR, P=0.050), but less of a family history of cancer (36.2% without DR, 22.5% with NPDR, and 15.7% with PDR, P=0.045) (Table 1). A greater proportion of patients were using rapid-acting in- sulin (1.7% without DR, 18.1% with NPDR, and 25% with PDR, P<0.001), long-acting insulin (20.3% without DR, 38.9%
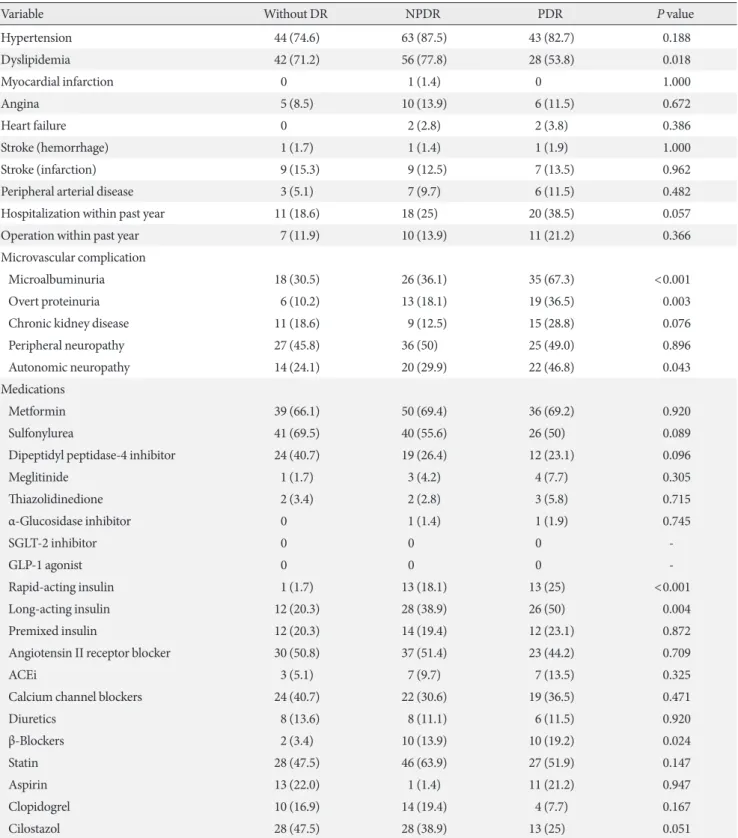
with NPDR, and 50% with PDR, P=0.004), and β-blockers (3.4% without DR, 13.9% with NPDR, and 19.2% with PDR, P=0.024) in groups with more severe DR. A larger proportion of patients in the groups with more severe DR had less physical activity (P=0.041) and fewer incidences of exercise per week (P=0.021) (Table 2).
Among microvascular complications, patients with more se- vere DR had a greater prevalence of microalbuminuria (30.5%
without DR, 36.1% with NPDR, and 67.3% with PDR, P<
0.001), overt proteinuria (10.2% without DR, 18.1% with NPDR, and 36.5% with PDR, P=0.003), and autonomic neu- ropathy (24.1% without DR, 29.9% with NPDR, and 46.8%
with PDR, P=0.043). In addition, the prevalence of dyslipid- emia was significantly different among the three groups (P=
0.018) (Table 2).
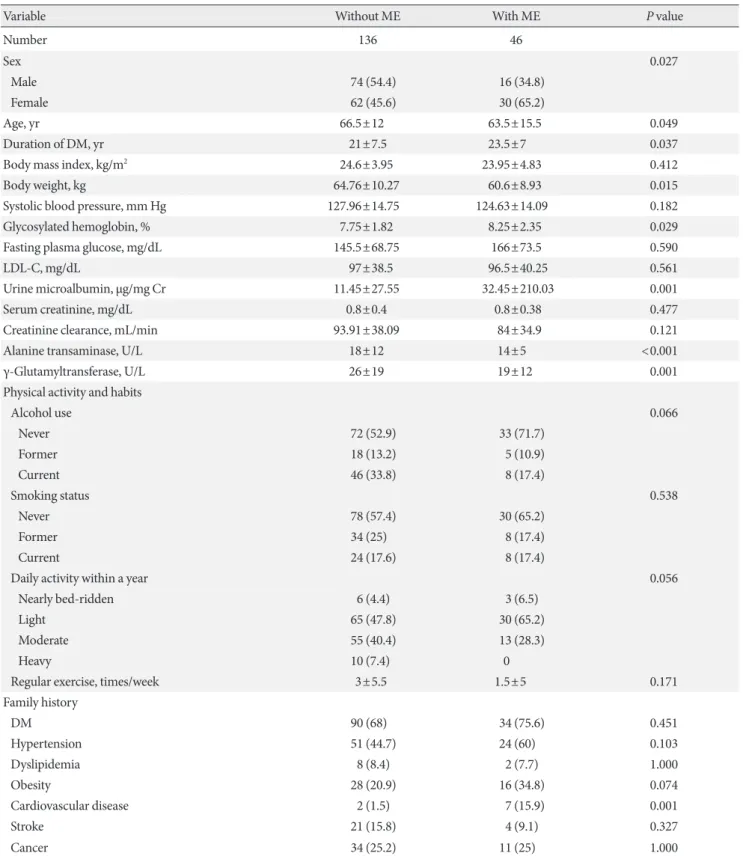
Comparison of characteristics with ME status
Tables 3 and 4 show selected characteristics comparing values in the presence or absence of ME. Among a total of 182 partici- 220 Registration
22 Withdrawal
15 Lost to follow-up 198 Written informed
consent and sample collection
183 Total enrolled Fig. 1. Study participants.
Table 1. Comparison of characteristics with DR status
Variable Without DR NPDR PDR P value
Number 59 (32.2) 72 (39.3) 52 (28.4)
Sex 0.301
Male 27 (45.8) 41 (56.9) 23 (44.2)
Female 32 (54.2) 31 (43.1) 29 (55.8)
Age, yr 70±11 66±12.25 62±17 0.001
Duration of DM, yr 20±6 22±7 23.5±9 0.022
Body mass index, kg/m2 24.66±3.12 24.7±3.26 24.21±3.45 0.694
Body weight, kg 63.4±12.45 64.36±10.67 62.52±10.28 0.606
Systolic blood pressure, mm Hg 127.9±15.98 127.99±14.26 124.46±13.92 0.332
Glycosylated hemoglobin, % 7.7±2 8±2.1 8.05±2.1 0.097
Fasting plasma glucose, mg/dL 134±59.5 158±69.5 151.5±80.25 0.060
LDL-C, mg/dL 102±37 95±37.5 85±42.5 0.139
Urine microalbumin, μg/mg Cr 7.9±14.8 12.55±33.55 48.2±302.6 <0.001
Serum creatinine, mg/dL 0.7±0.4 0.8±0.4 0.85±0.5 0.017
Creatinine clearance, mL/min 101.4±42.75 90±40.62 83.6±49.12 0.044
Alanine transaminase, U/L 18±10.5 18±10.25 16±8 0.063
γ-Glutamyltransferase, U/L 24±21 27±18.25 18±13 0.001
Physical activity and habits
Alcohol use 0.263
Never 34 (57.6) 36 (50) 35 (67.3)
Former 5 (8.5) 12 (16.7) 6 (11.5)
Current 20 (33.9) 24 (33.3) 11 (21.2)
Smoking status 0.089
Never 35 (59.3) 40 (55.6) 33 (63.5)
Former 19 (32.2) 16 (22.2) 8 (15.4)
Current 5 (8.5) 16 (22.2) 11 (21.2)
Daily activity within a year 0.041
Nearly bed-ridden 0 3 (4.2) 6 (11.5)
Light 28 (47.5) 39 (54.2) 29 (55.8)
Moderate 29 (49.2) 24 (33.3) 15 (28.8)
Heavy 2 (3.4) 6 (8.3) 2 (3.8)
Regular exercise, times/week 3±6.5 3±5 0±5 0.021
Family history
DM 35 (60.3) 49 (72.1) 41 (78.8) 0.107
Hypertension 27 (50.9) 24 (43.6) 25 (53.2) 0.654
Dyslipidemia 4 (9.8) 3 (6.5) 3 (8.8) 0.844
Obesity 12 (20.3) 19 (27.1) 13 (25) 0.689
Cardiovascular disease 1 (1.8) 2 (2.8) 6 (12) 0.050
Stroke 13 (23.2) 7 (9.7) 6 (12) 0.096
Cancer 21 (36.2) 16 (22.5) 8 (15.7) 0.045
Values are presented as number (%) or mean±standard deviation. P value for the chi-square test comparing the groups with and without DR.
Statistical comparisons were performed using the chi-square test (nominal data) or the Mann-Whitney U test (continuous data).
DR, diabetic retinopathy; NPDR, non-proliferative diabetic retinopathy; PDR, proliferative diabetic retinopathy; DM, diabetes mellitus; LDL-C, low density lipoprotein cholesterol.
Table 2. Comparison of the underlying comorbidities and the use of medications with a grade of DR
Variable Without DR NPDR PDR P value
Hypertension 44 (74.6) 63 (87.5) 43 (82.7) 0.188
Dyslipidemia 42 (71.2) 56 (77.8) 28 (53.8) 0.018
Myocardial infarction 0 1 (1.4) 0 1.000
Angina 5 (8.5) 10 (13.9) 6 (11.5) 0.672
Heart failure 0 2 (2.8) 2 (3.8) 0.386
Stroke (hemorrhage) 1 (1.7) 1 (1.4) 1 (1.9) 1.000
Stroke (infarction) 9 (15.3) 9 (12.5) 7 (13.5) 0.962
Peripheral arterial disease 3 (5.1) 7 (9.7) 6 (11.5) 0.482
Hospitalization within past year 11 (18.6) 18 (25) 20 (38.5) 0.057
Operation within past year 7 (11.9) 10 (13.9) 11 (21.2) 0.366
Microvascular complication
Microalbuminuria 18 (30.5) 26 (36.1) 35 (67.3) <0.001
Overt proteinuria 6 (10.2) 13 (18.1) 19 (36.5) 0.003
Chronic kidney disease 11 (18.6) 9 (12.5) 15 (28.8) 0.076
Peripheral neuropathy 27 (45.8) 36 (50) 25 (49.0) 0.896
Autonomic neuropathy 14 (24.1) 20 (29.9) 22 (46.8) 0.043
Medications
Metformin 39 (66.1) 50 (69.4) 36 (69.2) 0.920
Sulfonylurea 41 (69.5) 40 (55.6) 26 (50) 0.089
Dipeptidyl peptidase-4 inhibitor 24 (40.7) 19 (26.4) 12 (23.1) 0.096
Meglitinide 1 (1.7) 3 (4.2) 4 (7.7) 0.305
Thiazolidinedione 2 (3.4) 2 (2.8) 3 (5.8) 0.715
α-Glucosidase inhibitor 0 1 (1.4) 1 (1.9) 0.745
SGLT-2 inhibitor 0 0 0 -
GLP-1 agonist 0 0 0 -
Rapid-acting insulin 1 (1.7) 13 (18.1) 13 (25) <0.001
Long-acting insulin 12 (20.3) 28 (38.9) 26 (50) 0.004
Premixed insulin 12 (20.3) 14 (19.4) 12 (23.1) 0.872
Angiotensin II receptor blocker 30 (50.8) 37 (51.4) 23 (44.2) 0.709
ACEi 3 (5.1) 7 (9.7) 7 (13.5) 0.325
Calcium channel blockers 24 (40.7) 22 (30.6) 19 (36.5) 0.471
Diuretics 8 (13.6) 8 (11.1) 6 (11.5) 0.920
β-Blockers 2 (3.4) 10 (13.9) 10 (19.2) 0.024
Statin 28 (47.5) 46 (63.9) 27 (51.9) 0.147
Aspirin 13 (22.0) 1 (1.4) 11 (21.2) 0.947
Clopidogrel 10 (16.9) 14 (19.4) 4 (7.7) 0.167
Cilostazol 28 (47.5) 28 (38.9) 13 (25) 0.051
Values are presented as number (%). P value for the chi-square test comparing the groups with and without DR. Statistical comparisons were performed using the chi-square test (nominal data) or the Mann-Whitney U test (continuous data).
DR, diabetic retinopathy; NPDR, non-proliferative diabetic retinopathy; PDR, proliferative diabetic retinopathy; SGLT-2, sodium/glucose co- transporter 2; GLP-1, glucagon-like peptide-1; ACEi, angiotensin-converting enzyme inhibitor.
Table 3. Comparison of characteristics with ME status
Variable Without ME With ME P value
Number 136 46
Sex 0.027
Male 74 (54.4) 16 (34.8)
Female 62 (45.6) 30 (65.2)
Age, yr 66.5±12 63.5±15.5 0.049
Duration of DM, yr 21±7.5 23.5±7 0.037
Body mass index, kg/m2 24.6±3.95 23.95±4.83 0.412
Body weight, kg 64.76±10.27 60.6±8.93 0.015
Systolic blood pressure, mm Hg 127.96±14.75 124.63±14.09 0.182
Glycosylated hemoglobin, % 7.75±1.82 8.25±2.35 0.029
Fasting plasma glucose, mg/dL 145.5±68.75 166±73.5 0.590
LDL-C, mg/dL 97±38.5 96.5±40.25 0.561
Urine microalbumin, μg/mg Cr 11.45±27.55 32.45±210.03 0.001
Serum creatinine, mg/dL 0.8±0.4 0.8±0.38 0.477
Creatinine clearance, mL/min 93.91±38.09 84±34.9 0.121
Alanine transaminase, U/L 18±12 14±5 <0.001
γ-Glutamyltransferase, U/L 26±19 19±12 0.001
Physical activity and habits
Alcohol use 0.066
Never 72 (52.9) 33 (71.7)
Former 18 (13.2) 5 (10.9)
Current 46 (33.8) 8 (17.4)
Smoking status 0.538
Never 78 (57.4) 30 (65.2)
Former 34 (25) 8 (17.4)
Current 24 (17.6) 8 (17.4)
Daily activity within a year 0.056
Nearly bed-ridden 6 (4.4) 3 (6.5)
Light 65 (47.8) 30 (65.2)
Moderate 55 (40.4) 13 (28.3)
Heavy 10 (7.4) 0
Regular exercise, times/week 3±5.5 1.5±5 0.171
Family history
DM 90 (68) 34 (75.6) 0.451
Hypertension 51 (44.7) 24 (60) 0.103
Dyslipidemia 8 (8.4) 2 (7.7) 1.000
Obesity 28 (20.9) 16 (34.8) 0.074
Cardiovascular disease 2 (1.5) 7 (15.9) 0.001
Stroke 21 (15.8) 4 (9.1) 0.327
Cancer 34 (25.2) 11 (25) 1.000
Values are presented as number (%) or mean±standard deviation. P value for the chi-square test comparing the groups with and without ME.
Statistical comparisons were performed using the chi-square test (nominal data) or the Mann-Whitney U test (continuous data).
ME, macular edema; DM, diabetes mellitus; LDL-C, low density lipoprotein cholesterol.
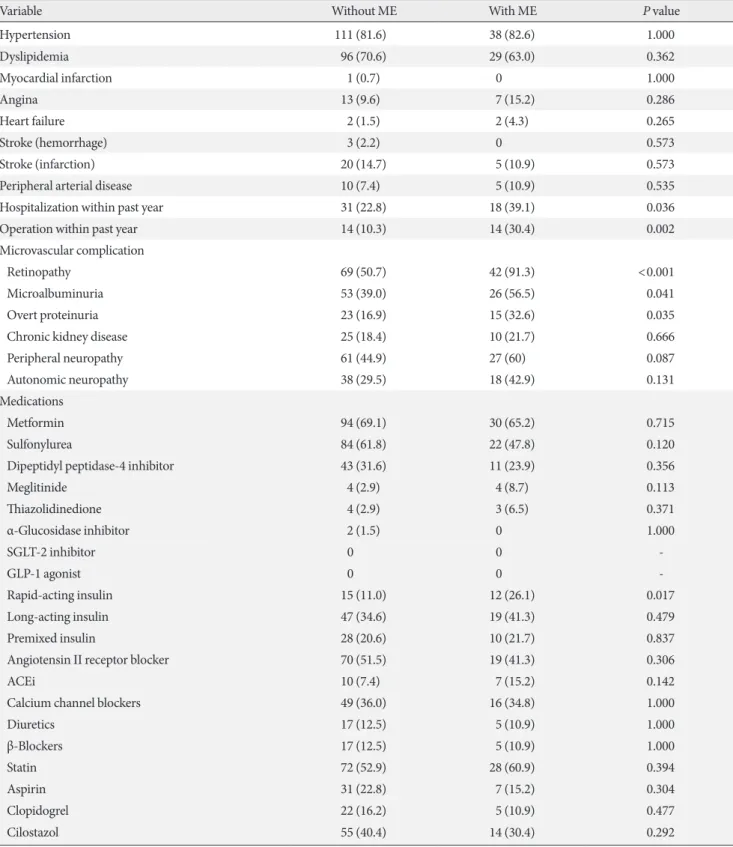
Table 4. Comparison of the underlying comorbidities and medication use with the presence of ME
Variable Without ME With ME P value
Hypertension 111 (81.6) 38 (82.6) 1.000
Dyslipidemia 96 (70.6) 29 (63.0) 0.362
Myocardial infarction 1 (0.7) 0 1.000
Angina 13 (9.6) 7 (15.2) 0.286
Heart failure 2 (1.5) 2 (4.3) 0.265
Stroke (hemorrhage) 3 (2.2) 0 0.573
Stroke (infarction) 20 (14.7) 5 (10.9) 0.573
Peripheral arterial disease 10 (7.4) 5 (10.9) 0.535
Hospitalization within past year 31 (22.8) 18 (39.1) 0.036
Operation within past year 14 (10.3) 14 (30.4) 0.002
Microvascular complication
Retinopathy 69 (50.7) 42 (91.3) <0.001
Microalbuminuria 53 (39.0) 26 (56.5) 0.041
Overt proteinuria 23 (16.9) 15 (32.6) 0.035
Chronic kidney disease 25 (18.4) 10 (21.7) 0.666
Peripheral neuropathy 61 (44.9) 27 (60) 0.087
Autonomic neuropathy 38 (29.5) 18 (42.9) 0.131
Medications
Metformin 94 (69.1) 30 (65.2) 0.715
Sulfonylurea 84 (61.8) 22 (47.8) 0.120
Dipeptidyl peptidase-4 inhibitor 43 (31.6) 11 (23.9) 0.356
Meglitinide 4 (2.9) 4 (8.7) 0.113
Thiazolidinedione 4 (2.9) 3 (6.5) 0.371
α-Glucosidase inhibitor 2 (1.5) 0 1.000
SGLT-2 inhibitor 0 0 -
GLP-1 agonist 0 0 -
Rapid-acting insulin 15 (11.0) 12 (26.1) 0.017
Long-acting insulin 47 (34.6) 19 (41.3) 0.479
Premixed insulin 28 (20.6) 10 (21.7) 0.837
Angiotensin II receptor blocker 70 (51.5) 19 (41.3) 0.306
ACEi 10 (7.4) 7 (15.2) 0.142
Calcium channel blockers 49 (36.0) 16 (34.8) 1.000
Diuretics 17 (12.5) 5 (10.9) 1.000
β-Blockers 17 (12.5) 5 (10.9) 1.000
Statin 72 (52.9) 28 (60.9) 0.394
Aspirin 31 (22.8) 7 (15.2) 0.304
Clopidogrel 22 (16.2) 5 (10.9) 0.477
Cilostazol 55 (40.4) 14 (30.4) 0.292
Values are presented as number (%). P value for the chi-square test comparing the groups with and without ME. Statistical comparisons were performed using the chi-square test (nominal data) or the Mann-Whitney U test (continuous data).
ME, macular edema; SGLT-2, sodium/glucose co-transporter 2; GLP-1, glucagon-like peptide-1; ACEi, angiotensin-converting enzyme inhibi- tor.
pants assessed with OCT, ME was present in 46 (25.27%). As with DR, statistically significant differences were found for several factors (Tables 3 and 4). Patients with ME were younger (66.5±12 years old vs. 63.5±15.5 years old, P=0.049), had a longer duration of DM (21±7.5 years vs. 23.5±7 years, P=
0.037), and a larger proportion of patients were female (45.6%
vs. 65.2%, P=0.027). Glycosylated hemoglobin (7.75%±1.82%
vs. 8.25%±2.35%, P=0.029) and urine microalbumin (11.45±
27.55 µg/mg Cr vs. 32.45±210.03 µg/mg Cr, P=0.001) levels were higher, along with a higher prevalence of overt protein- uria (16.9% vs. 32.6%, P=0.035) in the ME group (Table 3).
A greater proportion of patients underwent inpatient treat- ment (22.8% vs. 39.1%, P=0.036) and surgery (10.3% vs. 30.4%, P=0.002) within the past year. They had a higher prevalence of a family history of cardiovascular disease (1.5% vs. 15.9%, P=0.001). A significantly higher proportion of ME patients were using rapid-acting insulin (11.0% vs. 26.1%, P=0.017), but there was no significant difference in the use of long-acting (P=0.479) or premixed insulin (P=0.837) (Table 4).
Multivariate analyses for DR
Multivariate logistic regression analyses were conducted ac- cording to the characteristics of the variables shown in Tables 1 and 2. Several factors were found to be significantly associated with DR (Fig. 2). Younger age (odds ratio [OR], 0.874; 95%
confidence interval [CI], 0.820 to 0.930; P<0.001) and lower creatinine clearance (OR, 0.972; 95% CI, 0.950 to 0.995; P=
0.015) were associated with PDR. NPDR was associated with higher fasting plasma glucose levels (OR, 1.011; 95% CI, 1.004 to 1.019; P=0.004), lower urine microalbumin levels (OR, 0.996; 95% CI, 0.992 to 1.000; P=0.039), and less use of sulfo- nylurea (OR, 0.417; 95% CI, 0.175 to 0.996; P=0.049). In addi- tion, longer duration of DM (OR, 1.071; 95% CI, 1.001 to 1.147; P=0.048 for NPDR) (OR, 1.142; 95% CI, 1.051 to 1.242;
P=0.002 for PDR) and the use of long-acting insulin (OR, 4.559; 95% CI, 1.672 to 12.427; P=0.003 for NPDR) (OR, 4.783; 95% CI, 1.581 to 14.474; P=0.006 for PDR) were identi- fied as independent risk factors for both NPDR and PDR, whereas a family history of cancer was identified as a negative risk factor (OR, 0.310; 95% CI, 0.119 to 0.809; P=0.017 for NPDR) (OR, 0.206; 95% CI, 0.063 to 0.673; P=0.009 for PDR).
Multivariate analyses for ME
Several factors were found to be significantly associated with ME in multivariate logistic regression analysis (Fig. 3). Lower body weight (OR, 0.923; 95% CI, 0.856 to 0.995; P=0.036), lower systolic blood pressure (OR, 0.970; 95% CI, 0.942 to 1.000; P=0.047), and lower levels of alanine transaminase (OR, 0.863; 95% CI, 0.793 to 0.940; P<0.001) were associated with ME. Higher glycosylated hemoglobin levels (OR, 1.380, 95%
Fig. 2. Odds ratio of diabetic retinopathy based on various demographic, lifestyle, social, and clinical factors. NPDR, non-prolif- erative diabetic retinopathy; PDR, proliferative diabetic retinopathy; DM, dia betes mellitus; CI, confidence interval.
NPDR
PDR
Fasting plasma glucose
NPDR
PDR
Urine microalbumin
NPDR
PDR
Creatinine clearance
NPDR
PDR
Duration of DM
NPDR
PDR
Family history of cancer
NPDR
PDR
Sulfonylurea
NPDR
PDR
Long-acting insulin
NPDR
PDR
Age
0.952 (0.902, 1.004) 0.072 0.874 (0.820, 0.930) <0.001 1.011 (1.004, 1.019) 0.004 1.066 (0.997, 1.014) 0.191 0.996 (0.992, 1.000) 0.039 1.000 (0.997, 1.004) 0.820 0.993 (0.976, 1.011) 0.444 0.972 (0.950, 0.995) 0.015 1.071 (1.001, 1.147) 0.048 1.142 (1.051, 1.242) 0.002 0.310 (0.119, 0.809) 0.017 0.206 (0.063, 0.673) 0.009 0.417 (0.175, 0.996) 0.049 0.579 (0.203, 1.650) 0.306 4.559 (1.672, 12.427) 0.003 4.783 (1.581, 14.474) 0.006 Odds ratio (95% CI) P value
10 1
0.1
CI, 1.032 to 1.845; P=0.030), peripheral neuropathy (OR, 2.523; 95% CI, 1.026 to 6.202; P=0.044), family history of obe- sity (OR, 3.017; 95% CI, 1.075 to 8.465; P=0.036), history of surgery within the past year (OR, 3.618; 95% CI, 1.266 to 10.339; P=0.016), and the use of rapid-acting insulin (OR, 5.211; 95% CI, 1.445 to 18.794; P=0.012) were confirmed as independent risk factors for ME.
DISCUSSION
A registry-based study for standardized clinical research The authors have been running the KNDP since May 2006 [2].
The KNDP is a large-scale multicenter prospective cohort study that was established to observe the long-term clinical course of Korean T2DM patients [18]. It consists of 4,600 T2DM patients collected from 13 Korean university hospitals.
A well-structured systemically designed registry was estab- lished based on the knowledge and skills obtained through ex- periences with the KNDP cohort. Initially, it was designed as a case-control study on DR and a control group, but it was changed to a cohort-based study, which provides a higher level of evidence in clinical medicine. The goal of further studies is to perform long-term observations with a larger sample size based on the cohort of this study.
Summary of findings
In this study, we confirmed various clinical features associated
with the occurrence of DR and ME. DR was associated with higher levels of fasting plasma glucose, longer duration of DM, and greater use of long-acting insulin, but a lower prevalence of a family history of cancer. ME was associated with higher levels of glycosylated hemoglobin, a greater prevalence of sur- gery within the past year, and greater use of rapid-acting insu- lin.
Comparison with previous studies (1): diabetic retinopathy
The duration of DM, hyperglycemia, and hypertension are known to be major risk factors for DR [19,20]. Diabetic ne- phropathy is also strongly associated with DR [21]. These find- ings are also valid in the Korean population [22,23]. Our re- sults were consistent with previous findings in many ways, but some were inconsistent. For instance, we could not find a sig- nificant association of blood pressure with the presence or grade of DR. However, the use of β-blockers was significantly higher in the NPDR and PDR groups than in the group with- out DR.
We obtained significant results for several factors that showed unclear significance or inconsistent results in previous studies.
A younger age was associated with DR in our study. This might imply the association of DR with the diagnosis of T2DM at a younger age because our study only included T2DM patients with disease duration of longer than 15 years. The use of rapid- and long-acting insulin was associated with DR, which showed Fig. 3. Odds ratio of macular edema based on various demographic, lifestyle, social, and clinical factors. CI, confidence interval.
Age Body weight Systolic blood pressure Glycated hemoglobin Alanine transaminase Peripheral neuropathy Family history of obesity Operation within 1 year Rapid-acting insulin
0.969 (0.922, 1.018) 0.207 0.923 (0.856, 0.995) 0.036 0.970 (0.942, 1.000) 0.047 1.380 (1.032, 1.845) 0.030 0.863 (0.793, 0.940) 0.001 2.523 (1.026, 6.202) 0.044 3.017 (1.075, 8.465) 0.036 3.618 (1.266, 10.339) 0.016 5.211 (1.445, 18.794) 0.012 Odds ratio (95% CI) P value
10 1
0.1
inconsistent results as a risk factor in previous studies [21].
Comparison with previous studies (2): macular edema In addition to the major risk factors identified for DR, dyslip- idemia is also known to be a strong risk factor for ME [22]. As with DR, some of the findings in our study were inconsistent with previous findings. Systolic blood pressure, underlying hy- pertension, and the use of any antihypertensive medication did not differ between the non-ME group and the ME group.
As with DR, a younger age and the use of long-acting insulin were associated with ME. The proportion of females was high- er and body weight was lower in patients with ME. In addition, levels of alanine transaminase and γ-glutamyltransferase were lower in the ME group. A history of hospitalization and sur- gery within the past year was associated with ME. The mecha- nisms underlying most of these findings are not yet fully un- derstood.
Clinical implications and future research plans
Various environmental factors are considered to be signifi- cantly associated with the development of T2DM and related chronic complications. Genetic factors are also considered im- portant in disease progression and aggravation [21]. Although much effort has been expended on elucidating significant ge- netic factors and their influences in the clinical course of T2DM and its complications, the results thus far have not been fully satisfying. One possible reason for this is the difficulty of managing various types of clinical information and biospeci- mens by a consensus-based methodology, despite recent ad- vances in genotyping technology. Therefore, we should pay more attention to obtaining detailed and accurate information in clinical phenotyping for breakthroughs in relevant research.
To overcome the above problem, we established the research group on clinical data standardization for diabetes research at the KDA and prepared the draft of standardized data elements and standard procedures for multicenter patient registration and biospecimen collection. With this system, we organized a multicenter, prospective cohort for DR, initiated a genome- wide association study to verify performance, and encouraged participation by other investigators. Recently, this system was approved by the members of the KDA’s board of directors.
In addition, we only included patients with long-standing T2DM in our study, which is distinct from previous studies.
This unique study design was based on the hypothesis that there are several genetic and environmental factors that are
protective against the development of diabetic complications.
In addition, outcome definitions were clarified via ophthalmo- logic assessment by ophthalmology specialists, enhancing our confidence in the results.
Some of the results were inconsistent with the conventional risk factors established in previous studies. This might have been due to the limitations of our study. First, it was a single- center study with a small sample size. Second, causal relation- ships could not be identified since it was a cross-sectional study performed on baseline data. Third, the main reason for withdrawal was difficulty in performing complete ophthalmo- logic exams. This might have led to selection bias by excluding patients with poor performance status.
We are planning a 10-year follow-up of the data collected in this study, and additional recruitment is in progress. The limi- tations of the current study can be overcome by integrating data with other centers. This can be easily done through the electronic CRFs, CDEs, and SOPs established in this study. Fu- ture longitudinal studies will focus on identifying biomarkers associated with diabetic complications and assessing responses to medical treatment.
CONFLICTS OF INTEREST
No potential conflict of interest relevant to this article was re- ported.
ACKNOWLEDGMENTS
All of the authors thank Professor Emeritus Young Seol Kim at Kyung Hee University for his teaching and inspiration, which encouraged us to conduct the present study. This research was supported by a grant from the Korea Health Technology R&D Project through the Korea Health Industry Development Insti- tute (KHIDI), funded by the Ministry of Health and Welfare, Republic of Korea (HD14B1246 and HI16C2048).
REFERENCES
1. Lozano R, Naghavi M, Foreman K, Lim S, Shibuya K, Aboyans V, Abraham J, Adair T, Aggarwal R, Ahn SY, Alvarado M, An- derson HR, Anderson LM, Andrews KG, Atkinson C, Baddour LM, Barker-Collo S, Bartels DH, Bell ML, Benjamin EJ, Ben- nett D, Bhalla K, Bikbov B, Bin Abdulhak A, Birbeck G, Blyth F, Bolliger I, Boufous S, Bucello C, Burch M, Burney P, Carapetis
J, Chen H, Chou D, Chugh SS, Coffeng LE, Colan SD, Colquhoun S, Colson KE, Condon J, Connor MD, Cooper LT, Corriere M, Cortinovis M, de Vaccaro KC, Couser W, Cowie BC, Criqui MH, Cross M, Dabhadkar KC, Dahodwala N, De Leo D, Degenhardt L, Delossantos A, Denenberg J, Des Jarlais DC, Dharmaratne SD, Dorsey ER, Driscoll T, Duber H, Ebel B, Erwin PJ, Espindola P, Ezzati M, Feigin V, Flaxman AD, Forou- zanfar MH, Fowkes FG, Franklin R, Fransen M, Freeman MK, Gabriel SE, Gakidou E, Gaspari F, Gillum RF, Gonzalez-Medi- na D, Halasa YA, Haring D, Harrison JE, Havmoeller R, Hay RJ, Hoen B, Hotez PJ, Hoy D, Jacobsen KH, James SL, Jasrasar- ia R, Jayaraman S, Johns N, Karthikeyan G, Kassebaum N, Keren A, Khoo JP, Knowlton LM, Kobusingye O, Koranteng A, Krishnamurthi R, Lipnick M, Lipshultz SE, Ohno SL, Mabwei- jano J, MacIntyre MF, Mallinger L, March L, Marks GB, Marks R, Matsumori A, Matzopoulos R, Mayosi BM, McAnulty JH, McDermott MM, McGrath J, Mensah GA, Merriman TR, Mi- chaud C, Miller M, Miller TR, Mock C, Mocumbi AO, Mok- dad AA, Moran A, Mulholland K, Nair MN, Naldi L, Narayan KM, Nasseri K, Norman P, O’Donnell M, Omer SB, Ortblad K, Osborne R, Ozgediz D, Pahari B, Pandian JD, Rivero AP, Padil- la RP, Perez-Ruiz F, Perico N, Phillips D, Pierce K, Pope CA 3rd, Porrini E, Pourmalek F, Raju M, Ranganathan D, Rehm JT, Rein DB, Remuzzi G, Rivara FP, Roberts T, De Leon FR, Rosenfeld LC, Rushton L, Sacco RL, Salomon JA, Sampson U, Sanman E, Schwebel DC, Segui-Gomez M, Shepard DS, Singh D, Singleton J, Sliwa K, Smith E, Steer A, Taylor JA, Thomas B, Tleyjeh IM, Towbin JA, Truelsen T, Undurraga EA, Venketasu- bramanian N, Vijayakumar L, Vos T, Wagner GR, Wang M, Wang W, Watt K, Weinstock MA, Weintraub R, Wilkinson JD, Woolf AD, Wulf S, Yeh PH, Yip P, Zabetian A, Zheng ZJ, Lopez AD, Murray CJ, AlMazroa MA, Memish ZA. Global and re- gional mortality from 235 causes of death for 20 age groups in 1990 and 2010: a systematic analysis for the Global Burden of Disease Study 2010. Lancet 2012;380:2095-128.
2. Rhee SY, Chon S, Kwon MK, Park IeB, Ahn KJ, Kim IJ, Kim SH, Lee HW, Koh KS, Kim DM, Baik SH, Lee KW, Nam MS, Park YS, Woo JT, Kim YS. Prevalence of chronic complications in Korean patients with type 2 diabetes mellitus based on the Korean National Diabetes Program. Diabetes Metab J 2011;
35:504-12.
3. Rhee SY, Guan H, Liu ZM, Cheng SW, Waspadji S, Palmes P, Tai TY, Suwanwalaikorn S, Kim YS; PAD-SEARCH Study Group. Multi-country study on the prevalence and clinical fea- tures of peripheral arterial disease in Asian type 2 diabetes pa-
tients at high risk of atherosclerosis. Diabetes Res Clin Pract 2007;76:82-92.
4. Moon EJ, Jo YE, Park TC, Kim YK, Jung SH, Kim HJ, Kim DJ, Chung YS, Lee KW. Clinical characteristics and direct medical costs of type 2 diabetic patients. Korean Diabetes J 2008;32:
358-65.
5. Rhee SY, Kim YS, Oh S, Choi WH, Park JE, Jeong WJ. Diabcare Asia 2001: Korea country report on outcome data and analysis.
Korean J Intern Med 2005;20:48-54.
6. Jung JH, Lee JH, Noh JW, Park JE, Kim HS, Yoo JW, Song BR, Lee JR, Hong MH, Jang HM, Na Y, Lee HJ, Lee JM, Kang YG, Kim SY, Sim KH. Current status of management in type 2 dia- betes mellitus at general hospitals in South Korea. Diabetes Metab J 2015;39:307-15.
7. Stratton IM, Adler AI, Neil HA, Matthews DR, Manley SE, Cull CA, Hadden D, Turner RC, Holman RR. Association of glycaemia with macrovascular and microvascular complica- tions of type 2 diabetes (UKPDS 35): prospective observational study. BMJ 2000;321:405-12.
8. Kussmann M, Morine MJ, Hager J, Sonderegger B, Kaput J.
Perspective: a systems approach to diabetes research. Front Genet 2013;4:205.
9. Fernie AR, Trethewey RN, Krotzky AJ, Willmitzer L. Metabo- lite profiling: from diagnostics to systems biology. Nat Rev Mol Cell Biol 2004;5:763-9.
10. Houle D, Govindaraju DR, Omholt S. Phenomics: the next challenge. Nat Rev Genet 2010;11:855-66.
11. Cheung N, Mitchell P, Wong TY. Diabetic retinopathy. Lancet 2010;376:124-36.
12. Ko SH, Kim SR, Kim DJ, Oh SJ, Lee HJ, Shim KH, Woo MH, Kim JY, Kim NH, Kim JT, Kim CH, Kim HJ, Jeong IK, Hong EK, Cho JH, Mok JO, Yoon KH; Committee of Clinical Prac- tice Guidelines, Korean Diabetes Association. 2011 Clinical practice guidelines for type 2 diabetes in Korea. Diabetes Metab J 2011;35:431-6.
13. American Diabetes Association. Standards of medical care in diabetes: 2013. Diabetes Care 2013;36 Suppl 1:S11-66.
14. National Biobank of Korea. Guidelines for deposit and con- signment of human bioresources. Cheongju: National Biobank of Korea; 2014.
15. Wilkinson CP, Ferris FL 3rd, Klein RE, Lee PP, Agardh CD, Davis M, Dills D, Kampik A, Pararajasegaram R, Verdaguer JT;
Global Diabetic Retinopathy Project Group. Proposed interna- tional clinical diabetic retinopathy and diabetic macular edema disease severity scales. Ophthalmology 2003;110:1677-82.
16. Wu L, Fernandez-Loaiza P, Sauma J, Hernandez-Bogantes E, Masis M. Classification of diabetic retinopathy and diabetic macular edema. World J Diabetes 2013;4:290-4.
17. Expert Panel on Detection, Evaluation, and Treatment of High Blood Cholesterol in Adults. Executive summary of the third report of the National Cholesterol Education Program (NCEP) Expert Panel on Detection, Evaluation, and Treatment of High Blood Cholesterol in Adults (Adult Treatment Panel III).
JAMA 2001;285:2486-97.
18. Rhee SY, Hong SM, Chon S, Ahn KJ, Kim SH, Baik SH, Park YS, Nam MS, Lee KW, Woo JT, Kim YS. Hypoglycemia and medical expenses in patients with type 2 diabetes mellitus: an analysis based on the Korea National Diabetes Program Co- hort. PLoS One 2016;11:e0148630.
19. Ding J, Wong TY. Current epidemiology of diabetic retinopa- thy and diabetic macular edema. Curr Diab Rep 2012;12:346- 54.
20. Yau JW, Rogers SL, Kawasaki R, Lamoureux EL, Kowalski JW, Bek T, Chen SJ, Dekker JM, Fletcher A, Grauslund J, Haffner S,
Hamman RF, Ikram MK, Kayama T, Klein BE, Klein R, Krish- naiah S, Mayurasakorn K, O’Hare JP, Orchard TJ, Porta M, Rema M, Roy MS, Sharma T, Shaw J, Taylor H, Tielsch JM, Varma R, Wang JJ, Wang N, West S, Xu L, Yasuda M, Zhang X, Mitchell P, Wong TY; Meta-Analysis for Eye Disease (META- EYE) Study Group. Global prevalence and major risk factors of diabetic retinopathy. Diabetes Care 2012;35:556-64.
21. Lee R, Wong TY, Sabanayagam C. Epidemiology of diabetic retinopathy, diabetic macular edema and related vision loss.
Eye Vis (Lond) 2015;2:17.
22. Jee D, Lee WK, Kang S. Prevalence and risk factors for diabetic retinopathy: the Korea National Health and Nutrition Exami- nation Survey 2008-2011. Invest Ophthalmol Vis Sci 2013;54:
6827-33.
23. Kim YJ, Kim JG, Lee JY, Lee KS, Joe SG, Park JY, Kim MS, Yoon YH. Development and progression of diabetic retinopa- thy and associated risk factors in Korean patients with type 2 diabetes: the experience of a tertiary center. J Korean Med Sci 2014;29:1699-705.