Prevalence and Characteristics of Metabolically Obese but Normal Weight and Metabolically Healthy but Obese in Middle-aged
Koreans: the Chungju Metabolic Disease Cohort (CMC) Study
Seung-Hwan Lee, Hee-Sung Ha1, Young-Jun Park1, Jin-Hee Lee2, Hyeon-Woo Yim1, Kun-Ho Yoon, Moo-Il Kang, Won-Chul Lee1, Ho-Young Son, Yong-Moon Park1, Hyuk-Sang Kwon
Division of Endocrinology and Metabolism, Department of Internal Medicine, College of Medicine, The Catholic University of Korea, Seoul;
Department of Preventive Medicine1, College of Medicine, The Catholic University of Korea, Seoul; Catholic Institute of U-healthcare2, The Catholic University of Korea, Seoul, Korea
Received: 29 December 2010, Accepted: 21 March 2011 Corresponding authors:
Yong-Moon Park
Department of Preventive Medicine, College of Medicine, The Catholic University of Korea, 505 Banpo-dong, Seocho-gu, Seoul 137-701, Korea
Tel: +82-2-2258-7369, Fax: +82-2-532-3820, E-mail: mark@catholic.ac.kr Hyuk-Sang Kwon
Department of Internal Medicine, Yeouido St. Mary’s Hospital, 62 Yeouido-dong, Youngdeungpo-gu, Seoul 150-713, Korea
Tel: +82-2-3779-1039, Fax: +82-2-785-5655, E-mail: drkwon@catholic.ac.kr
* This study was supported by research grants from Korean Endocrine Society (2006), Seoul R&D project and Ministry for health, welfare and family affairs (A080872) and the “2003-2005 Korea Health Promotion Research Program” of the Ministry of Health and Welfare, Republic of Korea.
Background: We attempted to determine the prevalence and characteristics of metabolically obese but normal weight (MONW) and metabolically healthy but obese (MHO) individuals in a large cohort of middle-aged Koreans.
Methods: 8,987 non-diabetic subjects were selected from the Chungju Metabolic disease Cohort Study performed in 2003-2006.
MONW was defined as a body mass index (BMI) ≥ 18.5 and < 23 kg/m2 with a homeostasis model assessment of insulin resis- tance (HOMA-IR) in the highest quartile. MHO was defined as BMI ≥ 25 kg/m2 with HOMA-IR in the lowest quartile.
Results: The mean age of the subjects was 62.3 ± 10.5 years (men 40.4%). The age-adjusted prevalence of MONW and MHO were 4.3% (5.3% men, 3.7% women) and 5.6% (3.6% men, 7.0% women), respectively. 14.2% of men and 12.9% of women were classi- fied as MONW among the normal weight population, whereas 10.7% of men and 14.5% of women were classified as MHO among the obese subjects. The prevalence of prediabetes was significantly higher in the MONW group than in the MHO group (34.7 vs.
12.5%, P < 0.0001 in men; 23.1 vs. 8.8%, P < 0.0001 in women). The MONW group evidenced an equivalent risk of coronary heart disease (CHD) relative to the MHO group (10.77 ± 0.68 vs. 10.22 ± 0.90% in men; 7.02 ± 0.34 vs. 7.26 ± 0.26% in women, means ± standard error [SE]).
Conclusion: The subjects in the MONW group are characterized by a high risk of diabetes and CHD, despite their normal weights. Their substantial prevalence in the population emphasizes the importance of identifying subjects in the MONW group, and warrants more intensive risk management. (Endocrinol Metab 26:133-141, 2011)
Key Words: Cohort study, Insulin resistance, Metabolically healthy but obese, Metabolically obese but normal weight, Nondia- betic population
INTRODUCTION
Insulin resistance has been accepted as the most important factor in describing the pathophysiology of the metabolic syndrome
(MetS), which has been increasingly identified worldwide in associ- ation with the epidemic of obesity [1-3]. This syndrome is character- ized by well-known risk factors for cardiovascular disease (CVD), such as glucose intolerance, hypertension, dyslipidemia and central obesity. Although body mass index (BMI) is the most widely used surrogate reflecting obesity and is reliably associated with adverse metabolic outcomes, it does not necessarily correlate with the de- gree of insulin resistance.
Recent observations indicate that a subgroup of nonobese or slightly obese subjects who are metabolically obese but normal weight (MONW) individuals, present with several risk factors in re- lation to insulin resistance [4,5]. Persons with MONW are charac- terized by an altered insulin sensitivity, a higher level of abdominal and visceral adiposity, a more atherogenic lipid profile, a higher blood pressure and a lower physical activity energy expenditure,
thus being more vulnerable to type 2 diabetes and CVD [5-11].
Somewhat the opposite of MONW individuals are metabolically healthy but obese (MHO) individuals who demonstrate normal to high levels of insulin sensitivity, a lower level of visceral adiposity and more favorable cardiovascular risk profiles despite having large amounts of fat mass [5,12-14].
Asian populations are generally less obese but tend to have hi- gher body fat content and a higher degree of insulin resistance than other ethnic populations with similar BMI [15-17]. Although identifying subgroups of MONW or MHO might have clinical sig- nificance, studies on Asian subjects have been rarely conducted [8,18]. Therefore, we aimed to identify the prevalence and the clini- cal characteristics of MONW and MHO individuals in a large co- hort of the middle-aged non-diabetic Korean population. Also, their relevance to diabetes and the risk of coronary heart disease (CHD) were investigated.
MATERIALS AND METHODS
1. Subjects
This population-based cohort study was performed in 2003- 2006 on adults over 40 years old living in the rural area of Chungju city, Korea. Three hundred and thirty-four districts were selected by stratified random cluster sampling and 11,718 subjects partici- pated. We analyzed the data of 8987 subjects (3632 men and 5355 women) who were without known or newly diagnosed diabetes mellitus, with complete laboratory data including fasting insulin, as well as anthropometric measurement. This study was approved by the institutional review board of The Catholic University of Korea (No. CUMC10U941, CUMC10U942) and written informed consent was obtained from all participants.
2. Protocols and biochemical assays
All investigators were educated sufficiently in relation to the study protocol prior to physical examination and the question- naire. On the day of the investigation, the detailed data on the medical history, medication and smoking habits of the subjects were obtained. Physical examinations were performed by measur- ing height, weight, waist and hip circumference according to stan- dardized methods. Prior to the measurement of blood pressure (BP), the subjects were asked to rest for 5 minutes while seated.
The BP on the right upper arm was measured twice and the aver- age of two measurements was obtained. Blood samples were col-
lected after the subjects had fasted for at least 12 hours and anal- ysed at a central laboratory (Samkwang Medical Laboratories, Seoul, Korea). Fasting plasma glucose (FPG) was measured using the hexokinase method and serum insulin was measured using a radioimmunoassay kit (Dainabot, Tokyo, Japan). Serum total cho- lesterol and triglyceride (TG) were measured using enzymatic calo- rimetric tests, high-density lipoprotein (HDL) cholesterol was mea- sured using a selective inhibition method, and low-density lipopro- tein (LDL) cholesterol was calculated by Friedewald formula. A 75 g oral glucose tolerance test (OGTT) was performed on a separate day if the FPG level exeeded 110 mg/dL. Other study protocols, in- cluding the method of measuring anthropometry and blood pres- sure, have been described in detail in our previous reports [19-21].
3. Definition of metabolic syndrome and prediabetes
MetS was defined using the American Heart Association/Na- tional Heart, Lung and Blood Institute criteria with a modification in waist circumference (WC) value according to the World Health Organization-Asian Pacific region criteria for abdominal obesity [22]. It was defined if three or more of the following criteria were satisfied: 1) WC ≥ 90 cm for men and ≥ 80 cm for women; 2) TG ≥ 150 mg/dL; 3) HDL-cholesterol < 40 mg/dL for men and < 50 mg/
dL for women; 4) BP ≥ 130/85 mmHg or 5) FPG ≥ 100 mg/dL. All individuals taking pharmacological treatment for hypertension were assumed as having raised BP and all subjects receiving fi- brates were assumed as having both raised TG and reduced HDL- cholesterol. Diabetes and prediabetes were defined according to the American Diabetes Association criteria. As the OGTT was per- formed in subjects with abnormal FPG, prediabetes included sub- jects with isolated impaired fasting glucose or combined impaired fasting glucose and impaired glucose tolerance.
4. Definition of metabolically healthy and normal weight (MHNW), MONW, MHO and metabolically obese and obese (MOO) Being ‘metabolically obese’ was defined as having the highest quartile of insulin resistance estimated by the homeostasis model assessment (HOMA-IR = fasting insulin [μU/mL] × FPG [mmol/
L]/22.5) [23]. Being ‘metabolically healthy’ was defined as having the lowest quartile of HOMA-IR. MHNW and MONW were de- fined if individuals had a BMI ≥ 18.5 and < 23 kg/m2 with HOMA- IR in the lowest and highest quartile, respectively. MHO and MOO were defined if individuals had a BMI ≥ 25 kg/m2 with HOMA-IR in the lowest and highest quartile, respectively. Another definition
was also adopted, where having MetS was defined as ‘metaboli- cally obese’ and not having MetS as ‘metabolically healthy’ (MetS derived definition).
5. Assessment of CHD risk
The Framingham risk score was used in predicting the likelihood of CHD during the following 10-year period [24]. The degrees of risk were converted to numerical values based on factors including age, diabetes, smoking habit, BP, TC or LDL-cholesterol levels and HDL-cholesterol levels, and were expressed as percentile values.
6. Statistical analysis
All statistical analyses were performed using SAS version 9.01 package (SAS institute, Cary, NC, USA). Parameters showing skew- ed distributions (insulin, HOMA-IR, TG) were transformed loga- rithmically to achieve a normal distribution. The differences in the characteristics of subgroups were compared using Student’s t tests or Chi squared tests. Analysis of covariance was used to compare the age-adjusted 10-year risk of CHD among the subgroups. Data
are expressed as the means ± standard deviation (SD), as medians (25th-75th percentiles) or in percentile values except where noted.
A P-value < 0.05 was considered significant.
RESULTS
1. Baseline characteristics
The baseline clinical characteristics are shown in Table 1. The mean age of the participants was 62.3 ± 10.5 years and 40.4% were male. The mean BMI, WC and waist-hip ratio (WHR) of the men were 23.4 ± 3.1 kg/m2, 84.1 ± 8.4 cm and 0.92 ± 0.06, respectively.
In women, the mean values of these parameters were 24.6 ± 3.4 kg/m2, 81.4 ± 8.9 cm and 0.88 ± 0.07, respectively. The prevalence of prediabetes (20.4 vs. 14.9%, P < 0.0001) was higher in men, while hypertension (49.8 vs. 45.7%, P < 0.0001) and metabolic syn- drome (40.0 vs. 22.9%, P < 0.0001) were more frequent in women.
As all of the parameters except age and BP were significantly dif- ferent between men and women, further analyses were performed separately.
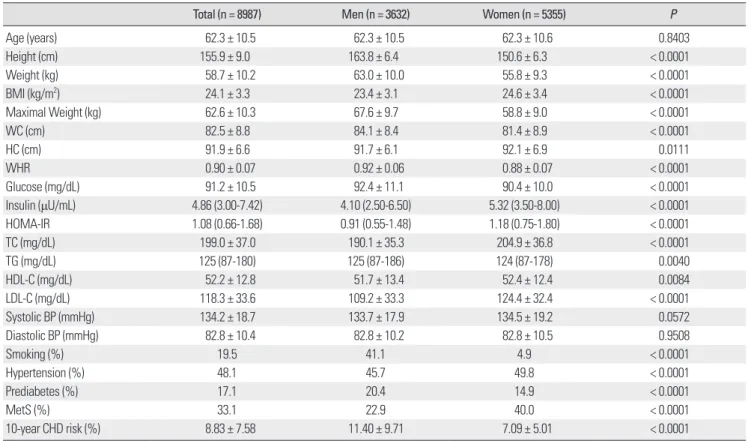
Table 1. Baseline characteristics of the study subjects
Total (n = 8987) Men (n = 3632) Women (n = 5355) P
Age (years) 62.3 ± 10.5 62.3 ± 10.5 62.3 ± 10.6 0.8403
Height (cm) 155.9 ± 9.0 163.8 ± 6.4 150.6 ± 6.3 < 0.0001
Weight (kg) 58.7 ± 10.2 63.0 ± 10.0 55.8 ± 9.3 < 0.0001
BMI (kg/m2) 24.1 ± 3.3 23.4 ± 3.1 24.6 ± 3.4 < 0.0001
Maximal Weight (kg) 62.6 ± 10.3 67.6 ± 9.7 58.8 ± 9.0 < 0.0001
WC (cm) 82.5 ± 8.8 84.1 ± 8.4 81.4 ± 8.9 < 0.0001
HC (cm) 91.9 ± 6.6 91.7 ± 6.1 92.1 ± 6.9 0.0111
WHR 0.90 ± 0.07 0.92 ± 0.06 0.88 ± 0.07 < 0.0001
Glucose (mg/dL) 91.2 ± 10.5 92.4 ± 11.1 90.4 ± 10.0 < 0.0001
Insulin (μU/mL) 4.86 (3.00-7.42) 4.10 (2.50-6.50) 5.32 (3.50-8.00) < 0.0001
HOMA-IR 1.08 (0.66-1.68) 0.91 (0.55-1.48) 1.18 (0.75-1.80) < 0.0001
TC (mg/dL) 199.0 ± 37.0 190.1 ± 35.3 204.9 ± 36.8 < 0.0001
TG (mg/dL) 125 (87-180) 125 (87-186) 124 (87-178) 0.0040
HDL-C (mg/dL) 52.2 ± 12.8 51.7 ± 13.4 52.4 ± 12.4 0.0084
LDL-C (mg/dL) 118.3 ± 33.6 109.2 ± 33.3 124.4 ± 32.4 < 0.0001
Systolic BP (mmHg) 134.2 ± 18.7 133.7 ± 17.9 134.5 ± 19.2 0.0572
Diastolic BP (mmHg) 82.8 ± 10.4 82.8 ± 10.2 82.8 ± 10.5 0.9508
Smoking (%) 19.5 41.1 4.9 < 0.0001
Hypertension (%) 48.1 45.7 49.8 < 0.0001
Prediabetes (%) 17.1 20.4 14.9 < 0.0001
MetS (%) 33.1 22.9 40.0 < 0.0001
10-year CHD risk (%) 8.83 ± 7.58 11.40 ± 9.71 7.09 ± 5.01 < 0.0001
Data are expressed as means ± SD, % or median (25th-75th percentiles).
BMI, body mass index; BP, blood pressure; CHD, coronary heart disease; HC, hip circumference; HDL-C, high-density lipoprotein cholesterol; HOMA-IR, homeostasis model assessment of insulin resistance; LDL-C, low-density lipoprotein cholesterol; MetS, metabolic syndrome; TC, total cholesterol; TG, triglyceride; WC, waist circumference; WHR, waist-hip ratio.
2. The prevalence of MONW and MHO
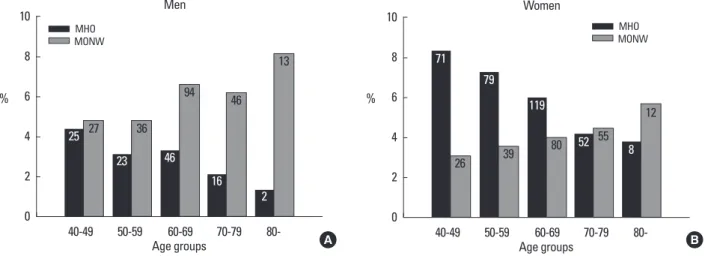
Table 2 shows the distribution of the subjects according to HOMA-IR quartile and BMI groups. The prevalence of MONW was 5.95% for men and 3.96% for women. This corresponds to 14.2% for men and 12.9% for women, among the normal weight subjects. The prevalence of MHO was 3.08% for men and 6.14% for women. This corresponds to 10.7% for men and 14.5% for women among obese subjects. The prevalence of MONW increased in proportion to age while that of MHO decreased both in men and women (Fig. 1). The age-adjusted prevalence of MONW and MHO were 4.3% (95% confidence interval [CI]: 3.8, 4.9) (5.3% [95% CI:
4.4, 6.3] for men, 3.7% [95% CI: 3.1, 4.3] for women) and 5.6% (95%
CI: 5.0, 6.3) (3.6% [95% CI: 2.7, 4.5] for men, 7.0% [95% CI: 6.0, 7.9]
for women), respectively. Using the MetS derived definition, the
prevalence of MONW were 3.73% for men (8.9% among normal weight subjects) and 6.94% for women (22.7% among normal weight subjects). In this case, the prevalence of MHO were 15.2%
for men (52.8% among obese subjects) and 18.9% for women (44.4% among obese subjects).
3. The comparison of subgroups according to HOMA-IR quartile and BMI groups
Table 3 shows the comparison between subjects with MHNW versus MONW, MHO versus MOO, and MONW versus MHO in men. The age was generally higher in the normal weight group than the obese group. Within the same BMI group, subjects within the highest quartile of insulin resistance (MONW and MOO) had significantly higher levels of BMI, WC, WHR, FPG, fasting insulin,
Fig. 1. Prevalence of MONW and MHO according to age groups. A. Men, B. Women. The numbers in the bars represent numbers of the subjects in each group.
MHO, metabolically healthy but obese; MONW, metabolically obese but normal weight.
10 8 6 4 2
0
40-49 50-59
Age groups Men MHO
MONW
60-69 70-79 80-
27 36
25 23
94
46
46
16
13
2
A
10 8 6 4 2
0
40-49 50-59
Age groups Women
MHO MONW
60-69 70-79 80-
26 39
71 79
80 119
52 55
12 8
B
% %
Table 2. Distribution of subjects according to HOMA-IR quartile and BMI groups
Men Women
HOMA-IR Q1
(n = 910) HOMA-IR Q2
(n = 906) HOMA-IR Q3
(n = 908) HOMA-IR Q4
(n = 908) HOMA-IR Q1
(n = 1339) HOMA-IR Q2
(n = 1335) HOMA-IR Q3
(n = 1340) HOMA-IR Q4 (n = 1341) BMI < 18.5 (kg/m2) 79
(2.18) 35
(0.96) 24
(0.66) 12
(0.33) 89
(1.66) 30
(0.56) 15
(0.28) 12
(0.22) 18.5 ≤ BMI < 23 (kg/m2) 537
(14.79) 454
(12.50) 319
(8.79) 216
(5.95) 629
(11.75) 469
(8.76) 337
(6.29) 212
(3.96) 23 ≤ BMI < 25 (kg/m2) 182
(5.01)
234 (6.44)
271 (7.46)
226 (6.22)
292 (5.45)
371 (6.93)
352 (6.57)
278 (5.19) BMI ≥ 25 (kg/m2) 112
(3.08) 183
(5.04) 294
(8.10) 453
(12.48) 329
(6.14) 464
(8.67) 636
(11.88) 839
(15.67) Data are expressed as n (%).
The median (25th-75th percentiles) values of HOMA-IR quartiles are Q1: 0.37 (0.25-0.46), Q2: 0.72 (0.64-0.82), Q3: 1.15 (1.03-1.30) and Q4: 2.15 (1.72-2.84) for men and Q1: 0.53 (0.37-0.65), Q2: 0.97 (0.86-1.07), Q3: 1.44 (1.29-1.60) and Q4: 2.44 (2.08-3.23) for women.
BMI, body mass index; HOMA-IR, homeostasis model assessment of insulin resistance.
HOMA-IR, and lipid profiles than the subjects within the lowest quartile of insulin resistance (MHNW and MHO). When comparing MONW with MHO, FPG, fasting insulin, and HOMA-IR of MONW
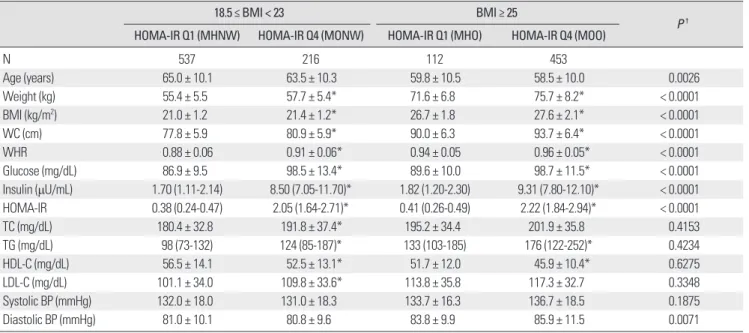
were significantly higher than those of MHO. However, diastolic BP was significantly higher in MHO and there were no significant differences in lipid profiles (Table 3). Similar results were noted in Table 3. Comparison of clinical characteristics according to HOMA-IR quartile and BMI groups in men
18.5 ≤ BMI < 23 BMI ≥ 25
P † HOMA-IR Q1 (MHNW) HOMA-IR Q4 (MONW) HOMA-IR Q1 (MHO) HOMA-IR Q4 (MOO)
N 537 216 112 453
Age (years) 65.0 ± 10.1 63.5 ± 10.3 59.8 ± 10.5 58.5 ± 10.0 0.0026
Weight (kg) 55.4 ± 5.5 57.7 ± 5.4* 71.6 ± 6.8 75.7 ± 8.2* < 0.0001
BMI (kg/m2) 21.0 ± 1.2 21.4 ± 1.2* 26.7 ± 1.8 27.6 ± 2.1* < 0.0001
WC (cm) 77.8 ± 5.9 80.9 ± 5.9* 90.0 ± 6.3 93.7 ± 6.4* < 0.0001
WHR 0.88 ± 0.06 0.91 ± 0.06* 0.94 ± 0.05 0.96 ± 0.05* < 0.0001
Glucose (mg/dL) 86.9 ± 9.5 98.5 ± 13.4* 89.6 ± 10.0 98.7 ± 11.5* < 0.0001
Insulin (μU/mL) 1.70 (1.11-2.14) 8.50 (7.05-11.70)* 1.82 (1.20-2.30) 9.31 (7.80-12.10)* < 0.0001 HOMA-IR 0.38 (0.24-0.47) 2.05 (1.64-2.71)* 0.41 (0.26-0.49) 2.22 (1.84-2.94)* < 0.0001
TC (mg/dL) 180.4 ± 32.8 191.8 ± 37.4* 195.2 ± 34.4 201.9 ± 35.8 0.4153
TG (mg/dL) 98 (73-132) 124 (85-187)* 133 (103-185) 176 (122-252)* 0.4234
HDL-C (mg/dL) 56.5 ± 14.1 52.5 ± 13.1* 51.7 ± 12.0 45.9 ± 10.4* 0.6275
LDL-C (mg/dL) 101.1 ± 34.0 109.8 ± 33.6* 113.8 ± 35.8 117.3 ± 32.7 0.3348
Systolic BP (mmHg) 132.0 ± 18.0 131.0 ± 18.3 133.7 ± 16.3 136.7 ± 18.5 0.1875
Diastolic BP (mmHg) 81.0 ± 10.1 80.8 ± 9.6 83.8 ± 9.9 85.9 ± 11.5 0.0071
Data are expressed as means ± SD, % or median (25th-75th percentiles).
*P < 0.05 versus HOMA-IR Q1 in same BMI range, †P value of MONW versus MHO.
BMI, body mass index; BP, blood pressure; HDL-C, high-density lipoprotein cholesterol; HOMA-IR, homeostasis model assessment of insulin resistance; LDL-C, low- density lipoprotein cholesterol; MHNW, metabolically healthy and normal weight; MHO, metabolically healthy but obese; MONW, metabolically obese but normal weight; MOO, metabolically obese and obese; N, number; TC, total cholesterol; TG, triglyceride; WC, waist circumference; WHR, waist-hip ratio.
Table 4. Comparison of clinical characteristics according to HOMA-IR quartile and BMI groups in women
18.5 ≤ BMI < 23 BMI ≥ 25
P † HOMA-IR Q1 (MHNW) HOMA-IR Q4 (MONW) HOMA-IR Q1 (MHO) HOMA-IR Q4 (MOO)
N 629 212 329 839
Age (years) 65.1 ± 10.8 64.3 ± 10.7 59.9 ± 10.3 61.3 ± 9.9* < 0.0001
Weight (kg) 47.0 ± 5.0 48.7 ± 4.6* 62.1 ± 6.9 64.6 ± 7.3* < 0.0001
BMI (kg/m2) 21.0 ± 1.2 21.6 ± 1.1* 27.3 ± 2.2 28.2 ± 2.4* < 0.0001
WC (cm) 74.0 ± 6.9 77.0 ± 6.8* 85.5 ± 7.1 89.2 ± 7.2* < 0.0001
WHR 0.85 ± 0.07 0.88 ± 0.07* 0.89 ± 0.06 0.91 ± 0.06* 0.0253
Glucose (mg/dL) 85.2 ± 7.6 94.6 ± 13.1* 87.7 ± 9.4 95.9 ± 10.5* < 0.0001
Insulin (μU/mL) 2.42 (1.80-3.10) 9.85 (8.67-12.87)* 2.50 (1.80-3.20) 10.90 (9.30-14.30)* < 0.0001 HOMA-IR 0.52 (0.39-0.64) 2.25 (1.97-2.91)* 0.55 (0.38-0.66) 2.55 (2.12-3.33)* < 0.0001
TC (mg/dL) 196.3 ± 33.8 208.7 ± 34.7* 206.5 ± 35.5 213.2 ± 38.0* 0.4745
TG (mg/dL) 106 (78-142) 132 (92-183)* 116 (85-172) 148 (104-212)* 0.0335
HDL-C (mg/dL) 55.1 ± 12.5 52.2 ± 12.1* 51.9 ± 11.7 50.2 ± 12.1* 0.7404
LDL-C (mg/dL) 118.0 ± 30.7 127.1 ± 31.2* 127.3 ± 31.3 129.8 ± 33.7 0.9321
Systolic BP (mmHg) 132.8 ± 19.5 133.8 ± 19.9 135.1 ± 18.9 137.9 ± 19.5* 0.4626
Diastolic BP (mmHg) 81.6 ± 10.7 81.4 ± 10.4 84.2 ± 10.7 84.6 ± 10.7 0.0028
Data are expressed as means ± SD, % or median (25th-75th percentiles).
*P < 0.05 versus HOMA-IR Q1 in same BMI range, †P value of MONW versus MHO.
BMI, body mass index; BP, blood pressure; HDL-C, high-density lipoprotein cholesterol; HOMA-IR, homeostasis model assessment of insulin resistance; LDL-C, low- density lipoprotein cholesterol; MHNW, metabolically healthy and normal weight; MHO, metabolically healthy but obese; MONW, metabolically obese but normal weight; MOO, metabolically obese and obese; N, number; TC, total cholesterol; TG, triglyceride; WC, waist circumference; WHR, waist-hip ratio.
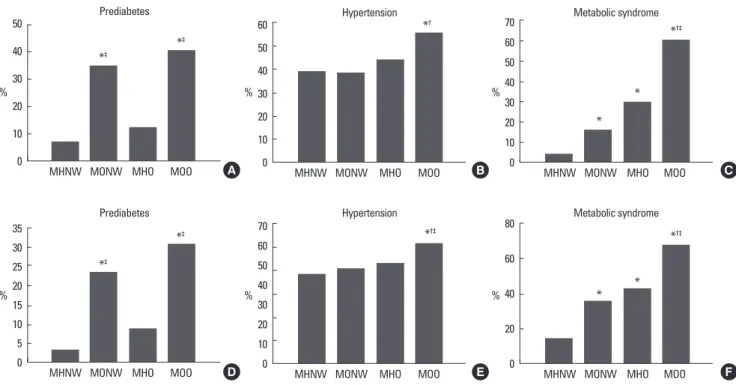
women (Table 4). Additionally, the TG levels of MONW were higher than those of MHO. The prevalence of prediabetes and metabolic syndrome was significantly higher in MONW and MOO groups when compared to the MHNW and MHO groups, respec- tively. Despite a lesser degree of obesity, when compared with MHO group, subjects within MONW group showed a higher prev- alence of prediabetes (34.7 vs. 12.5%, P < 0.0001 in men; 23.1 vs.
8.8%, P < 0.0001 in women). However, there were no significant
Fig. 2. Prevalence of metabolic diseases in MHNW, MONW, MHO, and MOO. A. Prediabetes in men, B. Hypertension in men, C. MetS in men, D. Prediabetes in women, E. Hypertension in women, F. MetS in women. *P < 0.05 versus MHNW; †P < 0.05 versus MONW; ‡P < 0.05 versus MHO. MHNW, metabolically healthy and normal weight; MHO, metabolically healthy but obese; MONW, metabolically obese but normal weight, MOO, metabolically obese and obese.
50 40 30 20 10
0 MHNW MONW
*‡ *‡
Prediabetes
MHO MOO A
60 50 40 30 20 10
0 MHNW MONW
*† Hypertension
MHO MOO B
70 60 50 40 30 20 10
0 MHNW MONW
*†‡
Hypertension
MHO MOO E
80 60 40 20
0 MHNW MONW
*†‡
* *
Metabolic syndrome
MHO MOO F
35 30 25 20 15 10 5
0 MHNW MONW
*‡
*‡ Prediabetes
MHO MOO D
70 60 50 40 30 20 10
0 MHNW MONW
*†‡
*
* Metabolic syndrome
MHO MOO C
%
%
%
%
%
%
differences in the prevalence of hypertension between the two groups. These findings were similar in men and women (Fig. 2).
4. Estimated age-adjusted 10-year CHD risk
Within the same BMI group, subjects within the highest quartile of insulin resistance (MONW and MOO) had a significantly higher risk of CHD than the subjects within the lowest quartile of insulin resistance (MHNW and MHO). The risk of CHD was highest in Fig. 3. Estimated age-adjusted 10-year CHD risk in MHNW, MONW, MHO, and MOO. A. Men, B. Women. Data are expressed as means ± SE. *P < 0.05 versus MHNW; †P < 0.05 versus MONW; ‡P < 0.05 versus MHO. MHNW, metabolically healthy and normal weight; MHO, metabolically healthy but obese; MONW, meta- bolically obese but normal weight, MOO, metabolically obese and obese.
16 14 12 10 8 6 4 2
0 MHNW MONW
*
*†‡
Men
MHO MOO A
16 14 12 10 8 6 4 2
0 MHNW MONW
* * *†‡
Women
%
%
MHO MOO B
MOO group and showed significant differences when compared with the other three groups. The MONW group showed an equiva- lent risk of CHD when compared with the MHO group (10.77 ± 0.68 vs. 10.22 ± 0.90% in men; 7.02 ± 0.34 vs. 7.26 ± 0.26% in women, means ± standard error [SE]). These findings were similar in men and women (Fig. 3). However, using the MetS derived defi- nition, the 10-year CHD risk of the MONW group was significantly higher than that of the MHO group in both men (22.48 ± 0.80 vs.
8.98 ± 0.38%, P < 0.0001) and women (10.34 ± 0.25 vs. 4.82 ± 0.13%, P < 0.0001).
DISCUSSION
In general, it is known that the more obese an individual, the more likely they are to be insulin resistant. However, subpheno- types of obesity have been recognized that diverge from this asso- ciation. Since the proposal of the concept of MONW and MHO, several studies had been performed on the prevalence and clinical characteristics of these subjects [4-14]. Although Asian populations show significant differences in the distribution of obesity and the degree of insulin resistance, there is little information available on these subphenotypes. Our data show that a substantial proportion of people could be classified as MONW or MHO and emphasizes the necessity of our attention. Despite a lesser degree of obesity, subjects within MONW group showed a higher prevalence of pre- diabetes and at least an equivalent risk of CHD when compared with the MHO group.
Previous studies demonstrated that the prevalences of MONW and MHO vary considerably according to the subjects and the vari- ous definitions used. The prevalence of MONW ranged from 4.6 to 23.5% of the normal weight population; however, such studies mainly included Caucasians. Park et al. [25] reported from the third National Health and Nutrition Examination Survey (NHANES) that 4.6% of men and 6.2% women with BMI less than 27 kg/m2 had MetS. Meigs et al. [11] demonstrated that 7% and 7.7% of subjects with BMI less than 25 kg/m2 had MetS or highest quartile of HOMA-IR, respectively. Despite the higher BMI criteria used, these studies showed a lower prevalence of MONW than our observa- tions, which might imply ethnic differences. Twenty three point five Percent of US adults with BMI less than 25 kg/m2 had more than 2 cardiometabolic abnormalities, such as elevated BP, elevated levels of TG, FPG, and high-sensitivity C-reactive protein, elevated HOMA-IR value and reduced HDL-cholesterol level [26]. To date,
there is only one Korean data set showing that 12.7% of adults with BMI less than 25 kg/m2 had MetS, from the third Korean NHANES [18]. Although this study adopted different diagnostic criteria, it suggests that more than 10% of Korean normal weight subjects could be classified as MONW, which seems to be in conjunction with our study. The prevalence of MHO is also highly variable but tends to be higher than that of MONW especially when the ab- sence of MetS is considered as being ‘metabolically healthy’. Meigs et al. [11] reported that 37% of subjects with BMI over 30 kg/m2 did not have MetS and Wildman et al. [26] demonstrated that 31.7% of adults with BMI over 30 kg/m2 had no, or only one, cardiometa- bolic abnormality. The Korean NHANES data showed that nearly half (47.9%) of the obese (BMI ≥ 25 kg/m2) subjects did not have MetS [18]. When using the same criteria, the prevalence of MHO in our subjects was similar. However, it was greatly reduced when adopting HOMA-IR criteria. The age-dependent increase in the prevalence of MONW and decrease in that of MHO is consistent with previous observations [11,18,26] and might be associated with an increase in the degree of insulin resistance and the loss of lean mass that occurs with the aging process [27].
Several well-known characteristics of MONW were identifiable, including central obesity, increased FPG levels and a more athero- genic lipid profile when compared with subjects with MHNW. Op- posite findings characterized MHO compared with MOO. Interest- ingly, subjects within the MONW group showed a higher preva- lence of prediabetes and an equivalent risk of CHD when com- pared with the MHO group, in spite of a lesser degree of obesity.
When regarding having MetS as being ‘metabolically obese’, the risk of CVD was significantly higher in the MONW group com- pared to that of the MHO group. These results suggest that subjects with MONW is prone to at least an equivalent risk of CHD com- pared with subjects with MHNW, although it may vary according to different definitions used. Obesity is one of the important fac- tors contributing to insulin resistance that results in the develop- ment of CVD and type 2 diabetes [28,29]. However, as most obese people do not experience such cardiometabolic diseases, insulin resistance, rather than simple obesity, might be serving as a core pathophysiologic mechanism. In fact a meta-analysis of 250,152 pa- tients with CHD found that obese (BMI 30-35 kg/m2) patients had no increased risk for total mortality or cardiovascular mortality [30].
Another point to consider is whether differences in clinical charac- teristics of MONW and MHO will really result in corresponding clinical outcomes. One longitudinal study following subjects up to
11 years showed that the MONW group had a relative risk for dia- betes of 3.97 (95% confidence interval 1.35-11.6) and a risk for CVD of 3.01 (1.68-5.41) [11]; however, more evidence should be ac- cumulated. Whether MHO individuals would gain any metabolic benefit from lifestyle modification and weight loss also remains to be elucidated, since a few studies have failed to demonstrate meta- bolic improvements after intervention [31].
A strength of our study is that these data come from the largest population with homogenous ethnicity and similar lifestyle pat- terns. However, this study has several limitations. Because this co- hort consists of middle-aged to elderly subjects, the prevalence and the characteristics might be somewhat different when younger in- dividuals are included. We could not measure the body fat mass, energy expenditure or the levels of adipokines which might fur- ther characterize the subgroups of subjects. In addition, the method of measuring the degree of insulin resistance was not the gold standard, although HOMA-IR is a suitable measure for large- scale studies and is a good representative in non-diabetic subjects.
We also have to consider that the application of Framingham CHD risk score in Koreans is not validated yet.
In conclusion, when MONW and MHO were defined by BMI category and HOMA-IR quartiles, the prevalence of these sub- groups in Korea was not negligible. More than 10% of normal weight subjects were classified as MONW and similar proportions of obese subjects belonged to MHO. The subjects in MONW group are confronted by a high risk of diabetes and CHD despite their normal weight. Future studies should focus upon finding easier and more precise markers for MONW and MHO. In addition, the mechanisms and genetic background that might explain the differ- ences in the characteristics should be further investigated. Devel- oping a consensus on the criteria for definition of these subgroups is an important issue and will broaden our understanding regard- ing the clinical importance of MONW and MHO.
REFERENCES
1. Eckel RH, Grundy SM, Zimmet PZ: The metabolic syndrome. Lancet 365:1415-1428, 2005
2. Yoon KH, Lee JH, Kim JW, Cho JH, Choi YH, Ko SH, Zimmet P, Son HY: Epidemic obesity and type 2 diabetes in Asia. Lancet 368:1681-1688, 2006
3. Cameron AJ, Shaw JE, Zimmet PZ: The metabolic syndrome: prevalence in worldwide populations. Endocrinol Metab Clin North Am 33:351-375, 2004
4. Ruderman NB, Schneider SH, Berchtold P: The “metabolically-obese,”
normal-weight individual. Am J Clin Nutr 34:1617-1621, 1981 5. Karelis AD, St-Pierre DH, Conus F, Rabasa-Lhoret R, Poehlman ET: Met-
abolic and body composition factors in subgroups of obesity: what do we know? J Clin Endocrinol Metab 89:2569-2575, 2004
6. Ruderman N, Chisholm D, Pi-Sunyer X, Schneider S: The metabolically obese, normal-weight individual revisited. Diabetes 47:699-713, 1998 7. Conus F, Rabasa-Lhoret R, Peronnet F: Characteristics of metabolically
obese normal-weight (MONW) subjects. Appl Physiol Nutr Metab 32:4- 12, 2007
8. Katsuki A, Sumida Y, Urakawa H, Gabazza EC, Murashima S, Maruyama N, Morioka K, Nakatani K, Yano Y, Adachi Y: Increased visceral fat and serum levels of triglyceride are associated with insulin resistance in Japa- nese metabolically obese, normal weight subjects with normal glucose tol- erance. Diabetes Care 26:2341-2344, 2003
9. Conus F, Allison DB, Rabasa-Lhoret R, St-Onge M, St-Pierre DH, Trem- blay-Lebeau A, Poehlman ET: Metabolic and behavioral characteristics of metabolically obese but normal-weight women. J Clin Endocrinol Metab 89:5013-5020, 2004
10. Dvorak RV, DeNino WF, Ades PA, Poehlman ET: Phenotypic characteris- tics associated with insulin resistance in metabolically obese but normal- weight young women. Diabetes 48:2210-2214, 1999
11. Meigs JB, Wilson PW, Fox CS, Vasan RS, Nathan DM, Sullivan LM, D’Agostino RB: Body mass index, metabolic syndrome, and risk of type 2 diabetes or cardiovascular disease. J Clin Endocrinol Metab 91:2906-2912, 2006
12. Karelis AD, Faraj M, Bastard JP, St-Pierre DH, Brochu M, Prud’homme D, Rabasa-Lhoret R: The metabolically healthy but obese individual presents a favorable inflammation profile. J Clin Endocrinol Metab 90:4145-4150, 2005
13. Brochu M, Tchernof A, Dionne IJ, Sites CK, Eltabbakh GH, Sims EA, Poehlman ET: What are the physical characteristics associated with a nor- mal metabolic profile despite a high level of obesity in postmenopausal women? J Clin Endocrinol Metab 86:1020-1025, 2001
14. McLaughlin T, Abbasi F, Lamendola C, Reaven G: Heterogeneity in the prevalence of risk factors for cardiovascular disease and type 2 diabetes mellitus in obese individuals: effect of differences in insulin sensitivity.
Arch Intern Med 167:642-648, 2007
15. Park YW, Allison DB, Heymsfield SB, Gallagher D: Larger amounts of visceral adipose tissue in Asian Americans. Obes Res 9:381-387, 2001 16. Wang J, Thornton JC, Russell M, Burastero S, Heymsfield S, Pierson RN
Jr: Asians have lower body mass index (BMI) but higher percent body fat than do whites: comparisons of anthropometric measurements. Am J Clin Nutr 60:23-28, 1994
17. Lear SA, Kohli S, Bondy GP, Tchernof A, Sniderman AD: Ethnic variation in fat and lean body mass and the association with insulin resistance. J Clin Endocrinol Metab 94:4696-4702, 2009
18. Lee K: Metabolically obese but normal weight (MONW) and metaboli- cally healthy but obese (MHO) phenotypes in Koreans: characteristics and health behaviors. Asia Pac J Clin Nutr 18:280-284, 2009
19. Kwon HS, Park YM, Lee HJ, Lee JH, Choi YH, Ko SH, Lee JM, Kim SR, Kang SY, Lee WC, Ahn MS, Noh JH, Kang JM, Kim DS, Yoon KH, Cha BY, Lee KW, Kang SK, Son HY: Prevalence and clinical characteris- tics of the metabolic syndrome in middle-aged Korean adults. Korean J
Intern Med 20:310-316, 2005
20. Kim JH, Kwon HS, Park YM, Lim SY, Lee JH, Lee SH, Lim DJ, Hong SH, Cho JH, Kim SR, Kim DS, Yoon KH, Lee WC, Cha BY, Lee KW, Kang SK, Son HY: Best surrogate marker for insulin resistance in middle aged non-diabetic Korean: Chungju metabolic syndrome study. Korean J Med 73:611-617, 2007
21. Park YM, Kwon HS, Lim SY, Lee JH, Yoon KH, Son HY, Yim HW, Lee WC: Optimal waist circumference cutoff value reflecting insulin resistance as a diagnostic criterion of metabolic syndrome in a nondiabetic Korean population aged 40 years and over: the Chungju Metabolic Disease Cohort (CMC) study. Yonsei Med J 51:511-518, 2010
22. Grundy SM, Cleeman JI, Daniels SR, Donato KA, Eckel RH, Franklin BA, Gordon DJ, Krauss RM, Savage PJ, Smith SC Jr, Spertus JA, Costa F:
Diagnosis and management of the metabolic syndrome: an American Heart Association/National Heart, Lung, and Blood Institute Scientific Statement. Circulation 112:2735-2752, 2005
23. Matthews DR, Hosker JP, Rudenski AS, Naylor BA, Treacher DF, Turner RC: Homeostasis model assessment: insulin resistance and beta-cell func- tion from fasting plasma glucose and insulin concentrations in man. Dia- betologia 28:412-419, 1985
24. Wilson PW, D’Agostino RB, Levy D, Belanger AM, Silbershatz H, Kan- nel WB: Prediction of coronary heart disease using risk factor categories.
Circulation 97:1837-1847, 1998
25. Park YW, Zhu S, Palaniappan L, Heshka S, Carnethon MR, Heymsfield
SB: The metabolic syndrome: prevalence and associated risk factor findings in the US population from the Third National Health and Nutrition Ex- amination Survey, 1988-1994. Arch Intern Med 163:427-436, 2003 26. Wildman RP, Muntner P, Reynolds K, McGinn AP, Rajpathak S, Wylie-
Rosett J, Sowers MR: The obese without cardiometabolic risk factor clus- tering and the normal weight with cardiometabolic risk factor clustering:
prevalence and correlates of 2 phenotypes among the US population (NHANES 1999-2004). Arch Intern Med 168:1617-1624, 2008 27. Paolisso G, Tagliamonte MR, Rizzo MR, Giugliano D: Advancing age
and insulin resistance: new facts about an ancient history. Eur J Clin Invest 29:758-769, 1999
28. Kahn SE, Hull RL, Utzschneider KM: Mechanisms linking obesity to in- sulin resistance and type 2 diabetes. Nature 444:840-846, 2006
29. Rader DJ: Effect of insulin resistance, dyslipidemia, and intra-abdominal adiposity on the development of cardiovascular disease and diabetes melli- tus. Am J Med 120:S12-18, 2007
30. Romero-Corral A, Montori VM, Somers VK, Korinek J, Thomas RJ, Alli- son TG, Mookadam F, Lopez-Jimenez F: Association of bodyweight with total mortality and with cardiovascular events in coronary artery disease: a systematic review of cohort studies. Lancet 368:666-678, 2006
31. Primeau V, Coderre L, Karelis AD, Brochu M, Lavoie ME, Messier V, Sladek R, Rabasa-Lhoret R: Characterizing the profile of obese patients who are metabolically healthy. Int J Obes (Lond), 2010 [Epub ahead of print]