Background and Purpose Previous studies have explored the association between retinal vascular changes and cognitive impairment. The retinal vasculature shares some characteris- tics with the cerebral vasculature, and quantitative changes in it could indicate cognitive im- pairment. Hence, a comprehensive meta-analysis was performed to clarify the potential rela- tionship between retinal vascular geometric changes and cognitive impairment.
Methods Relevant databases were scrupulously and systematically searched for retinal vascu- lar geometric changes including caliber, tortuosity, and fractal dimension (FD), and for cogni- tive impairment. The Newcastle-Ottawa Scale was used to evaluate the methodological quality of included studies. RevMan was used to perform the meta-analysis and detect publication bias. Sensitivity analyses were also performed.
Results Five studies that involved 2,343 subjects were finally included in the meta-analysis.
The results showed that there was no significant association between central retinal artery equivalents (Z=1.17) or central retinal venular equivalents (Z=1.74) and cognitive impairment (both p>0.05). Similarly, no significant difference was detected in retinal arteriolar tortuosity (Z=0.91) and venular tortuosity (Z=1.31) (both p>0.05). However, the retinal arteriolar FD (mean difference: -0.03, 95% CI: -0.05, -0.01) and venular FD (mean difference: -0.03, 95% CI:
-0.05, -0.02) were associated with cognitive impairment.
Conclusions A smaller retinal microvascular FD might be associated with cognitive impair- ment. Further large-sample and well-controlled original studies are required to confirm the pres- ent findings.
Key Words retina, cognitive impairment, meta-analysis, retinal vessels.
Association between Retinal Vascular Geometric Changes and Cognitive Impairment: A Systematic Review and
Meta-Analysis
INTRODUCTION
The aging of the world’s population has resulted in a tremendous increase in the incidence of aging-related brain diseases. Cognitive impairment is one such disease that has be- come very common among the elderly population. All kinds of aging-related brain diseas- es adversely impact the health and quality of life of elderly people, and they are expensive to diagnose, treat, and manage, hence representing a huge economic burden on the affected families as well as society as a whole.1 Previous studies have investigated different types of aging populations comprising people older than 70 years, and have found that 14% of this population has mild cognitive impairment (MCI), which involves a cognitive dysfunction severity between normal aging and dementia.2,3 When this condition worsens, the patient will suffer from Alzheimer’s disease (AD).1 According to Alzheimer’s Association Interna- tional, 44 million people currently suffer from dementia worldwide, and this number will Huiqun Wua*
Chendong Wanga* Cong Chena Xiaotao Xua Yi Zhua Aimin Sangb Kui Jianga Jiancheng Donga
a Department of Medical Informatics, Medical School of Nantong University, Nantong, China
b Department of Ophthalmology, Affiliated Hospital of Nantong University, Nantong, China
pISSN 1738-6586 / eISSN 2005-5013 / J Clin Neurol 2020;16(1):19-28 / https://doi.org/10.3988/jcn.2020.16.1.19
Received April 8, 2019 Revised July 4, 2019 Accepted July 4, 2019 Correspondence Aimin Sang, MD
Department of Ophthalmology, Affiliated Hospital of
Nantong University, Nantong 226001, China Tel +86-513-85051891 Fax +86-513-85051820 E-mail [email protected]
*These authors contributed equally to this work.
cc This is an Open Access article distributed under the terms of the Creative Commons Attribution Non-Com- mercial License (https://creativecommons.org/licenses/by-nc/4.0) which permits unrestricted non-commercial use, distribution, and reproduction in any medium, provided the original work is properly cited.
JCN
Open Access ORIGINAL ARTICLERetinal Vascular Changes and Cognitive Impairment
JCN
increase to 76 million in 2030 and 135 million in 2050.4 Such growth will inevitably lead to enormous increases in the eco- nomic and health burdens on societies worldwide.
Cognitive function can be quantified using several psycho- logical questionnaires into different levels based on the cog- nitive decline5 and mental disability.6 In clinical situations, several imaging protocols such as CT and MRI are sometimes used to detect structural changes in the brain or cerebral vas- culature. Such imaging modalities are valuable diagnosing the severity of cognitive impairment,7-10 but they are also expen- sive and can only be performed in large hospitals. Due to the similarity between the retinal and cerebral vasculatures, im- aging biomarkers on high-resolution retinal images are prom- ising features comparable with low-resolution brain images obtained by CT or MRI. Moreover, retinal imaging is less ex- pensive and can be applied in community hospitals, thus pro- viding the potential for the large-scale screening of aging populations.
The advances of computer programs developed for medi- cal imaging have facilitated several computerized measure- ments on captured retinal images for discovering the relation- ship between retinal changes and clinical diseases.11,12 There are increasing data on the retinal changes and some diseas- es, including those affecting the brain. Several studies have re- vealed a relationship between retinal vascular changes and the incidence of dementia.13 Several clinical investigations have at- tempted to determine whether the retinal vasculature could be an imaging biomarker for cognitive impairment, and the re- sults suggest that there is an association between retinal chang- es and cognitive impairment. However, some reported findings have been found to be inconsistent, and so in this study we performed a comprehensive meta-analysis to determine the relationship between retinal vascular geometric changes and cognitive impairment.
METHODS
Search strategy
We performed a comprehensive search of the following elec- tronic databases up to July 2018: China National Knowledge Infrastructure (CNKI), Chinese VIP Information, Wanfang, PubMed, and Embase. Our main aim was to include all pub- lished studies that investigated the relationship between reti- nal vascular geometric changes and cognitive impairment.
We used the following search terms to identify these published studies: retina*, retinopathy, fundus, vascular, microvascu- lar, blood vessel, microvascula*, microvasculature, fractal dimension (FD), Df, FD, tortuosity, curvature, width, caliber, central retinal arteriolar equivalents (CRAE), CRAE, central retinal venular equivalents (CRVE), CRVE, branching angle,
geometric changes, cogniti*, Alzheimer’s disease, AD, MCI, dementia, aphrenia, loss of memory, dysfunction, impair- ment, abnormalities, and decline. The above terms were combined in various ways to form a complete retrieval sys- tem. The reference lists of identified studies were also exam- ined rigorously to determine whether they met our inclu- sion criteria. We also performed a manual search of the gray literature, including theses, dissertations, and conference pro- ceedings. We obtained raw data by contacting the original authors by email.
The study protocol was conducted in accordance with the ethical guidelines of the 1995 Declaration of Helsinki and was approved by Ethics Committee of Affiliated Hospital Nantong University (IRB No. 2018-L084).
Selection criteria and exclusion criteria
The inclusion criteria for the clinical trials were as follows:
1) Involving patients with different levels of cognitive im- pairment, from memory loss to MCI and AD. These patients were diagnosed using various instruments, including the Na- tional Institute of Neurological and Communicative Disorders and Stroke and the Alzheimer’s Disease and Related Disorders Association criteria (NINDS-ADRDA criteria)14 and the Mini Mental State Examination.15
2) Reporting on measures and quantitative data on retinal microvascular changes, including CRAE, CRVE, FD, and tor- tuosity.
3) A case–control study design.
4) Published in the medical literature written in English or Chinese.
5) Published between December 2012 and August 2018.
The exclusion criteria for the clinical trials were as follows:
1) Inadequate data on retinal vascular parameters.
2) Reported in a language other than English or Chinese.
3) Inclusion of cases or controls with other confounding diseases that might affect mental health.
Quality assessment and data extraction
We appraised the quality of all included studies using the Newcastle-Ottawa Scale16 and RevMan (version 5.3, The Nordic Cochrane Centre, The Cochrane Collaboration, Co- penhagen, Denmark). A high-quality case–control study had the following characteristics: adequate definition and repre- sentativeness of the case, clear definition and selection of controls, reasonable comparability of cases and controls based on the study design or analysis, ascertainment of exposure, using the same method to as certain cases and controls, and a low no-response rate. Two reviewers (W.C. & C.C.) evalu- ated and cross-checked the quality of the studies, and if there were any discrepancies, another author (W.H.) was consulted
Wu H et al.
JCN
to reach a consensus. Fig. 1 illustrates the risk of bias among the five included studies.
Two reviewers (W.C. & C.C.) independently extracted data using a data-extraction form. To identify all of the published literature studies, they considered the name of the first author and the year of publication. The following data were extracted for the reported studies: year of publication, inclusion and ex- clusion criteria, sample size, age, racial group, sex, the number or percentage of diabetes mellitus patients, pre-existing eye diseases, ophthalmic camera and imaging conditions, retinal microvascular abnormalities, cognitive measures and out- comes, and other confounding risk factors such as the histo- ry of smoking and hypertension. All duplicated studies were excluded in this systematic review.
Statistical analysis
The meta-analysis was performed using RevMan software (ver- sion 5.3). In the statistical analysis we calculated the mean dif- ference (MD) and its 95% confidence interval (CI) as effect factors. Heterogeneity was determined with the chi-square test, and quantified by calculating the inconsistency index I2. We determined the impact of the combined effects by synthesiz- ing all studies using different statistical models according to the heterogeneity. The results were considered to be statisti- cally significant when the two-sided p value was less than 0.05. In addition, funnel plots were constructed to detect the presence of publication bias and other types of bias. Finally, sensitivity analyses were performed to improve the accuracy of the tests.
RESULTS
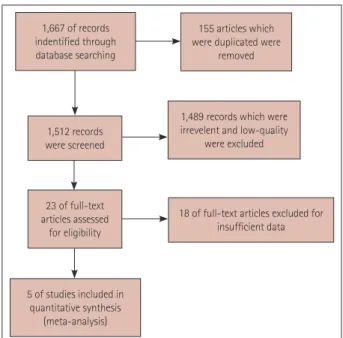
Search results
After retrieving 1,667 references from the PubMed, Embase, CNKI, and Wanfang databases, we finally included 5 stud- ies3,17-20 that were consistent with the inclusion and exclusion criteria of this meta-analysis. Fig. 1 shows a flow chart of the study selection process.
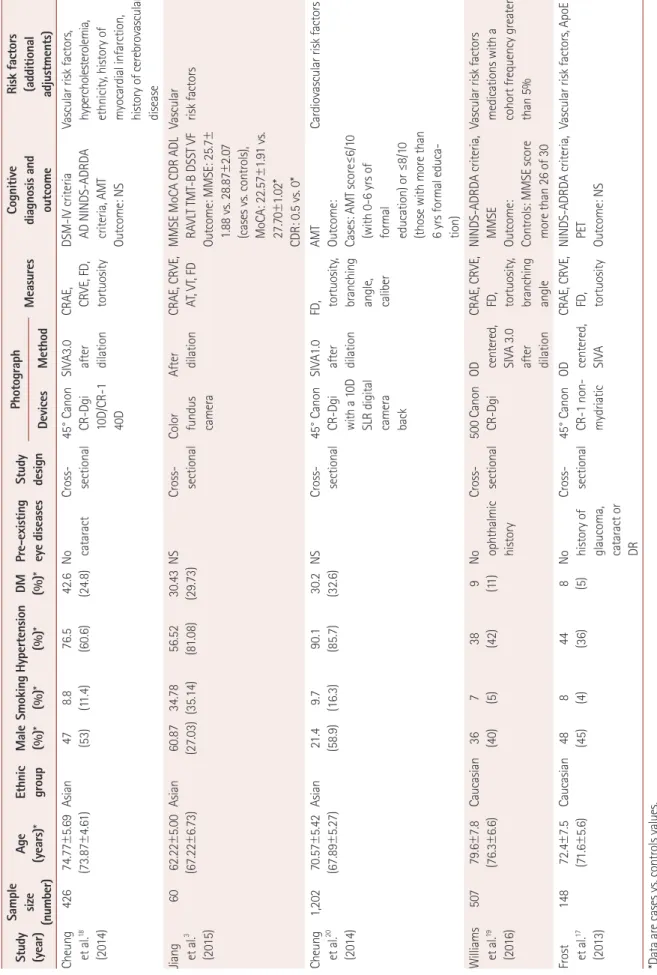
Summary characteristics of included studies
While the 5 included studies involved 2,343 subjects, only 671 of them had cognitive impairment or AD. Frost et al.,17 Cheung et al.,18 and Williams et al.19 all used NINDS-ADRDA criteria to diagnose AD. Most of the participants included in the present meta-analysis were aged between 60 to 80 years.
Both males and females were included in the case and control groups. The participants in the included studies were Asian or Caucasian. Each study had a cross-sectional design. Most of the included participants in both the case and control groups had hypertension. Nearly one-third of the participants in
the study of Jiang3 were smokers. All of the studies except for that of Frost et al.17 captured retinal images after performing pupil dilation. In three studies,17,18,20 a digital ophthalmic camera was positioned at 45° to acquire images. In all of these studies, retinal microvascular abnormalities were deter- mined by measuring the FD, tortuosity, and caliber. The reti- nal vascular caliber was measured using the Singapore I Vessel Assessment method,21 and caliber data were summa- rized into CRAE and CRVE by using Knudtson et al.22 revised formulas. The vascular tortuosity of retinal arterioles and ve- nules was calculated as a ratio of the integral of the curvature squared along the path of the vessel relative to the total path length.23 FD was calculated using the box-counting method to represent the complexity of a skeletonized retinal arteriole and venule network, which represents a ‘global’ measure sum- marizing the entire branching pattern of the retinal vascular tree.24 The risk factors (additional adjustments) were vascu- lar diseases, reflecting that some participants have vascular problems of different intensities. Table 1 provides a detailed description of all of the features included in these studies.
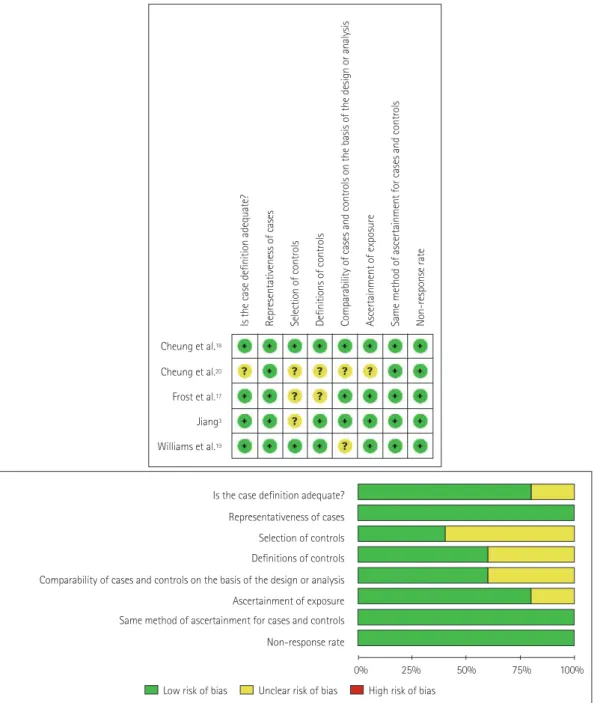
Quality of included studies
The methodological quality of the included studies is graph- ically demonstrated in Fig. 2. The representativeness of cases as well as the method of ascertainment for cases and con- trols were quality controlled in the included studies. The defini- tion and selection of the controls were only vaguely described for some of the included studies, and the ascertainment of ex- posure for cases and controls might have been opaque in some of the studies. In general, the overall quality of the included
1,667 of records indentified through database searching
155 articles which were duplicated were
removed
1,489 records which were irrevelent and low-quality
were excluded 1,512 records
were screened
23 of full-text articles assessed
for eligibility
5 of studies included in quantitative synthesis
(meta-analysis)
18 of full-text articles excluded for insufficient data
Fig. 1. Flow chart of included and excluded studies.
Retinal Vascular Changes and Cognitive Impairment
JCN
Table 1. Characteristics of the included studies Study (year)
Sample size (number)
Age (years)*Ethnic groupMale (%)*Smoking (%)*Hypertension (%)*DM (%)*Pre-existing eye diseasesStudy designPhotograph MeasuresCognitive diagnosis and outcome
Risk factors (additional adjustments)DevicesMethod Cheung et al.18 (2014)
42674.77±5.69 (73.87±4.61)Asian47 (53)8.8 (11.4)76.5 (60.6)42.6 (24.8)No cataractCross- sectional45° Canon CR-Dgi 10D/CR-1 40D
SIVA3.0 after dilation
CRAE, CRVE, FD, tortuosity
DSM-IV criteria AD NINDS-ADRDA criteria, AMT Outcome: NS
Vascular risk factors, hypercholesterolemia, ethnicity, history of myocardial infarction, history of cerebrovascular disease Jiang et al.3 (2015)
6062.22±5.00 (67.22±6.73)Asian60.87 (27.03)34.78 (35.14)56.52 (81.08)30.43 (29.73)NSCross- sectionalColor fundus camera
After dilationCRAE, CRVE, AT, VT, FDMMSE MoCA CDR ADL RAVLT TMT-B DSST VF Outcome: MMSE: 25.7± 1.88 vs. 28.87±2.07 (cases vs. controls), MoCA: 22.57±1.91 vs. 27.70±1.02* CDR: 0.5 vs. 0*
Vascular risk factors Cheung et al.20 (2014)
1,20270.57±5.42 (67.89±5.27)Asian21.4 (58.9)9.7 (16.3)90.1 (85.7)30.2 (32.6)NSCross- sectional45° Canon CR-Dgi with a 10D SLR digital camera back
SIVA1.0 after dilation
FD, tortuosity, branching angle, caliber
AMT Outcome: Cases: AMT score≤6/10 (with 0-6 yrs of formal education) or ≤8/10 (those with more than 6 yrs formal educa- tion)
Cardiovascular risk factors Williams et al.19 (2016)
50779.6±7.8 (76.3±6.6)Caucasian36 (40)7 (5)38 (42)9 (11)No ophthalmic history
Cross- sectional 500 Canon CR-DgiOD centered, SIVA 3.0 after dilation
CRAE, CRVE, FD, tortuosity, branching angle
NINDS-ADRDA criteria, MMSE Outcome: Controls: MMSE score more than 26 of 30
Vascular risk factors medications with a cohort frequency greater than 5% Frost et al.17 (2013)
14872.4±7.5 (71.6±5.6)Caucasian48 (45)8 (4)44 (36)8 (5)No history of glaucoma, cataract or DR
Cross- sectional45° Canon CR-1 non- mydriatic
OD centered, SIVA
CRAE, CRVE, FD, tortuosity
NINDS-ADRDA criteria, PET Outcome: NS
Vascular risk factors, ApoE
*Data are cases vs. controls values. AMT
: Abbreviated Mental Test, AT: arteriolar tortuosity, CDR: clinical dementia rating, DR: diabetic retinopathy, DSM: Diagnostic and Statistical Manual of Mental Disorders, FD: fractal dimension, MMSE: Mini-Mental State Examination, MoCA: Montreal Cognitive assessment, NINDS-ADRDA: National Institute of Neurological and Communicative Disorders and Stroke and the Alzheimer’s Disease and Re- lated Disorders Association, NS: no specified, OD: optic disc, VT: venular tortuosity.
Wu H et al.
JCN
studies indicated a low risk of bias, although for some the risk of bias was unclear.
Association between retinal vascular caliber and cognitive impairment
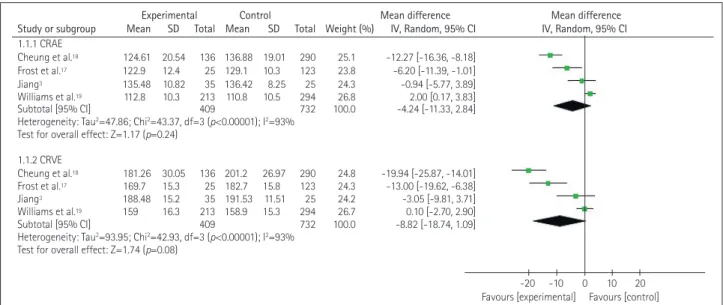
The forest plot in Fig. 3 depicts the association between cog- nitive impairment and CRAE or CRVE. In four studies3,17-19 there was a considerable heterogeneity between the controls and the patients with cognitive impairment (p<0.0001, I2= 93%), with MD total-effect values of -4.24 (95% CI: -11.33, 2.84) and -8.82 (95% CI: -18.74, 1.09), respectively. The Z val- ues for CRAE and CRVE were 1.17 (p=0.24) and 1.74 (p=0.08),
respectively. These data indicate that there was no signifi- cant association between CRAE or CRVE and cognitive im- pairment. The sensitivity analysis showed that the heteroge- neity decreased slightly when excluding one study19 while analyzing the results for CRAE and CRVE. A particularly interesting finding was that the previous reported association between CRAE and cognitive impairment remained unchanged, while a decreased CRVE was found to be related to dementia.
Association between retinal vascular tortuosity and cognitive impairment
Fig. 4 shows that there was severe heterogeneity (p<0.00001,
Cheung et al.18 Cheung et al.20 Frost et al.17 Jiang3 Williams et al.19
Is the case definition adequate? Representativeness of cases Selection of controls Definitions of controls Comparability of cases and controls on the basis of the design or analysis Ascertainment of exposure Same method of ascertainment for cases and controls Non-response rate
Is the case definition adequate?
Representativeness of cases Selection of controls Definitions of controls Comparability of cases and controls on the basis of the design or analysis
Ascertainment of exposure Same method of ascertainment for cases and controls Non-response rate
0% 25% 50% 75% 100%
Low risk of bias Unclear risk of bias High risk of bias Fig. 2. Details of the quality assessment of studies using the Newcastle-Ottawa Scale.
Retinal Vascular Changes and Cognitive Impairment
JCN
Fig. 4. Forest plot of the association between the retinal vascular tortuosity and cognitive impairment. TORa: arteriolar tortuosity, TORv: venular tor- tuosity.
Fig. 3. Forest plot of the association between the retinal vascular caliber and cognitive impairment. CRAE: central retinal arteriolar equivalents, CRVE: central retinal venular equivalents.
I²=96% or 94%) across three of the included studies.3,18,19 The MD total-effect estimates were 0.06 (95% CI: -0.07, 0.19) and 0.08 (95% CI: -0.04, 0.20), respectively. The Z values for arteriolar tortuosity (TORa) and venular tortuosity (TORv) were 0.91 (p=0.36) and 1.31 (p=0.19), respectively. These re- sults indicated that retinal vascular tortuosity was not signifi- cantly correlated with cognitive impairment. The sensitivity analysis showed that when the study of Williams et al.19 was excluded from the meta-analysis, the heterogeneity of TORa and TORv decreased from 96% and 94%, respectively, to 0%.
Furthermore, it was found that the tortuosity was greater in the patients with cognitive impairment.
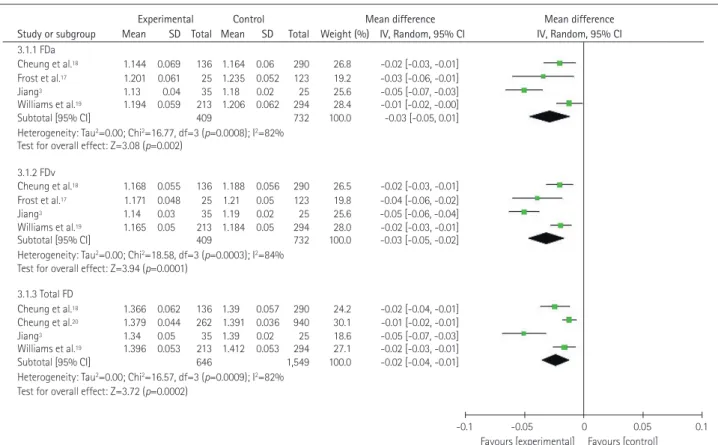
Association between retinal vascular FD and cognitive impairment
The forest plot in Fig. 5 depictsthe association between reti- nal FD and cognitive impairment. In four of the original stud- ies,3,17-19 the authors measured the arteriolar FD (FDa) and the venular FD (FDv),for which the MD total-effect values were -0.03 (95% CI: -0.05, -0.01) and -0.03 (95% CI: -0.05, -0.02), respectively, and the Z values were 3.08 (p=0.002) and 3.72 (p<0.0001), respectively. In these four selected stud- ies,3,17-19 heterogeneity was also observed in the total FD (TFD) group (p=0.0009, I2=82%). The effect value of MD was -0.02 (95% CI: -0.04, -0.01). The test for the overall TFD effect pro- duced a Z value of 3.72 (p=0.0002). These results suggest that retinal FD is related to cognitive impairment. The sensitivity
Study or subgroup Mean SD Total Mean SD Total Weight (%) IV, Random, 95% CI IV, Random, 95% CI 1.1.1 CRAE
Cheung et al.18 124.61 20.54 136 136.88 19.01 290 25.1 -12.27 [-16.36, -8.18]
Frost et al.17 122.9 12.4 25 129.1 10.3 123 23.8 -6.20 [-11.39, -1.01]
Jiang3 135.48 10.82 35 136.42 8.25 25 24.3 -0.94 [-5.77, 3.89]
Williams et al.19 112.8 10.3 213 110.8 10.5 294 26.8 2.00 [0.17, 3.83]
Subtotal [95% CI] 409 732 100.0 -4.24 [-11.33, 2.84]
Heterogeneity: Tau2=47.86; Chi2=43.37, df=3 (p<0.00001); I2=93%
Test for overall effect: Z=1.17 (p=0.24) 1.1.2 CRVE
Cheung et al.18 181.26 30.05 136 201.2 26.97 290 24.8 -19.94 [-25.87, -14.01]
Frost et al.17 169.7 15.3 25 182.7 15.8 123 24.3 -13.00 [-19.62, -6.38]
Jiang3 188.48 15.2 35 191.53 11.51 25 24.2 -3.05 [-9.81, 3.71]
Williams et al.19 159 16.3 213 158.9 15.3 294 26.7 0.10 [-2.70, 2.90]
Subtotal [95% CI] 409 732 100.0 -8.82 [-18.74, 1.09]
Heterogeneity: Tau2=93.95; Chi2=42.93, df=3 (p<0.00001); I2=93%
Test for overall effect: Z=1.74 (p=0.08)
Experimental Control Mean difference Mean difference
-20 -10 0 10 20 Favours [experimental] Favours [control]
Study or subgroup Mean SD Total Mean SD Total Weight (%) IV, Random, 95% CI IV, Random, 95% CI 2.1.1 TORa
Cheung et al.18 0.619 0.257 136 0.526 0.6 290 30.9 0.09 [0.01, 0.17]
Jiang3 0.64 0.05 35 0.51 0.04 25 35.0 0.13 [0.11, 0.15]
Williams et al.19 0.876 0.228 213 0.921 0.228 294 34.2 -0.05 [-0.09, -0.00]
Subtotal [95% CI] 384 609 100.0 0.06 [-0.07, 0.19]
Heterogeneity: Tau2=0.01; Chi2=55.07, df=2 (p<0.00001); I2=96%
Test for overall effect: Z=0.91 (p=0.36) 2.1.2 TORv
Cheung et al.18 0.813 0.306 136 0.686 0.907 290 27.8 0.13 [0.01, 0.24]
Jiang3 0.81 0.05 35 0.67 0.04 25 37.0 0.14 [0.23, 0.16]
Williams et al.19 1.016 0.276 213 1.035 0.294 294 35.2 -0.02 [-0.07, 0.03]
Subtotal [95% CI] 384 609 100.0 0.08 [-0.04, 0.20]
Heterogeneity: Tau2=0.01; Chi2=32.18, df=2 (p<0.00001); I2=94%
Test for overall effect: Z=1.31 (p=0.19)
Experimental Control Mean difference Mean difference
-0.2 -0.1 0 0.1 0.2 Favours [experimental] Favours [control]
Wu H et al.
JCN
analysis showed that when one study3 was eliminated, the heterogeneity in the FDa and TFD groups decreased to 27%
and 35%, respectively, from 82%, while in the FDv group it decreased from 84% to 35%.
Publication bias
The funnel plots produced in this study for each group showed associations between retinal vessel caliber, tortuosity, FD and cognitive impairments, and those funnel plots without out- lines were due to the use of a random-effects model (Figs. 6-8).
DISCUSSION
This study performed a meta-analysis to determine the rela- tionship between retinal vascular geometric changes and cog- nitive impairment or dementia. Our investigation of 2,343 individuals indicated that retinal vascular FD rather than caliber and tortuosity was associated with cognitive dysfunc- tion. The findings of our meta-analysis were similar to those of previous qualitative systematic reviews performed by He- ringa et al.25 and Ding et al.26 However, some of our findings are inconsistent with previously reported investigations. The Los Angeles Latino Eye Study27 found that variables related to the retinal microvasculature caliber such as CRAE and
CRVE can provide surprising insights into cognitive impair- ment in Latino populations. However, their reported data were qualitative rather than quantitative, and so could not been synthesized in our meta-analysis. A similar situation was found in the Circulatory Risk in Communities Study study,28 whose authors reported that arteriolar narrowing and overall retinal abnormalities may be used as markers to identify persons who are more likely to be affected by demen-
Study or subgroup Mean SD Total Mean SD Total Weight (%) IV, Random, 95% CI IV, Random, 95% CI 3.1.1 FDa
Cheung et al.18 1.144 0.069 136 1.164 0.06 290 26.8 -0.02 [-0.03, -0.01]
Frost et al.17 1.201 0.061 25 1.235 0.052 123 19.2 -0.03 [-0.06, -0.01]
Jiang3 1.13 0.04 35 1.18 0.02 25 25.6 -0.05 [-0.07, -0.03]
Williams et al.19 1.194 0.059 213 1.206 0.062 294 28.4 -0.01 [-0.02, -0.00]
Subtotal [95% CI] 409 732 100.0 -0.03 [-0.05, 0.01]
Heterogeneity: Tau2=0.00; Chi2=16.77, df=3 (p=0.0008); I2=82%
Test for overall effect: Z=3.08 (p=0.002) 3.1.2 FDv
Cheung et al.18 1.168 0.055 136 1.188 0.056 290 26.5 -0.02 [-0.03, -0.01]
Frost et al.17 1.171 0.048 25 1.21 0.05 123 19.8 -0.04 [-0.06, -0.02]
Jiang3 1.14 0.03 35 1.19 0.02 25 25.6 -0.05 [-0.06, -0.04]
Williams et al.19 1.165 0.05 213 1.184 0.05 294 28.0 -0.02 [-0.03, -0.01]
Subtotal [95% CI] 409 732 100.0 -0.03 [-0.05, -0.02]
Heterogeneity: Tau2=0.00; Chi2=18.58, df=3 (p=0.0003); I2=84%
Test for overall effect: Z=3.94 (p=0.0001) 3.1.3 Total FD
Cheung et al.18 1.366 0.062 136 1.39 0.057 290 24.2 -0.02 [-0.04, -0.01]
Cheung et al.20 1.379 0.044 262 1.391 0.036 940 30.1 -0.01 [-0.02, -0.01]
Jiang3 1.34 0.05 35 1.39 0.02 25 18.6 -0.05 [-0.07, -0.03]
Williams et al.19 1.396 0.053 213 1.412 0.053 294 27.1 -0.02 [-0.03, -0.01]
Subtotal [95% CI] 646 1,549 100.0 -0.02 [-0.04, -0.01]
Heterogeneity: Tau2=0.00; Chi2=16.57, df=3 (p=0.0009); I2=82%
Test for overall effect: Z=3.72 (p=0.0002)
Experimental Control Mean difference Mean difference
-0.1 -0.05 0 0.05 0.1 Favours [experimental] Favours [control]
Fig. 5. Forest plot of the association between the retinal vascular FD and cognitive impairment. FD: fractal dimension, FDa: arteriolar FD, FDv: venu- lar FD.
SE (MD)
-20 -10 0 10 20 MD
Subgroups CRAE CRVE 0
1
2
3
4
5
Fig. 6. Funnel plot of publication bias for the association between the retinal vascular caliber and cognitive impairment. CRAE: central retinal arteriolar equivalents, CRVE: central retinal venular equivalents, MD:
mean difference, SE: standard error.
Retinal Vascular Changes and Cognitive Impairment
JCN
tia. In contrast, our meta-analysis did not confirm the pres- ence of such a relationship between arteriolar narrowing and cognitive impairment. Our study mainly disclosed that patients with cognitive impairment might have a smaller vascular FD or a lower complexity of fundus microvascular networks. This is consistent with the finding of Jiang et al.29 that AD patients had sparser retinal microvascular networks than controls, in- dicating the presence of retinal microvascular dysfunction in AD individuals. Ong et al.30 also indicated that decreased FDa and FDv values were associated with cognitive impair- ment, which is in complete agreement with the results of our meta-analysis. It is also interesting that Mroczkowska et al.31 found that mild-AD patients with relatively minor cognitive impairment exhibited signs of microvascular dysfunction even in the absence of a history of significant systemic vascular dis- ease. This suggests that retinal changes are potentially useful as an early indicator of cognitive impairment.
The exact biological mechanism underling the association
between retinal FD changes and cognitive impairment re- mains unclear. We consider that there are several possible rea- sons. The branching complexity is less when FD is smaller, and so rarefaction of retinal vessels is associated with decreased FD, representing corresponding geometric changes in the cerebral microvasculature, further indicating hypoperfusion that may switch on hypoxia-induced pathways, which would increase the amyloid-beta load19,32 or tau pathology.33 All of these undesirable events would lead to the development of AD in patients. Moreover, amyloid plaques in those AD pa- tients may result in vascular damage that undermines the mi- crovasculature. The risk of cerebrovascular disease increases in patients with impaired microcirculation and decreased blood flow.34,35 which may further lead to decreased retinal FD since the retinal vasculature is an observable microcircu- lation tissue.
Our study was subject to several limitations. At the study and outcome levels, publication bias and the risk of bias may interfere with the detected outcomes. At the review level, our findings were also influenced by eligible research studies that produced incomplete retrievable results. The reliability of the results is impaired by the huge heterogeneity of data present in the selected reports. We therefore performed a sen- sitivity analysis in addition to applying a random-effects model to tackle the considerable heterogeneity. We speculated that sex and the smoking ratio did impact the results of the reti- nal FD sensitive analysis. The cerebrovascular perfusion is better in females than in males,36 and so the vascular density of males may be smaller than that of females. Smoking is a risk factor that damages vascular health and increases vas- cular stiffness,37 and thus might change the branching pattern of the retinal vasculature. For the sensitive analysis of TORa and TORv, we believed that the disparity could be attributed to the participants of this study being Caucasians, while par- ticipants of other studies were Asians; in other words, that race can influence retinal measurements. The small number of included studies made it difficult to perform subgroup analysis and a meta-regression analysis. Moreover, the con- clusions cannot be generalized since only small populations were analyzed in the included studies. The correlation be- tween the severity of cognitive impairments and the extent of retina microvascular abnormalities therefore needs further investigations to confirm the significance of a retinal imaging biomarker as a predictor for cognitive impairments.
In conclusion, a smaller retinal microvascular FD might be associated with cognitive impairment. Such a relationship could be used to establish a novel retinal image biomarker that might allow the early detection of cognitive impairment in an affordable and convenient way. Further large-sample and well-controlled original studies are required to confirm
SE (MD)
-0.2 -0.1 0 0.1 0.2 MD
Subgroups TORa TORv 0
0.02
0.04
0.06
0.08
0.1
Fig. 7. Funnel plot of publication bias for the association between the retinal vascular tortuosity and cognitive impairment. MD: mean dif- ference, SE: standard error, TORa: arteriolar tortuosity, TORv: venular tortuosity.
Fig. 8. Funnel plot of the association between the retinal vascular FD and cognitive impairment. FD: fractal dimension, FDa: arteriolar FD, FDv: venular FD, MD: mean difference, SE: standard error.
SE (MD)
-0.05 0 0.05 0.1
MD
Subgroups
FDa FDv Total FD 0
0.02
0.04
0.06
0.08
0.1-0.1
Wu H et al.
JCN
the present findings.
Author Contributions
Conceptualization: Huiqun Wu. Data curation: Chendong Wang. Formal analysis: Cong Chen, Xiaotao Xu, Yi Zhu. Funding acquisition: Huiqun Wu.
Investigation: Huiqun Wu, Chendong Wang. Methodology: Chendong Wang.
Project administration: Kui Jiang, Jiancheng Dong. Supervision: Aimin Sang. Validation: Cong Chen. Visualization: Chendong Wang. Writing—
original draft: Chendong Wang. Writing—review & editing: Huiqun Wu.
ORCID iDs
Huiqun Wu https://orcid.org/0000-0001-5837-6199 Chendong Wang https://orcid.org/0000-0002-8334-0232 Cong Chen https://orcid.org/0000-0002-2158-1217 Xiaotao Xu https://orcid.org/0000-0001-6071-2147 Yi Zhu https://orcid.org/0000-0003-0507-7042 Aimin Sang https://orcid.org/0000-0002-9669-403X Kui Jiang https://orcid.org/0000-0002-0327-7385 Jiancheng Dong https://orcid.org/0000-0002-9646-2853 Conflicts of Interest
The authors have no potential conflicts of interest to disclose.
Acknowledgements
This work was supported by the grant from National Key R&D Program of China (2018YFC1314900, 2018YFC1314902), Nantong “226 Project” and Excellent Key Teachers in the “Qing Lan Project” of Jiangsu Colleges and Universities.
REFERENCES
1. Reitz C, Brayne C, Mayeux R. Epidemiology of Alzheimer disease.
Nat Rev Neurol 2011;7:137-152.
2. Petersen RC, Roberts RO, Knopman DS, Geda YE, Cha RH, Pan- kratz VS, et al. Prevalence of mild cognitive impairment is higher in men. The Mayo Clinic Study of Aging. Neurology 2010;75:889-897.
3. Jiang YS. Retinal microvascular pathology and vascular risk factors in cognitive impairment: a cross-sectional study [dissertation]. Wuhan:
Wuhan University, 2015;1-83.
4. James BD, Leurgans SE, Hebert LE, Scherr PA, Yaffe K, Bennett DA.
Contribution of Alzheimer disease to mortality in the United States.
Neurology 2014;82:1045-1050.
5. Lesage SR, Mosley TH, Wong TY, Szklo M, Knopman D, Catellier DJ, et al. Retinal microvascular abnormalities and cognitive decline:
the ARIC 14-year follow-up study. Neurology 2009;73:862-868.
6. Kim DH, Chaves PH, Newman AB, Klein R, Sarnak MJ, Newton E, et al. Retinal microvascular signs and disability in the Cardiovascular Health Study. Arch Ophthalmol 2012;130:350-356.
7. Ikram MK, De Jong FJ, Van Dijk EJ, Prins ND, Hofman A, Breteler MM, et al. Retinal vessel diameters and cerebral small vessel disease:
the Rotterdam Scan Study. Brain 2006;129:182-188.
8. Schrijvers EM, Buitendijk GH, Ikram MK, Koudstaal PJ, Hofman A, Vingerling JR, et al. Retinopathy and risk of dementia: the Rotter- dam Study. Neurology 2012;79:365-370.
9. Kawasaki R, Cheung N, Mosley T, Islam AF, Sharrett AR, Klein R, et al. Retinal microvascular signs and 10-year risk of cerebral atrophy:
the Atherosclerosis Risk in Communities (ARIC) study. Stroke 2010;
41:1826-1828.
10. Cheung N, Mosley T, Islam A, Kawasaki R, Sharrett AR, Klein R, et al.
Retinal microvascular abnormalities and subclinical magnetic reso- nance imaging brain infarct: a prospective study. Brain 2010;133:1987- 1993.
11. Dashtbozorg B, Mendonça AM, Penas S, Campilho A. RetinaCAD, a system for the assessment of retinal vascular changes. Conf Proc IEEE
Eng Med Biol Soc 2014;2014:6328-6331.
12. Ponto KA, Werner DJ, Wiedemer L, Laubert-Reh D, Schuster AK, Nickels S, et al. Retinal vessel metrics: normative data and their use in systemic hypertension: results from the Gutenberg Health Study. J Hypertens 2017;35:1635-1645.
13. De Jong FJ, Schrijvers EM, Ikram MK, Koudstaal PJ, De Jong PT, Hofman A, et al. Retinal vascular caliber and risk of dementia: the Rotterdam study. Neurology 2011;76:816-821.
14. McKhann G, Drachman D, Folstein M, Katzman R, Price D, Stadlan EM. Clinical diagnosis of Alzheimer’s disease: report of the NINCDS- ADRDA Work Group under the auspices of Department of Health and Human Services Task Force on Alzheimer’s Disease. Neurology 1984;34:939-944.
15. Ridha B, Rossor M. The mini mental state examination. Pract Neurol 2005;5:298-303.
16. Wells G. The Newcastle-Ottawa Scale (NOS) for assessing the quality of nonrandomised studies in meta-analyses. Appl Eng Agric 2000;18:
727-734.
17. Frost S, Kanagasingam Y, Sohrabi H, Vignarajan J, Bourgeat P, Salva- do O, et al. Retinal vascular biomarkers for early detection and mon- itoring of Alzheimer’s disease. Transl Psychiatry 2013;3:e233.
18. Cheung CY, Ong YT, Ikram MK, Ong SY, Li X, Hilal S, et al. Micro- vascular network alterations in the retina of patients with Alzheim- er’s disease. Alzheimers Dement 2014;10:135-142.
19. Williams MA, McGowan AJ, Cardwell CR, Cheung CY, Craig D, Pass- more P, et al. Retinal microvascular network attenuation in Alzheim- er’s disease. Alzheimers Dement (Amst) 2015;1:229-235.
20. Cheung CY, Ong S, Ikram MK, Ong YT, Chen CP, Venketasubrama- nian N, et al. Retinal vascular fractal dimension is associated with cognitive dysfunction. J Stroke Cerebrovasc Dis 2014;23:43-50.
21. Cheung CY, Hsu W, Lee ML, Wang JJ, Mitchell P, Lau QP, et al. A new method to measure peripheral retinal vascular caliber over an extended area. Microcirculation 2010;17:495-503.
22. Knudtson MD, Lee KE, Hubbard LD, Wong TY, Klein R, Klein BE.
Revised formulas for summarizing retinal vessel diameters. Curr Eye Res 2003;27:143-149.
23. Hart WE, Goldbaum M, Côté B, Kube P, Nelson MR. Measurement and classification of retinal vascular tortuosity. Int J Med Inform 1999;
53:239-252.
24. Liew G, Wang JJ, Cheung N, Zhang YP, Hsu W, Lee ML, et al. The retinal vasculature as a fractal: methodology, reliability, and relation- ship to blood pressure. Ophthalmology 2008;115:1951-1956.
25. Heringa SM, Bouvy WH, Van den Berg E, Moll AC, Kappelle LJ, Biessels GJ. Associations between retinal microvascular changes and dementia, cognitive functioning, and brain imaging abnormalities: a systematic review. J Cereb Blood Flow Metab 2013;33:983-995.
26. Ding J, Patton N, Deary IJ, Strachan MW, Fowkes FG, Mitchell RJ, et al. Retinal microvascular abnormalities and cognitive dysfunction: a systematic review. Br J Ophthalmol 2008;92:1017-1025.
27. Gatto NM, Varma R, Torres M, Wong TY, Johnson PL, Segal-Gidan F, et al. Retinal microvascular abnormalities and cognitive function in Latino adults in Los Angeles. Ophthalmic Epidemiol 2012;19:127-136.
28. Jinnouchi H, Kitamura A, Yamagishi K, Kiyama M, Imano H, Okada T, et al. Retinal vascular changes and prospective risk of disabling de- mentia: the circulatory risk in communities study (CIRCS). J Athero- scler Thromb 2017;24:687-695.
29. Jiang H, Wei Y, Shi Y, Wright CB, Sun X, Gregori G, et al. Altered mac- ular microvasculature in mild cognitive impairment and Alzheimer disease. J Neuroophthalmol 2018;38:292-298.
30. Ong YT, Hilal S, Cheung CY, Xu X, Chen C, Venketasubramanian N, et al. Retinal vascular fractals and cognitive impairment. Dement Geri- atr Cogn Dis Extra 2014;4:305-313.
31. Mroczkowska S, Benavente-Pérez A, Patel S, Qin L, Bentham P, Gher- ghel D. Retinal vascular dysfunction relates to cognitive impairment in Alzheimer disease. Alzheimer Dis Assoc Disord 2014;28:366-367.
Retinal Vascular Changes and Cognitive Impairment
JCN
32. Sun X, He G, Qing H, Zhou W, Dobie F, Cai F, et al. Hypoxia facili- tates Alzheimer’s disease pathogenesis by up-regulating BACE1 gene expression. Proc Natl Acad Sci U S A 2006;103:18727-18732.
33. Koike MA, Garcia FG, Kitazawa M, Green KN, Laferla FM. Long term changes in phospho-APP and tau aggregation in the 3xTg-AD mice following cerebral ischemia. Neurosci Lett 2011;495:55-59.
34. Patton N, Aslam T, Macgillivray T, Pattie A, Deary IJ, Dhillon B. Ret- inal vascular image analysis as a potential screening tool for cerebro- vascular disease: a rationale based on homology between cerebral and
retinal microvasculatures. J Anat 2005;206:319-348.
35. Murray CD. The physiological principle of minimum work I. The vascular system and the cost of blood volume. Proc Natl Acad Sci U S A 1926;12:207-214.
36. Xu X, Jerskey BA, Cote DM, Walsh EG, Hassenstab JJ, Ladino ME, et al. Cerebrovascular perfusion among older adults is moderated by strength training and gender. Neurosci Lett 2014;560:26-30.
37. Wang YX, Fitch RM. Vascular stiffness: measurements, mechanisms and implications. Curr Vasc Pharmacol 2004;2:379-384.