D I A B E T E S & M E T A B O L I S M J O U R N A L D I A B E T E S & M E T A B O L I S M J O U R N A L
This is an Open Access article distributed under the terms of the Creative Commons Attribution Non-Commercial License (http://creativecommons.org/licenses/by-nc/4.0/) which permits unrestricted non-commercial use, distribution, and reproduction in any medium, provided the original work is properly cited.
An Electronic Health Record-Integrated Computerized Intravenous Insulin Infusion Protocol: Clinical
Outcomes and in Silico Adjustment
Sung Woon Park1,*, Seunghyun Lee2,*, Won Chul Cha3,4, Kyu Yeon Hur1, Jae Hyeon Kim1, Moon-Kyu Lee1, Sung-Min Park2, Sang-Man Jin1,4
1Division of Endocrinology and Metabolism, Department of Medicine, Samsung Medical Center, Sungkyunkwan University School of Medicine, Seoul,
2Department of Creative IT Engineering, Pohang University of Science and Technology (POSTECH), Pohang,
3Department of Emergency Medicine, Samsung Medical Center, Sungkyunkwan University School of Medicine, Seoul,
4Department of Digital Health, Samsung Advanced Institute for Health Sciences & Technology, Sungkyunkwan University, Seoul, Korea
Background: We aimed to describe the outcome of a computerized intravenous insulin infusion (CII) protocol integrated to the electronic health record (EHR) system and to improve the CII protocol in silico using the EHR-based predictors of the outcome.
Methods: Clinical outcomes of the patients who underwent the CII protocol between July 2016 and February 2017 and their matched controls were evaluated. In the CII protocol group (n=91), multivariable binary logistic regression analysis models were used to determine the independent associates with a delayed response (taking ≥6.0 hours for entering a glucose range of 70 to 180 mg/dL). The CII protocol was adjusted in silico according to the EHR-based parameters obtained in the first 3 hours of CII.
Results: Use of the CII protocol was associated with fewer subjects with hypoglycemia alert values (P=0.003), earlier (P=0.002), and more stable (P=0.017) achievement of a glucose range of 70 to 180 mg/dL. Initial glucose level (P=0.001), change in glucose during the first 2 hours (P=0.026), and change in insulin infusion rate during the first 3 hours (P=0.029) were independently as- sociated with delayed responses. Increasing the insulin infusion rate temporarily according to these parameters in silico signifi- cantly reduced delayed responses (P<0.0001) without hypoglycemia, especially in refractory patients.
Conclusion: Our CII protocol enabled faster and more stable glycemic control than conventional care with minimized risk of hy- poglycemia. An EHR-based adjustment was simulated to reduce delayed responses without increased incidence of hypoglycemia.
Keywords: Computer simulation; Electronic health records; Insulin; Medical records systems, computerized
Corresponding authors: Sung-Min Park https://orcid.org/0000-0002-8359-8110 Department of Creative IT Engineering, Pohang University of Science and Technology (POSTECH), 77 Cheongam-ro, Nam-gu, Pohang 37673, Korea
E-mail: sungminpark@postech.ac.kr
Sang-Man Jin https://orcid.org/0000-0001-5929-3627
Division of Endocrinology and Metabolism, Department of Medicine, Samsung Medical Center, Sungkyunkwan University School of Medicine, 81 Irwon-ro, Gangnam-gu, Seoul 06351, Korea
E-mail: sangman.jin@samsung.com
INTRODUCTION
Hyperglycemia is associated with poor prognosis and in- creased mortality in critically ill patients [1-3] and is also a strong risk factor for surgical site infection [4]. In 2001, van
den Berghe et al. [5] reported that tight glycemic control with intravenous insulin therapy in critically ill patients in a surgical intensive care unit (ICU) significantly lowered mortality. How- ever, several multicenter randomized controlled studies failed to reproduce the decreased mortality with tight glycemic target https://doi.org/10.4093/dmj.2018.0227
pISSN 2233-6079 · eISSN 2233-6087
(80 to 110 mg/dL) findings [6-8]. Consequentially, the Ameri- can Association of Clinical Endocrinologists and the Ameri- can Diabetes Association currently recommend a targeting range of 140 to 180 mg/dL in both critically and non-critically ill patients [9].
At least in part, failure of intensive insulin therapy to reduce mortality in critically ill patients has been attributed to resultant increase in hypoglycemia [10,11]. In a previous study [11], which evaluated 3,116 patients on IV insulin, almost one-third of the patients had suffered at least one episode of acute hypo- glycemia (glucose level <60 mg/dL), and over 8% had severe acute hypoglycemia (glucose level <40 mg/dL). Although sev- eral studies of computerized intravenous insulin infusion pro- tocols (CIIs) reported improved glycemic control and reduced hypoglycemia compared to paper-based protocols [12-16], most of these studies either applied the CIIs only in the ICU rather than a general ward setting, or the software required fre- quent blood glucose measurement, sometimes requested in 30 minutes, making the protocol inappropriate in the general ward of most hospitals. More importantly, most of the target glucose range of these CII protocols were lower than the recommended glucose range of 140 to 180 mg/dL, failing to achieve near- elimination of hypoglycemia in most studies [12-16].
We developed a CII protocol fully integrated into the elec- tronic health record (EHR) system for use in both the general ward and ICU, with a target glucose range of 140 to 180 mg/dL.
This was fully integrated to the insulin prescription module in the EHR, eliminating the need for an additional record of glu- cose measurement and insulin dosing. The protocol was used in all hospital units, including general wards, ICUs, and emer- gency rooms. The purpose of this study was to describe the clinical outcome of our CII protocol and to adjust the CII pro- tocol in silico using the factors independently associated with delayed target blood glucose achievement.
METHODS
The protocol of this study was approved by the Institutional Review Board (IRB) of Samsung Medical Center (IRB file No.
2017-04-036-006). Informed consent was waived by the board.
Study participants and setting
The study was conducted in an academic tertiary care facility (Samsung Medical Center, Seoul, Korea) where a CII protocol was launched in June 2016. After launching the CII protocol, it
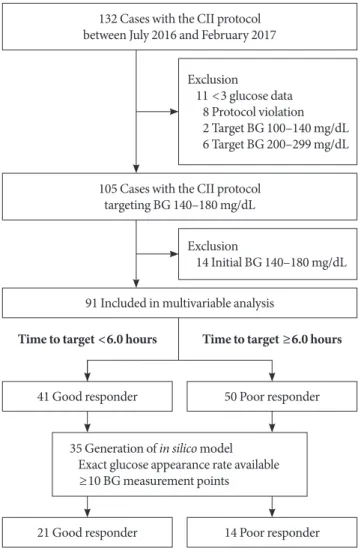
had been advised to use in the patients with various potential indications for intravenous insulin therapy [17]. In periopera- tive cases, the CII was recommended when the patients under- went prolonged fasting for major surgery and had either glyco- sylated hemoglobin >8% or random glucose of >180 mg/dL at the day before operation. The CII protocol was applied at the initiation of fasting in perioperative period. We screened the 132 cases with the CII protocol between July 2016 and February 2017. Excluding the cases with less than three glucose measure- ments (n=11) and those with violation of the protocol (n=8), a total of 113 cases were included. Study participants in which the protocol targeting blood glucose was 100 to 140 mg/dL (n=2, patients who underwent cardiovascular surgery) and 200 to 299 (n=6, patients with hyperglycemic hyperosmolar state) were also excluded, leaving only those study participants
Fig. 1. Patient disposition. CII, computerized intravenous in- sulin infusion; BG, blood glucose.
132 Cases with the CII protocol between July 2016 and February 2017
105 Cases with the CII protocol targeting BG 140–180 mg/dL
91 Included in multivariable analysis
35 Generation of in silico model Exact glucose appearance rate available
≥10 BG measurement points 41 Good responder
21 Good responder Time to target <6.0 hours
50 Poor responder
14 Poor responder Time to target ≥6.0 hours Exclusion
11 <3 glucose data 8 Protocol violation 2 Target BG 100–140 mg/dL 6 Target BG 200–299 mg/dL
Exclusion
14 Initial BG 140–180 mg/dL
who used the protocol targeting blood glucose range of 140 to 180 mg/dL (n=105) for inclusion in further analyses (Fig. 1).
For each patient who used the protocol targeting blood glu- cose range of 140 to 180 mg/dL, a control patient was randomly selected by exact and propensity score matching. Controls were exactly matched for basal glucose level (mg/dL) category at the initiation of intravenous insulin infusion (<180, 180 to 249,
≥250 mg/dL), age group (10-year interval), reason for insulin infusion (perioperative, continuous enteral feeding, diabetic ketoacidosis [DKA], fasting for other reasons), and setting of admission (ICUs vs. general wards). Controls were also matched for the propensity score generated by other matching variables such as body mass index (<25 and ≥25 kg/m2), and estimated glomerular filtration rate (<60 and ≥60 mL/min/1.73 m2).
Sixty controls were selected from the clinical database of 3,913 patients who underwent a conventional intravenous insulin infusion protocol, such as a modified version of Alberti’s regi- men, from January 2012 to June 2017 in Samsung Medical Center, Seoul, Korea.
Among the 105 cases who used the CII protocol, 91 were studied in the multivariable analysis to identify the indepen- dent variables associated with delayed achievement of target blood glucose. The other 14 cases were excluded because of be- ing within the target range from initiation of CII. The 91 cases were studied for glycemic outcomes including time required to achieve target blood glucose and percentage of time in target ranges. After determining the median time required to reach target blood glucose range using a Kaplan-Meier curve, these 91 cases were divided into good (less than median time) or poor (greater than or equal to median time) responder groups.
The cases that failed to reach target range (n=7) were included in the poor responder group.
CII protocol
The CII protocol was fully integrated into an EHR system so that no additional manipulation other than insulin prescription was required. When nurses input a patient’s current blood glu- cose level, the protocol automatically calculates insulin dose and time interval for next blood glucose check. The scheme for cal- culation of insulin dose adjustment was based on the Yale Insu- lin Infusion Protocol [18], but the target glucose range was ad- justed to 140 to 180 mg/dL instead of 100 to 140 mg/dL (Sup- plementary Table 1). Blood glucose levels were checked with conventional fingerstick glucometers. The time interval for the next blood glucose check was set at 1 hour at onset of the CII
protocol or when the previous blood glucose was not within the target range. If two consecutive blood glucoses are within the target range, the CII protocol instructs the user to increase the time interval for the next blood glucose check to 2 hours and then to 4 hours if an additional two blood glucoses are within the target range. If blood glucose is less than 70 mg/dL, the CII protocol orders immediate stoppage of insulin, initiation of 50% dextrose fluid infusion, and blood glucose recheck every 15 minutes until the blood glucose level recovers to 110 mg/dL.
If the rechecked blood glucose rises above the target, the CII automatically calculates the reduced dosage of insulin to be in- fused.
Identification of clinical and glycemic factors independently associated with time required to reach target blood glucose range
We retrospectively reviewed clinical characteristics and glyce- mic outcomes of the cases with CII protocol and their controls.
We extracted clinical information including age, sex, prior his- tory of diabetes, and reason for instituting the insulin infusion protocol and selected laboratory results from the EHR system of Samsung Medical Center.
Glycemic outcomes were compared between good and poor responder groups according to median time required to reach target blood glucose range among the 91 cases. We compared clinical characteristics and glycemic parameters between the good and poor responder groups and constructed a multivari- able analysis model to identify the factors independently asso- ciated with delayed target achievement. Clinically significant hypoglycemia was defined as blood glucose less than 54 mg/dL, and the hypoglycemic alert value was defined as blood glucose less than 70 mg/dL. We considered a blood glucose level be- tween 70 to 180 mg/dL, which has been used as a primary end- point for most clinical trials of artificial pancreas [19], as a clinically acceptable range of glucose levels. Calculated per- centage of time in a glucose range of 70 to 180 mg/dL and time required to reach a glucose range of 70 to 180 mg/dL were ana- lyzed.
In silico evaluation
To confirm whether the time to target blood glucose achieve- ment can be reduced by temporarily increasing the insulin in- fusion rate, we developed an in silico patient group from the abstracted clinical CII data and simulated the outcome accord- ing to adjustment of insulin infusion rate in in silico patients.
This adjustment was conducted in the presence of the factors found to be independently associated with delayed target achievement. Among the subjects included in the multivari- able analysis, the in silico patients were developed from 35 cas- es. Excluded patients included those with an uncertain rate of glucose appearance such as patients in which continuous en- teral feeding was applied or an evening meal was given right before initiation of the CII protocol so that uncertain glucose appearance through the gastrointestinal pathway might occur.
Also excluded were patients in whom the number of blood glucose measurement points were less than 10, having non- positive degrees of freedom. The patients whose target blood glucose was not reached during the CII periods were also ex- cluded.
The virtual patients used Van Herpe’s ICU minimal model (ICU-MM) [20] as a mathematical basis. For development, es- timation was performed on nine glucose and insulin-related model parameters including basal glycemia and basal insulin.
The ICU-MM was implemented in the Simbiology toolbox of MATLAB (R2018a; MathWorks, Natick, MA, USA) assuming the initial state to be basal. Initial parameter setting for optimi- zation was set to the mean value of the ‘obese-low glucose tol- erance patient group,’ as described in Bergman et al. [21]. Ac- tual blood glucose values were used as initial search points of basal glycemic estimation.
For simulation, the in silico patient model and CII protocols were implemented in Simulink (MATLAB R2018a). We cate- gorized each factor found to be independently associated with delayed target achievement according to the cut-off values de- termined by Youden index in receiver operator characteristics (ROC) analysis. Additional insulin was infused when each pa- rameter met the cut-off value. The insulin infusion rate was in- creased differentially according to the currently calculated in- sulin infusion rate (Supplementary Table 2).
Statistical analysis
Descriptive data are shown as mean±standard deviation or median with interquartile range. Student’s t-test, Mann-Whit- ney test, chi-square test, or Fisher’s exact test were used in uni- variable analysis as appropriate. Paired t-test, Wilcoxon signed rank test, or McNemar’s test was used to compare the CII pro- tocol cases and their matched controls as appropriate. Kaplan- Meier analysis was used to determine the median time re- quired to reach the target blood glucose range. Multivariable binary logistic regression analysis (forward stepwise selection)
was performed with the factors for which the P value was less than 0.2 in univariable analysis. Paired t-test was used to com- pare the time required to achieve a glucose range of 70 to 180 mg/dL before and after in silico adjustment of insulin infusion rate. Statistical analyses were performed with SPSS version 25 (IBM Co., Armonk, NY, USA) and R 3.4.3 (R Foundation for Statistical Computing, Vienna, Austria).
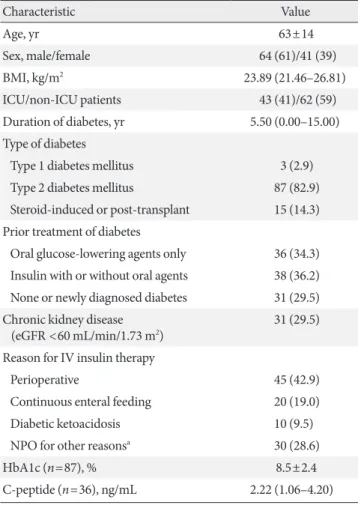
Table 1. Baseline characteristics of all the cases of the comput- erized intravenous insulin infusion protocol targeting blood glucose 140 to 180 mg/dL (n=105)
Characteristic Value
Age, yr 63±14
Sex, male/female 64 (61)/41 (39)
BMI, kg/m2 23.89 (21.46–26.81)
ICU/non-ICU patients 43 (41)/62 (59)
Duration of diabetes, yr 5.50 (0.00–15.00) Type of diabetes
Type 1 diabetes mellitus 3 (2.9)
Type 2 diabetes mellitus 87 (82.9)
Steroid-induced or post-transplant 15 (14.3) Prior treatment of diabetes
Oral glucose-lowering agents only 36 (34.3) Insulin with or without oral agents 38 (36.2) None or newly diagnosed diabetes 31 (29.5) Chronic kidney disease
(eGFR <60 mL/min/1.73 m2) 31 (29.5) Reason for IV insulin therapy
Perioperative 45 (42.9)
Continuous enteral feeding 20 (19.0)
Diabetic ketoacidosis 10 (9.5)
NPO for other reasonsa 30 (28.6)
HbA1c (n=87), % 8.5±2.4
C-peptide (n=36), ng/mL 2.22 (1.06–4.20) Values are presented as mean±standard deviation, number (%), or median (interquartile range).
BMI, body mass index; ICU, intensive care unit; eGFR, estimated glo- merular filtration rate; IV, intravenous; NPO, nil per os; HbA1c, glyco- sylated hemoglobin.
aGastrointestinal bleeding (n=7), uncontrolled hyperglycemia (n=7), acute pancreatitis (n=2), intubation state (n=2), aspiration pneumo- nia (n=2), severe sepsis or septic shock (n=2), altered mentality (n=3), acute cholecystitis (n=1), diabetes gastropathy (n=1), peri- tonsilar abscess (n=1), for esophagogastroduodenoscopy (n=1), after total pancreatectomy (n=1).
RESULTS
Clinical characteristics of and glycemic outcomes in each subject group
The baseline characteristics of all the subjects who used the CII protocol targeting a blood glucose range of 140 to 180 mg/dL (n=105) are shown in Table 1. ICU patients accounted for 40.9% of cases with the CII protocol. The most common rea- son for use of the CII protocol was fasting in the perioperative period. In the 105 total patients, two cases with hypoglycemic alert value (glucose level <70 mg/dL) were reported. One case was due to sudden discontinuation of enteral feeding without adjustment of insulin infusion rate. The other case showed a blood glucose level of 69 mg/dL and successfully recovered to the target blood glucose range in 23 minutes with an automat-
ed algorithm for hypoglycemia in the CII protocol. No clini- cally significant hypoglycemia (glucose level <54 mg/dL) was reported in these patients. All of the 10 subjects who used the CII protocol for managing DKA were fully recovered from aci- demia and met the criteria for transition to subcutaneous insu- lin therapy (glucose <200 mg/dL and two of the following; se- rum bicarbonate ≥15 mEq/L, venous pH >7.3, and anion gap
≤12 mEq/L) at the end of the CII protocol.
Among the 105 subjects who used the CII protocol, 60 pa- tients whose matched controls were available were included in the case-control analysis (Supplementary Table 3). Use of the CII protocol was associated with fewer subjects with hypogly- cemia alert values (1 case vs. 12 cases in cases and controls, P=0.003), earlier achievement of a glucose range of 70 to 180 mg/dL (6.0 hours vs. 10.0 hours, P=0.002), and greater per- Table 2. Clinical characteristics of the good and poor responders in cases using the computerized insulin infusion protocol ac- cording to time required to achieve a glucose range of 70 to 180 mg/dL
Characteristic Good responder: <6.0 hr (n=41) Poor responder: ≥6.0 hr (n=50) P value
Age, yr 68.00 (55.00–76.50) 66.00 (52.75–72.50) 0.435
Sex, male/female 24 (58.5)/17(41.5) 33 (66.0)/17 (34.0) 0.464
ICU/non-ICU patients 13 (31.7)/28 (68.3) 28 (56.0)/22 (44.0) 0.020
BMI, kg/m2 24.20 (20.96–25.84) 23.67 (21.05–26.95) 0.646
Prior diagnosis of diabetes 32 (78.0) 32 (64.0) 0.144
Duration of diabetes 5.50 (0.25–18.50) 4.00 (0.00–12.25) 0.259
Type of diabetes 0.549
Type 1 diabetes mellitus 1 (2.4) 2 (4.0)
Type 2 diabetes mellitus 35 (85.4) 38 (76.0)
Steroid-induced diabetes 5 (12.2) 10 (20.0)
Prior treatment for diabetes 0.005
Oral agents only 19 (46.3) 9 (18.0)
Insulin±oral agents 14 (34.1) 18 (36.0)
None 8 (19.5) 23 (46.0)
Chronic kidney disease (eGFR <60 mL/min/1.73 m2) 13 (31.7) 15 (30.0) 0.861
Reason for insulin infusion 0.002
NPO for operation 23 (56.1) 9 (18.0)
Continuous enteral feeding 7 (17.1) 13 (26.0)
Diabetic ketoacidosis 2 (4.9) 7 (14.0)
NPO for other cause 9 (22.0) 21(42.0)
HbA1c, % 8.21±2.38 8.51±2.35 0.585
C-peptide, ng/mL 2.14 (1.78–3.59) (n=7) 2.44 (1.09–4.56) (n=24) 1.000
Values are presented as median (interquartile range), number (%), or mean±standard deviation.
ICU, intensive care unit; BMI, body mass index; eGFR, estimated glomerular filtration rate; NPO, nil per os; HbA1c, glycosylated hemoglobin.
centage of time in a glucose range of 70 to 180 mg/dL in over- all (62.72±27.19 vs. 52.57±25.67, P=0.017), and greater per- centage of time in a glucose range of 70 to 180 mg/dL after en- tering a glucose range of 70 to 180 mg/dL (81.25±21.70 vs.
68.09±25.78, P=0.002) (Supplementary Table 4). No patients
in the cases, but two patients in controls, had clinically signifi- cant hypoglycemia (glucose level <54 mg/dL).
In the 105 subjects who used the CII protocol, the median time required to achieve a glucose range of 70 to 180 mg/dL was 6.0 hours. The cases that took less than 6.0 hours were clas-
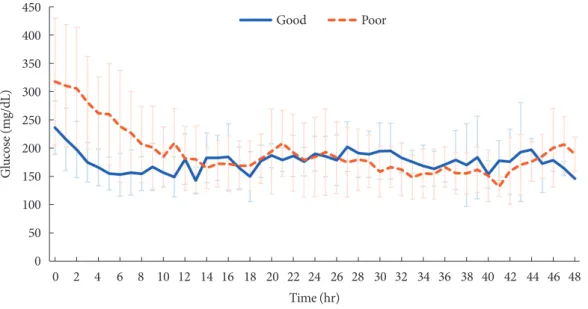
Fig. 2. The mean glucose levels and insulin doses in good and poor responder groups of the cases using the computerized intrave- nous insulin infusion protocol during the 48 hours of intravenous insulin infusion. (A) Mean glucose level versus time mapped hourly for the initial 48 hours. (B) Insulin doses versus time mapped hourly for the initial 48 hours. Error bars indicate interquartile range. Numbers below each panel indicate the number of subjects for each time point. In panel B, the insulin infusion rates of good responders include data of a case in which insulin infusion at a rate of 8 to 10 U/hr was abruptly stopped at 44th hour.
450 400 350 300 250 200 150 100 50 0
8 7 6 5 4 3 2 1 0 Glucose (mg/dL) Insulin (U/hr)
0 2 4 6 8 10 12 14 16 18 20 22 24 26 28 30 32 34 36 38 40 42 44 46 48
0 2 4 6 8 10 12 14 16 18 20 22 24 26 28 30 32 34 36 38 40 42 44 46 48 Time (hr)
Time (hr)
41 35 38 33 32 28 27 19 19 16 17 9 11 7 12 15 6 10 5 7 6 10 5 9 7 9 9 8 6 9 8 7 8 9 5 8 7 7 5 5 6 5 6 4 2 2 2 2 1
41 41 41 41 41 39 37 34 32 30 28 25 21 21 20 20 17 16 16 16 16 16 15 15 15 14 14 13 13 12 12 11 11 10 10 10 10 10 9 9 9 9 8 5 4 4 4 3 3 Good (n)
Good (n) Poor (n)
Poor (n)
50 40 37 42 34 37 41 36 33 29 29 26 24 28 22 21 15 21 17 20 16 18 22 21 21 19 22 16 18 18 14 13 14 14 14 17 12 11 13 11 12 7 9 11 9 6 6 4 3
50 50 50 50 48 48 48 48 46 45 41 41 40 38 36 34 32 32 31 31 31 30 30 29 28 27 27 25 25 24 24 23 23 23 21 21 21 21 20 20 19 19 18 16 15 14 14 14 13
Good
Good
Poor
Poor
A
B
sified as a good responder group, and the cases that took 6.0 or more hours or those could not reach target range were classi- fied as a poor responder group. The clinical characteristics of the two groups are compared in Table 2. The poor responders included more ICU patients (56.0% vs. 31.7%, P=0.02) and more patients with no prior treatment or newly diagnosed dia- betes (46% vs. 19.5%, P=0.005). Although the good respond- ers showed higher percentage of time in a glucose range of 70 to 180 mg/dL than poor responder group in overall (64.09±
23.41 vs. 38.77±23.54, P=0.000), the % time in a glucose range of 70 to 180 mg/dL was not significantly different between groups after achieving a glucose range of 70 to 180 mg/dL (Supplementary Table 5). Although mean glucose levels were similar between groups after achieving a glucose range of 70 to 180 mg/dL, glucose levels of good responder group decreased rapidly in first few hours while those of poor responder group decreased slowly in first 2 hours with higher baseline glucose levels. The insulin requirement of poor responder group con- tinuously increased during the first 5 hours, whereas the insu- lin requirement decreased in good responder group (Fig. 2).
Factors independently associated with poor responder group
To find factors independently associated with poor responder group, we constructed multivariable analysis models including clinical and glycemic parameters as covariates. In multivariable analysis model 1, the factors that could be determined at the initiation of the protocol were included. The covariates includ- ed the initial blood glucose level and other clinical factors such as age, sex, ICU or non-ICU patients, prior treatment for dia- betes, and reason for insulin therapy. Among the covariates, initial blood glucose level and prior treatment for diabetes were selected by forward stepwise variable selection (Table 3).
In multivariable model 2, we added the glycemic parameters that can be obtained within 3 hours after initiation of the CII protocol. The final model included initial blood glucose (odds ratio [OR], 1.027; 95% confidence interval [CI], 1.011 to 1.043), blood glucose change in first 2 hours (OR, 1.019; 95%
CI, 1.002 to 1.036), and change in insulin infusion rate in first 3 hours (OR, 1.747; 95% CI, 1.058 to 2.885) (Table 3).
In silico improvement of the CII protocol by automatic adjustments
Based on the cut-off values determined by ROC analysis, addi- tional insulin infusion was applied when any of the following
conditions was met: (1) initial blood glucose was greater than or equal to 233 mg/dL; (2) decrease in blood glucose was less than or equal to 6 mg/dL at 2 hours; or (3) decrease in insulin infusion rate at 3 hours was less than or equal to 0.5 U/hr. Sim- ulation was performed in the 35 in silico patients. Before addi- tional insulin infusion was performed, 21 and 14 subjects were in the good and poor responder groups, respectively.
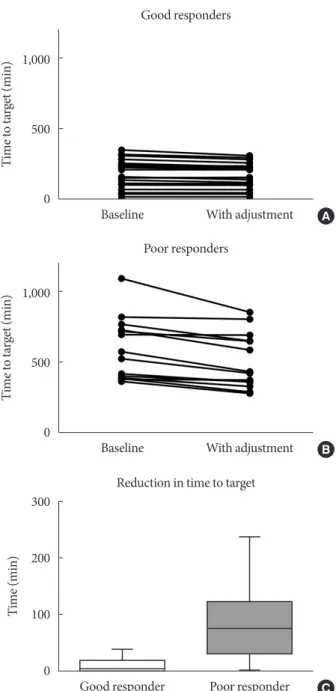
Additional insulin infusion at the early glycemic predicting points resulted in a significant reduction in median time re- quired to achieve a glucose range of 70 to 180 mg/dL (286 to 261 minutes) overall (P<0.0001 for paired t-test). The median time required to achieve a glucose range of 70 to 180 mg/dL was changed from 213 minutes (range, 22 to 352 minutes) to 213 minutes (range, 22 to 312 minutes) in the good responder group (P=0.0004 for paired t-test), and from 549.5 minutes (range, 365 to 1,089 minutes) to 428.5 minutes (range, 281 to 852 minutes) in the poor responder group (P=0.0003 for paired t-test), with a significantly greater reduction in time to achieve a glucose range of 70 to 180 mg/dL in poor responder group (P=0.0005). This resulted in reclassification of three subjects into the good responder group (Fig. 3). In this simula- tion, additional insulin infusion did not cause any hypoglyce- mic events (blood glucose <70 mg/dL).
Table 3. Factors independently associated with delayed achieve- ment of a glucose range of 70 to 180 mg/dL
Factor Adjusted odds ratio
(95% CI) P value Model 1
Initial blood glucose 1.017 (1.007–1.027) 0.001 Prior treatment for diabetes
Oral agents only Reference
Insulin±oral agents 2.355 (0.708–7.837) 0.163
None 6.751 (1.924–23.681) 0.003
Model 2
Initial blood glucose 1.027 (1.011–1.043) 0.001 C hange in blood glucose level
at 2 hr (blood glucose at 2 hr–
initial blood glucose)
1.019 (1.002–1.036) 0.026
C hange in insulin infusion rate from baseline at 3 hr (insulin infusion rate at 3 hr–initial insulin infusion rate)
1.747 (1.058–2.885) 0.029
CI, confidence interval.
DISCUSSION
This study describes the clinical outcome of a fully EHR-inte- grated CII protocol that enabled faster and more stable glyce-
mic control than conventional care with minimized risk of hy- poglycemia. The convenience achieved by full integration to EHR allows application of this CII protocol in both critical and non-critical care settings. Furthermore, an automatic adjust- ment taking advantage of the fully EHR-integrated feature sig- nificantly improved the time required to achieve target glucose level in our in silico simulation without increased incidence of hypoglycemia.
The low proportions of patients with hypoglycemia alert val- ue (two of 105 patients) and absence of clinically significant hypoglycemia in our study population are distinguishing as- pects of our CII protocol from previous CII protocol reports.
Subsequent case-control analysis (n=60) also showed fewer proportion of the subjects with hypoglycemia alert values, and better quality of glycemic control in terms of earlier achieve- ment of euglycemia and greater percent time in a glucose range of 70-180 mg/dL in the subjects who used the CII proto- col. Several previous studies have demonstrated lower mean glucose level and fewer hypoglycemic patients managed by CII protocols than those of paper-based protocol controls [12,14- 16,18,22,23]. Recently, Marvin et al. [24] compared the out- come of several CII protocols having different target blood glucose ranges of 100 to 139, 120 to 140, and 140 mg/dL as a fixed threshold. The proportion of protocol use period with hypoglycemia alert values (glucose <70 mg/dL) was 17.2%, 7.56%, and 5.8%, respectively. After their protocol was modi- fied to include the addition of mid-protocol bolus insulin, the proportion was reduced to 0.095% [24]. However, the modi- fied protocol required additional workload including hourly blood glucose checks and additional bolus doses of insulin, which are difficult to institute in settings outside of the ICU [24]. The CII protocol in our study adopted a higher target blood glucose range (140 to 180 mg/dL) than the previous studies, while allowing blood glucose check intervals no less than 1 hour and up to 2 to 4 hours after blood glucose stabili- zation. Therefore, caregiver workload was substantially re- duced after entering euglycemia, and specialized equipment or continuous glucose monitoring was not required. Although 40.9% of our study population was in critical care setting, clini- cally significant hypoglycemia was absent even in ICU pa- tients, in contrast to the findings of the previous studies con- ducted in ICU showing higher rate of hypoglycemia [12,14- 16,18,22,23] but consistent with a recent preliminary report of a bedside computerized decision-support tool targeting the blood glucose range of 140 to 180 mg/dL in mixed ICU [25].
Fig. 3. Distribution of the time required to reach the target ranges with the computerized intravenous insulin infusion (CII) protocol and additional insulin infusion at early glycemic predicting points. (A) Good responder group. (B) Poor re- sponder group. (C) Reduction in time required to reach a glu- cose range of 70 to 180 mg/dL. Box and whisker plots indicate median, interquartile range, and range.
1,000
500
0
Time to target (min)
Baseline With adjustment Good responders
A
1,000
500
0
Time to target (min)
Baseline With adjustment Poor responders
B
300
200
100
0
Time (min)
Good responder Poor responder Reduction in time to target
C
Although elimination of perioperative hypoglycemia has been also achieved with artificial pancreas systems even with lower blood glucose target [26-29], use of these systems in critical care settings with decreased blood perfusion would require special- ized equipment and continuous peripheral blood sampling.
In this study, the median time required to enter a blood glu- cose range of 70 to 180 mg/dL was 6 hours. Because entering euglycemia in 6 hours might secure 12 to 18 hours duration of euglycemia before operation if the patients were admitted the day before the operation, we grouped the cases with the CII pro- tocol into good and poor responders according to whether the time required to enter a blood glucose range of 70 to 180 mg/dL was less than 6 hours. We also found that the most distinct dif- ferences of changes in glucose levels and insulin requirement over time between good and poor responders were obtained during the first 2 to 3 hours, but it became stable after the glu- cose levels entered the range of 70 to 180 mg/dL except in only a few patients with exceptionally long duration of using the CII protocol. Therefore, we focused on reducing the time required for achievement of a glucose range of 70 to 180 mg/dL through automatic adjustment based on the information gathered in the first 2 to 3 hours of CII. To improve our CII protocol, we started with identifying several clinical and glycemic factors related to delayed achievement of target glucose range through multivariable analyses. Among the covariates available at initi- ation of the CII, ‘no prior treatment for diabetes’ was an inde- pendent risk factor for the poor response. This is in line with the previous reports that inpatient hyperglycemia without pri- or diagnosis of diabetes, commonly from the stress and highly catabolic status, is associated with the highest risk for periop- erative complications [30]. When we constructed Model 2 in this study by adding the covariates from glycemic factors dur- ing the first 3 hours of CII to the clinical covariates, all of the chosen covariates were glycemic factors rather than the clinical factors.
Indeed, in our in silico simulation, we found that temporarily increasing insulin infusion rate based on the glycemic factors found in Model 2 shortened the time required to achieve a glu- cose range of 70 to 180 mg/dL. More prominent reduction in the time to achievement of a glucose range of 70 to 180 mg/dL was observed in the poor responder group. Importantly, such an improved outcome was achieved without causing hypoglyce- mia in the CII simulation. These results indicate that delayed achievement of target blood glucose in this CII protocol, pre- sumably due to the relatively high target blood glucose range,
could be individually prevented. In clinical settings where a CII protocol is available and adjustable, prevention could be achieved by applying a simple calculation based on the vari- ables available in the first 3 hours of the CII. Alternatively, when CII protocols are not available, it could be practically suggested that increasing insulin infusion rate when the patients have a high glucose level (greater than or equal to 233 mg/dL) along with slow progress in lowering glucose levels and insulin re- quirement could be an option for rapid glucose stabilization.
We recognize limitations in this study. This was a single cen- ter study with a limited number of cases because the CII proto- col was recently launched; a limited number of patients had sufficient numbers of blood glucose measurements required for generation of an in silico model. Further study with a large number of qualified in silico patients and an actual clinical trial will enable development of a more optimized CII protocol for generalized use.
In conclusion, our EHR-integrated CII protocol successfully maintained target glucose level with minimized risk of hypo- glycemia. We identified parameters available during the first 3 hours of CII that were independently associated with delayed target achievement and used these parameters in this CII to shorten the time required for target blood glucose achieve- ment in our in silico patients.
SUPPLEMENTARY MATERIALS
Supplementary materials related to this article can be found online at https://doi.org/10.4093/dmj.2018.0227.
CONFLICTS OF INTEREST
No potential conflict of interest relevant to this article was re- ported.
AUTHOR CONTRIBUTIONS
Conception or design: S.M.P., S.M.J.
Acquisition, analysis, or interpretation of data: S.W.P., S.L., S.M.P., S.M.J.
Critical review of the manuscript: W.C.C., K.Y.H., J.H.K., M.K.L., S.M.P., S.M.J.
Drafting the work or revising: S.W.P., S.L., S.M.P., S.M.J.
Final approval of the manuscript: S.W.P., S.L., W.C.C., K.Y.H., J.H.K., M.K.L., S.M.P., S.M.J.
ORCID
Sung Woon Park https://orcid.org/0000-0002-7700-2819 Seunghyun Lee https://orcid.org/0000-0002-7751-0450 Sung-Min Park https://orcid.org/0000-0002-8359-8110 Sang-Man Jin https://orcid.org/0000-0001-5929-3627
ACKNOWLEDGMENTS
We thank the Department of Bio Statistics, Samsung Medical Center for assistance with statistical analysis including exact and propensity score matching. This research was supported by the MSIT (Ministry of Science and ICT), Korea, under the ICT Consilience Creative program (IITP-2019-2011-1-00783) su- pervised by the IITP (Institute for Information & communica- tions Technology Planning & Evaluation). This research was also supported by the Technology Innovation Program (or Industrial Strategic Technology Development Program (20001841; Devel- opment of System for Intelligent ContextAware Wearable Ser- vice based on Machine Learning) funded by the Ministry of Trade, Industry & Energy (MOTIE, Sejong, Korea).
REFERENCES
1. Falciglia M, Freyberg RW, Almenoff PL, D’Alessio DA, Render ML. Hyperglycemia-related mortality in critically ill patients varies with admission diagnosis. Crit Care Med 2009;37:3001- 9.
2. Norhammar AM, Ryden L, Malmberg K. Admission plasma glucose. Independent risk factor for long-term prognosis after myocardial infarction even in nondiabetic patients. Diabetes Care 1999;22:1827-31.
3. Yendamuri S, Fulda GJ, Tinkoff GH. Admission hyperglycemia as a prognostic indicator in trauma. J Trauma 2003;55:33-8.
4. Golden SH, Peart-Vigilance C, Kao WH, Brancati FL. Periop- erative glycemic control and the risk of infectious complica- tions in a cohort of adults with diabetes. Diabetes Care 1999;22:
1408-14.
5. van den Berghe G, Wouters P, Weekers F, Verwaest C, Bruy- ninckx F, Schetz M, Vlasselaers D, Ferdinande P, Lauwers P, Bouillon R. Intensive insulin therapy in critically ill patients. N Engl J Med 2001;345:1359-67.
6. Brunkhorst FM, Engel C, Bloos F, Meier-Hellmann A, Ragaller M, Weiler N, Moerer O, Gruendling M, Oppert M, Grond S, Olthoff D, Jaschinski U, John S, Rossaint R, Welte T, Schaefer
M, Kern P, Kuhnt E, Kiehntopf M, Hartog C, Natanson C, Loeffler M, Reinhart K; German Competence Network Sepsis (SepNet). Intensive insulin therapy and pentastarch resuscita- tion in severe sepsis. N Engl J Med 2008;358:125-39.
7. NICE-SUGAR Study Investigators, Finfer S, Chittock DR, Su SY, Blair D, Foster D, Dhingra V, Bellomo R, Cook D, Dodek P, Henderson WR, Hebert PC, Heritier S, Heyland DK, McAr- thur C, McDonald E, Mitchell I, Myburgh JA, Norton R, Potter J, Robinson BG, Ronco JJ. Intensive versus conventional glu- cose control in critically ill patients. N Engl J Med 2009;360:
1283-97.
8. Preiser JC, Devos P, Ruiz-Santana S, Melot C, Annane D, Groeneveld J, Iapichino G, Leverve X, Nitenberg G, Singer P, Wernerman J, Joannidis M, Stecher A, Chiolero R. A prospec- tive randomised multi-centre controlled trial on tight glucose control by intensive insulin therapy in adult intensive care units: the Glucontrol study. Intensive Care Med 2009;35:1738- 48.
9. Moghissi ES, Korytkowski MT, DiNardo M, Einhorn D, Hell- man R, Hirsch IB, Inzucchi SE, Ismail-Beigi F, Kirkman MS, Umpierrez GE; American Association of Clinical Endocrinol- ogists, American Diabetes Association. American Association of Clinical Endocrinologists and American Diabetes Associa- tion consensus statement on inpatient glycemic control. En- docr Pract 2009;15:353-69.
10. Wilson M, Weinreb J, Hoo GW. Intensive insulin therapy in critical care: a review of 12 protocols. Diabetes Care 2007;30:
1005-11.
11. Zhang Y. Predicting occurrences of acute hypoglycemia during insulin therapy in the intensive care unit. Conf Proc IEEE Eng Med Biol Soc 2008;2008:3297-300.
12. Boord JB, Sharifi M, Greevy RA, Griffin MR, Lee VK, Webb TA, May ME, Waitman LR, May AK, Miller RA. Computer- based insulin infusion protocol improves glycemia control over manual protocol. J Am Med Inform Assoc 2007;14:278-87.
13. Davidson PC, Steed RD, Bode BW. Glucommander: a comput- er-directed intravenous insulin system shown to be safe, sim- ple, and effective in 120,618 h of operation. Diabetes Care 2005;
28:2418-23.
14. Dortch MJ, Mowery NT, Ozdas A, Dossett L, Cao H, Collier B, Holder G, Miller RA, May AK. A computerized insulin infusion titration protocol improves glucose control with less hypoglyce- mia compared to a manual titration protocol in a trauma inten- sive care unit. JPEN J Parenter Enteral Nutr 2008;32:18-27.
15. Newton CA, Smiley D, Bode BW, Kitabchi AE, Davidson PC,
Jacobs S, Steed RD, Stentz F, Peng L, Mulligan P, Freire AX, Temponi A, Umpierrez GE. A comparison study of continuous insulin infusion protocols in the medical intensive care unit:
computer-guided vs. standard column-based algorithms. J Hosp Med 2010;5:432-7.
16. Saur NM, Kongable GL, Holewinski S, O’Brien K, Nasraway SA Jr. Software-guided insulin dosing: tight glycemic control and decreased glycemic derangements in critically ill patients.
Mayo Clin Proc 2013;88:920-9.
17. Kelly JL. Continuous insulin infusion: when, where, and how?
Diabetes Spectr 2014;27:218-23.
18. Marvin MR, Inzucchi SE, Besterman BJ. Computerization of the Yale insulin infusion protocol and potential insights into causes of hypoglycemia with intravenous insulin. Diabetes Technol Ther 2013;15:246-52.
19. Maahs DM, Buckingham BA, Castle JR, Cinar A, Damiano ER, Dassau E, DeVries JH, Doyle FJ 3rd, Griffen SC, Haidar A, Heinemann L, Hovorka R, Jones TW, Kollman C, Kovatchev B, Levy BL, Nimri R, O’Neal DN, Philip M, Renard E, Russell SJ, Weinzimer SA, Zisser H, Lum JW. Outcome measures for arti- ficial pancreas clinical trials: a consensus report. Diabetes Care 2016;39:1175-9.
20. Van Herpe T, Pluymers B, Espinoza M, Van den Berghe G, De Moor B. A minimal model for glycemia control in critically ill patients. Conf Proc IEEE Eng Med Biol Soc 2006;1:5432-5.
21. Bergman RN, Phillips LS, Cobelli C. Physiologic evaluation of factors controlling glucose tolerance in man: measurement of insulin sensitivity and beta-cell glucose sensitivity from the re- sponse to intravenous glucose. J Clin Invest 1981;68:1456-67.
22. Juneja R, Roudebush CP, Nasraway SA, Golas AA, Jacobi J, Carroll J, Nelson D, Abad VJ, Flanders SJ. Computerized inten- sive insulin dosing can mitigate hypoglycemia and achieve tight glycemic control when glucose measurement is per- formed frequently and on time. Crit Care 2009;13:R163.
23. Dumont C, Bourguignon C. Effect of a computerized insulin
dose calculator on the process of glycemic control. Am J Crit Care 2012;21:106-15.
24. Marvin MR, Inzucchi SE, Besterman BJ. Minimization of hy- poglycemia as an adverse event during insulin infusion: further refinement of the Yale protocol. Diabetes Technol The 2016;
18:480-6.
25. Telford ED, Franck AJ, Hendrickson AL, Dietrich NM. A bed- side computerized decision-support tool for intravenous insu- lin infusion management in critically ill patients. Jt Comm J Qual Patient Saf 2018;44:299-303.
26. Hanazaki K, Kitagawa H, Yatabe T, Munekage M, Dabanaka K, Takezaki Y, Tsukamoto Y, Asano T, Kinoshita Y, Namikawa T.
Perioperative intensive insulin therapy using an artificial endo- crine pancreas with closed-loop glycemic control system: the effects of no hypoglycemia. Am J Surg 2014;207:935-41.
27. Ichimori S, Nishida K, Shimoda S, Sekigami T, Matsuo Y, Ichi- nose K, Shichiri M, Sakakida M, Araki E. Development of a highly responsive needle-type glucose sensor using polyimide for a wearable artificial endocrine pancreas. J Artif Organs 2006;9:105-13.
28. Matsuo Y, Shimoda S, Sakakida M, Nishida K, Sekigami T, Ichimori S, Ichinose K, Shichiri M, Araki E. Strict glycemic control in diabetic dogs with closed-loop intraperitoneal insu- lin infusion algorithm designed for an artificial endocrine pan- creas. J Artif Organs 2003;6:55-63.
29. Namikawa T, Munekage M, Kitagawa H, Yatabe T, Maeda H, Tsukamoto Y, Hirano K, Asano T, Kinoshita Y, Hanazaki K.
Comparison between a novel and conventional artificial pan- creas for perioperative glycemic control using a closed-loop system. J Artif Organs 2017;20:84-90.
30. Kwon S, Thompson R, Dellinger P, Yanez D, Farrohki E, Flum D. Importance of perioperative glycemic control in general surgery: a report from the Surgical Care and Outcomes Assess- ment Program. Ann Surg 2013;257:8-14.