ORIGINAL ARTICLE
Hip Pelvis 33(2): 78-86, 2021 https://doi.org/10.5371/hp.2021.33.2.78
INTRODUCTION
The incidence of hip fracture is steadily increasing with a rising life expectancy1). Intertrochanteric and femoral neck fractures account for a large percentage of all hip fractures in older patients, and hip joint arthroplasty is commonly per- formed. Undisplaced femoral neck fractures that are not severe are typically treated with internal fixation, but dis- placed fractures are the most common. Hip arthroplasties are more often performed on patients at high risk for fixa- tion failure2). In recent years, total hip arthroplasty (THA) has been increasingly performed in patients with a femoral neck fracture, and favorable clinical outcomes have been
Relationships between Femoral Offset Change and Clinical Score following Bipolar Hip Arthroplasty
in Femoral Neck Fractures
Sung Soo Kim, MD, Hyeon Jun Kim, MD, Chang Heon Shim, MD
Department of Orthopedic Surgery, College of Medicine, Dong-A University, Busan, Korea
Purpose: This study aimed to investigate the relationship between femoral offset (FO) and clinical outcomes of patients with femoral neck fracture following bipolar hip arthroplasty (BHA).
Materials and Methods: Records for a total of 520 patients who underwent BHA for a femoral neck fracture between December 1, 2003, and September 30, 2018, were reviewed retrospectively. Patients with unclear med- ical records, a congenital deformity and preoperative trauma history of the hip, high-energy multiple trauma, or a history of neurodegenerative disease or cerebrovascular disease were excluded. The remaining 77 patients includ- ed in the analysis had a minimum follow-up period of one year. For clinical assessment, the postoperative pain visual analogue scale (VAS) and Harris hip score (HHS) were analyzed at each follow-up period. For radiologi- cal assessment, the difference in leg length discrepancy (LLD) and FO were measured.
Results: The difference in mean FO postoperatively was 6.7±4.8 mm, and the difference in mean postoperative LLD was 4.9±3.4 mm. The mean HHS was 77.1±7.7, 82.3±8.6, 83.4±7.7, and 86.4±6.7 at 1, 3, 6, and 12 months postoperative, respectively. The correlation coefficient between FO and HHS in 1-year follow-up was –0.38, and a statistically significant outcome was found (P=0.001). For the HHS domain, the correlation coeffi- cient for function at 1-year follow-up was –0.42, revealing a statistically significant outcome (P=0.0001).
Conclusion: There was a statistically significant correlation between clinical outcomes and FO difference at 1 year after BHA in patients over 65 years of age with femoral neck fractures.
Key Words: Femoral neck fractures, Hemiarthroplasty, Offset
Submitted:November 29, 2020 1st revision:December 30, 2020 2nd revision:January 8, 2021 Final acceptance:January 9, 2021 Address reprint request to
Hyeon Jun Kim, MD
(https://orcid.org/0000-0002-3775-6421)
Department of Orthopedic Surgery, College of Medicine, Dong-A University, 32 Daesingongwon-ro, Seo-gu, Busan 49201, Korea TEL:+82-51-240-2757 FAX:+82-51-254-6757
E-mail:hyeonjun@dau.ac.kr
This is an Open Access article distributed under the terms of the Creative Commons Attribution Non-Commercial License (http://creativecommons.
org/licenses/by-nc/4.0) which permits unrestricted non-commercial use, dis- tribution, and reproduction in any medium, provided the original work is properly cited.
reported3,4). However, as THA is a more extensive surgery and has a higher risk of dislocation compared to bipolar hip arthroplasty (BHA), BHA remains the preferred treatment in Korea5). In hip arthroplasty, biomechanical restoration is important and femoral offset (FO) is the most critical factor in achieving a successful hip replacement6-11). A large num- ber of studies have explored FO in THA, but only a few have focused on BHA. Therefore, the current study aimed to investigate correlations between FO and clinical outcomes in patients who underwent BHA for femoral neck fracture with a minimum follow-up of one year.
MATERIALS AND METHODS 1. Subjects
Hospital registry records for 520 patients at Dong-A University Hospital who underwent BHA for femoral neck fracture with a minimum follow-up of one year between December 1, 2003 to September 30, 2018, were screened for inclusion.
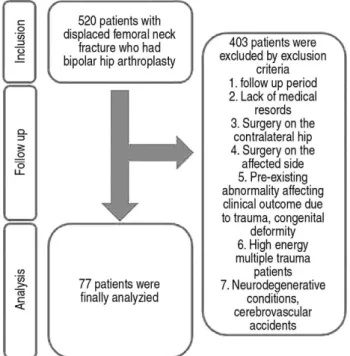
Subjects were excluded based on the following criteria (Fig.
1): (1) Those with a follow-up of less than 1 year; (2) Those with unclear medical records and difficulty in communicat- ing; (3) Those with a previous surgical history on the con- tralateral hip; (4) Those with a previous surgical history on the affected hip; (5) Those with a congenital deformity and preoperative trauma history of the hip; (6) Those with high- energy multiple traumas at the time of femoral neck frac-
ture; and (7) T hose with a history of neurodegenerative dis- ease or cerebrovascular disease.
Of the original 520, a total of 77 patients were included in the analysis. The subjects included 54 females and 23 males. The mean age of patients was 74.6 years (range, 65- 95 years) and the mean follow-up period was 30.5±23.8 months (Table 1). This study was approved by the Institutional Review Board of Dong-A University Hospital (No. IRB- 19-236), and the informed consent was waived by the IRB;
permission to collect medical records from the hospital was obtained as well.
2. Surgical and Rehabilitation Methods
All operations were performed in the lateral position using a posterolateral approach. Preoperative templating was per- formed to predict the size of the implant used in surgery.
Before implant insertion, an intraoperative portable X-ray was taken to adjust the neck length of the head or the size of the femoral stem to restore the offset and to compare the leg length discrepancy (LLD) between the affected side and the contralateral side. A shuck test and stability test were done to assess stability including dislocation and impinge- ment, and the actual implant was placed. A cementless femoral stem was used in all operations. Depending on the patient’s systemic condition, surgeons allowed quadriceps exercise beginning on the second postoperative day. Standing and walker ambulation were begun in patients who active- ly flexed the hip. Walker ambulation was maintained and
F
Fiigg.. 11.. Flow diagram of patient follow-up and exclusion criteria.
Table 1. Dermographic Characteristics and Radiologic Measurement in Femoral Neck Fracture Patients following Bipolar Hip Arthroplasty
Variable Value
Age at the fractures (yr) 74.6 (65-95)0 Sex
Male 23 (29.9)0
Female 54 (70.1)0
Follow-up period (mo) 30.5 (12-136)
Preoperative FO (mm) 42.5±±9.10
Postoperative FO (mm) 38.1±±6.10
FO difference (mm) 6.7±±4.8
MCF 0.88±±0.04
RCF 1.19±±0.24
LLDR (mm) 4.9±±3.4
Values are presented as mean (range), number (%), or mean
±
±standard deviation.
FO: femoral offset, MCF: magnification correction factor, RCF: rotation correction factor, LLDR: the real leg length discrepancy.
then shifted to cane ambulation in patients at high risk for slip down. In outpatient follow-up visits, full weight-bear- ing was permitted in patients with good muscle strength and at low risk for slip down.
3. Clinical Results
To identify the impact of the change in FO on the clinical results of patients with a femoral neck fracture after BHA, pain visual analogue scale (VAS) was assessed at one year postoperative and Harris hip score (HHS) was assessed at 1, 3, 6, and 12 months postoperative. HHS was cate- gorized into pain domains with a maximum of 44 points and functional domains with a maximum of 47 points.
4. Radiological Assessment
The differences in FO were defined as the change in the FO of the contralateral normal hip on preoperative three- dimensional computed tomography (3D CT) compared to that of the operated side on plain radiographs obtained 1
year after BHA. To enhance the accuracy of FO on the nor- mal side, 3D CT (Aquilion ONE�; Canon Medical Systems, Otawara, Japan) was used and the perpendicular distance from the center of rotation of the femoral head to the femoral shaft axis was measured in the 3D axial, sagittal and coro- nal planes using the PACS system (Marosis M-viewTM 5.4; Marotech, Seoul, Korea) (Fig. 2).
FO of the operated hip was measured in the anterior- posterior pelvic views obtained 1 year after surgery using the PACS system. Three authors respectively measured FO of the hip. The interobserver variability was determined using the intraclass correlation coefficient (ICC). ICC of the FO was 0.815 (ICC 95% confidence interval [CI], 0.714-0.887). The projected femoral offset (FOP) was defined as the perpendicular distance from the hip center of rotation to the femoral shaft axis on plain X-ray images.
Since measurement errors occur on radiographs due to mag- nification rates by projection distance from the X-ray source to the anatomical structure, a magnification correction factor (MCF) was calculated and used to reduce errors in the real FO value12). Given the hemisphere, the shape of the acetabu-
F
Fiigg.. 22.. Measurement of femoral offset with three-dimensional computed tomography. The femur shaft axis (dashed line) and center of the femoral head were determined in the coronal (AA), axial (BB), and sagittal (CC) plane. The femoral offset was deter- mined by measurement of the perpendicular line between the femur shaft axis and the center of the femoral head.
FSA: femur shaft axis, FO: femoral offset.
A
C
B
lar cup, the real cup diameter (CDR) can be obtained via cor- rection for error rates according to the projection distance because the maximum diameter of the cup represents the true hemispherical diameter on a plane in orthographic projec- tion. The CDR is the projected cup diameter (CDP) mea- sured on plain radiographs using the PACS multiplied by MCF. Three different observers measured the CDP and the ICC was 0.906 (ICC 95% CI, 0.817-0.958). Therefore, MCF can be calculated using the following equation (Fig. 3).
MCF=CDR/CDP
Using this formula, the real leg length discrepancy (LLDR) was calculated by multiplying the MCF by the projected leg length discrepancy (LLDP), which corresponds to the mea- surement of the perpendicular distance between a horizon- tal line drawn through the inferior aspect of the teardrops and the prominent point of the lesser trochanter on plain radi- ographs taken 1 year after the surgery. Three authors mea- sured the LLDP of the affected hip. ICC of the LLDP was 0.829 (ICC 95% CI, 0.723-0.903).
LLDR=LLDP×MCF
Caution is necessary when assessing FO on plain radi- ographs as the more internally rotated the hip is, the small- er the real offset will appear13-16). To minimize measurement errors resulting from the degree of rotation, the rotation cor- rection factor (RCF) according to the hip rotation was obtained using the method verified by Lechler et al.16). The following equation was used by assessing the tangent func-
tion of the targeted implantγ-angle (γI) and the projected γ-angle (γP) of the femoral stem on plain radiographs (Fig. 4).
RCF=tan (γI)/tan (γP)
Finally, the following equation was used to calculate the rotation-corrected FO (FOR) nearest to the true value.
FOR=FOP×RCF×MCF 5. Statistical Analysis
All statistical analyses were performed using IBM SPSS Statistics (ver. 25.0; IBM, Armonk, NY, USA). Pearson cor- relations were conducted to identify statistically signifi- cant relationships in postoperative changes in FO, LLD, VAS, HHS pain, and HHS function at follow-ups. Absolute values of the Pearson correlation coefficient that were high- er than 0.3 were interpreted as indicating a clear linear rela- tionship. A value of P<0.05 was considered statistically significant.
F
Fiigg.. 33.. Diagram of the orthogonal projection of the hemisphere.
By the hemisphere’s geometrical nature, the maximum diam- eter (γ) of the orthogonal projection of the hemisphere is the actual diameter of the hemisphere.
F
Fiigg.. 44.. Measurement of the projection- and rotation-corrected femoral offset and leg length discrepancy (LLD). The femoral offset was measured as the horizontal distance between the hip center of rotation and the femoral shaft axis. LLD was measured as the vertical distance between a horizontal line connecting teardrops and the most prominent point of the lesser trochanter.
CDP: projected cup diameter, FNA: femoral neck axis, FOP:
projected femoral offset, FSA: femoral shaft axis, PSA: pros- thesis shaft axis,γP: projected gamma angle of the implant- ed femoral component.
RESULTS
The mean preoperative FO on the contralateral normal side was 42.5±9.1 mm in patients with a femoral neck frac- ture. The mean FO was 38.1±6.1 mm at 1 year after BHA.
The mean difference in the FO was 6.7±4.8 mm. The mean MCF was 0.88±0.04, and the mean RCF was 1.19±0.24.
LLDR was 4.9±3.4 mm (Table 1). The mean HHS was 77.1±7.7 at 1 month after BHA and improved to 86.4±
6.7 by 1 year after surgery. The mean score improved from
F
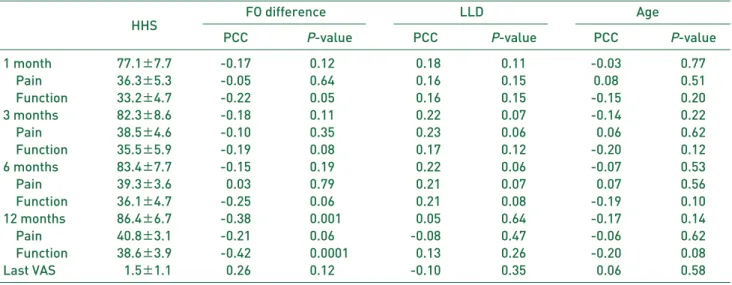
Fiigg.. 55.. The matrix scatter plot between the Harris hip score (HHS), visual analogue scale (VAS) score, femoral offset (FO) dif- ference, and leg length discrepancy (LLD) in femoral neck fracture patients following bipolar hip arthroplasty (BHA).
36.3±5.3 in 1 month to 40.8±3.1 at 1 year after surgery in the pain domain of the HHS. The mean score improved from 33.2±4.7 in 1 month to 38.6±3.9 at 1 year after surgery in the functional domain of the HHS. The Pearson corre- lation coefficient between FO and HHS at the 1-year fol- low-up was –0.38, indicating a clear negative linear rela- tionship which was significant (P=0.001) (Fig. 5).
The correlation coefficient for the HHS function domain at the 1-year follow-up was –0.42, indicating a stronger relationship (P=0.0001). However, the correlation coef-
ficient for the HHS pain domain at the 1-year follow-up was –0.21, which did not reach significance (P=0.06).
Moreover, there were no statistically significant correla- tions between LLD and clinical outcomes during the fol- low-up period. There were also no significant correlations between age and clinical outcomes (Table 2), or when com- paring the increased FO groups and decreased FO groups (Table 3).
Table 2. Clinical Results according to Follow-up Period and Correlation between Femoral Offset (FO) Difference, Leg Length Discrepancy (LLD), and Age
FO difference LLD Age
HHS PCC P-value PCC P-value PCC P-value
1 month 77.1±±7.7 -0.17 0.1200 -0.18 0.11 -0.03 0.77
Pain 36.3±±5.3 -0.05 0.6400 -0.16 0.15 0.08 0.51
Function 33.2±±4.7 -0.22 0.0500 -0.16 0.15 -0.15 0.20
3 months 82.3±±8.6 -0.18 0.1100 -0.22 0.07 -0.14 0.22
Pain 38.5±±4.6 -0.10 0.3500 -0.23 0.06 -0.06 0.62
Function 35.5±±5.9 -0.19 0.0800 -0.17 0.12 -0.20 0.12
6 months 83.4±±7.7 -0.15 0.1900 -0.22 0.06 -0.07 0.53
Pain 39.3±±3.6 -0.03 0.7900 -0.21 0.07 -0.07 0.56
Function 36.1±±4.7 -0.25 0.0600 -0.21 0.08 -0.19 0.10
12 months 86.4±±6.7 -0.38 0.0010 -0.05 0.64 -0.17 0.14
Pain 40.8±±3.1 -0.21 0.0600 -0.08 0.47 -0.06 0.62
Function 38.6±±3.9 -0.42 0.0001 -0.13 0.26 -0.20 0.08
Last VAS 01.5±±1.1 -0.26 0.1200 -0.10 0.35 -0.06 0.58
Values are presented as mean±±standard deviation.
HHS: Harris hip score, PCC: Pearson correlation coefficient, VAS: visual analogue scale.
Table 3. Clinical Results according to Follow-up Period and Correlation between Increased and Decreased Femoral Offset Groups and Clinical Score according to Sex
FO Sex
HHS Increased FO Decreased FO P-value Male Female P-value
1 month 77.1±±7.7 79.5±±9.0 81.7±±9.0 0.33 79.6±±11.2 80.3±±8.0 0.79
Pain 36.3±±5.3 37.7±±4.3 38.3±±4.1 0.58 36.6±±5.10 38.4±±3.7 0.14
Function 33.2±±4.7 41.8±±5.9 43.4±±6.5 0.29 43.0±±7.00 41.9±±5.6 0.47 3 months 82.3±±8.6 82.0±±9.1 83.6±±7.8 0.48 81.9±±10.2 82.7±±8.1 0.73
Pain 38.5±±4.6 38.7±±4.1 39.1±±3.1 0.72 37.8±±4.50 39.3±±3.5 0.14
Function 35.5±±5.9 43.3±±6.0 44.5±±6.2 0.42 44.1±±6.60 43.4±±5.8 0.67 6 months 83.4±±7.7 84.4±±9.9 85.7±±7.2 0.59 83.9±±9.80 85.0±±9.1 0.64
Pain 39.3±±3.6 39.8±±4.4 39.1±±2.8 0.50 38.6±±4.00 40.0±±4.0 0.17
Function 36.1±±4.7 44.6±±6.3 46.6±±5.4 0.20 45.4±±6.70 45.1±±5.8 0.84 12 months 86.4±±6.7 87.7±±7.8 91.1±±7.0 0.09 88.2±±8.80 88.8±±7.3 0.75
Pain 40.8±±3.1 40.9±±3.5 41.4±±2.7 0.53 40.3±±3.60 41.3±±3.1 0.25
Function 38.6±±3.9 46.9±±5.1 49.7±±5.1 0.03 47.9±±5.80 47.5±±5.0 0.81
Last VAS 01.5±±1.1 01.7±±1.0 01.2±±1.2 0.09 1.6±±1.3 01.5±±1.0 0.69
Values are presented as mean±±standard deviation.
HHS: Harris hip score, FO: femoral offset, VAS: visual analogue scale.
DISCUSSION
The number of elderly patients with hip fractures is con- tinuously increasing, and hip arthroplasty is commonly per- formed in older patients suffering from a femoral head frac- ture1,2). BHA was first introduced by Batemann17)and Giuberty18)in 1974. Unlike unipolar hemiarthroplasty, BHA is designed to provide the inner bearing between the femoral head and the polyethylene surface and the outer bearing between the acetabular cup and the acetabulum2-4). Compared with THA, BHA is more frequently performed as it is a less complicated surgery without acetabular replacement and has the advantage of an increased jumping distance that low- ers the risk for dislocation5). As in THA, the FO is impor- tant in BHA. FO is the distance from the center of rotation of the femoral head to a line bisecting the long axis of the femur, and is critical in biomechanical studies on artificial hip joints6-11). The hip joint is the lever arm of body weight and the abductor mechanism and hip abductor muscles act as the lever arm extending from the lateral aspect of the greater trochanter and the femoral head. Consequently, a greater FO reduces forces required by the abductors by increasing the abductor moment arm. Multiple studies have explored the relationship between FO and clinical outcomes in THA. Bjørdal and Bjørgul9) compared clinical results between two groups with increased FO by more than 5 mm and those with decreased FO by more than 5 mm at 1-year follow-up after THA. Results indicated significantly poor functional findings including pain severity, HHS, and oth- ers in the group with a reduction of FO by more than 5 mm.
De Fine et al.10)investigated the association of FO with bear- ing surface wear, implant loosening, and dislocation rate in a systematic review on FO restoration during THA. Two of three articles revealed a statistical association between bearing surface wear and FO restoration and showed no sta- tistical significance between implant loosening and dislo- cation rate. Sariali et al.11)found out that a 6- to 12-mm decrease in FO after THA altered the gait in 15% of all articles that examined the effect of FO modification after THA. In par- ticular, a lower maximal swing speed and range of motion while walking were significantly improved in the group with restored FO.
A large number of studies have shown the clinical out- comes of FO in THA. Conversely only a few have explored FO in BHA for multiple reasons. First, long-term follow- up is difficult in patients with a femoral neck fracture as most patients are elderly and mortality rates range between 28-30% within the first year after surgery1). Second, it is
not easy to detect significant differences in clinical results because older patients frequently have walking difficulty before the surgery and gait disturbance due to comorbidi- ties. In addition, there are challenges in an accurate assess- ment of FO.
In the current study, magnification error in projection dis- tance was adjusted with MCF. Bae et al.12)suggested that the magnification rate decreased as the projection distance shortened, and the magnification rate of plain X-ray of the femoral head was approximately 11.4%. In the present study, MCF was 0.88±0.04, and the size needed to be reduced by approximately 12% on plain X-ray to be near- est to the actual size. Merle et al.13)suggested that FO was frequently underestimated by approximately 13% on plain radiographs due to internal rotation of the hip, and recom- mended careful templating using CT as measurement errors in preoperative templating in THA may influence surgical outcomes. Weber et al.14)proposed that the measurement of FO with CT was more accurate than with plain radiographs by revealing a mean error of 1.0±2.0.
Pasquier et al.15)found that CT was a more accurate way to measure FO and LLD. Therefore, FO on the preopera- tive contralateral normal side was assessed using 3D CT in the current study. This was possible as most patients with a femoral neck fracture are admitted to the hospital via the emergency room and radiographic images are obtained by performing routine CT scanning before admission. In con- trast, FO is assessed using plain radiography at postopera- tive follow-ups. The reasons for insufficient radiographic data are avoidance of high radiation doses from CT scans, high cost, and patient compliance among others. To calcu- late postoperative FO nearest to the real value in plain radi- ographs, RCF was used. Lechler et al.16)calculated RCF using centrum column diaphyseal angle of inserted implants including the femoral stem and lag screw in 222 patients with proximal femoral nailing. In the Friedman test, there was no significant difference in the mean value between the mean FO measured using CT and the mean FO obtained using RCF on plain radiographs.
In the current study, the exclusion criteria were reinforced to allow for definitive differences in clinical outcomes dur- ing the follow-up period. Although this may reflect selec- tion bias, it was appropriate as the aim was to identify even a small difference in clinical results based on patients’ clear responses to postoperative inquiries. For example, there would be no significant difference in clinical scores even 1 year after surgery in patients with an inability to walk due to hemiparesis caused by a preoperative history of cerebral
infarction. In addition, the evaluation of clinical symptoms and improvement would be less accurate in patients having difficulty communicating due to dementia19).
In the present study, HHS and VAS were used in the assess- ment of clinical outcomes as HHS is the most commonly used tool to measure hip function in domestic and international literature and the evaluation criteria are easier for patients to understand20). The VAS has been used extensively in many studies. Data collection rates were good because VAS was one of the requirements in electronic medical record in our institution. The mean VAS score was 1.5±1.1 in the first follow-up year, revealing no significant differences in the mean HHS pain score of 40.8±3.1.
In the current study, the Pearson correlation coefficient between FO and HHS at the 1-year follow-up was –0.38, and a significant negative correlation was observed (P=
0.001). The Pearson coefficient for HHS function domain the 1-year follow-up was –0.42, revealing a stronger cor- relation (P=0.0001). However, the Pearson coefficient for the HHS pain domain at the 1-year follow-up was –0.21, showing no significant correlation (P=0.06). Through these results, we inferred that FO after the first postoperative year was not correlated with pain severity, but was correlated with HHS function in femoral neck fracture patients with BHA. No significant differences in HHS functional domains at 1, 3, and 6 months postoperative appeared to result from the fact that the functional domain was measured when func- tional rehabilitation was not fully completed. Furthermore, functional outcome is believed to be affected by limitations in daily activities due to issues such as pain. Additionally in the current study, the relationship between HHS and VAS score was investigated by dividing the group into an increased FO group and a decreased FO group. At 1, 3, 6, and 12 months the HHS and VAS scores all had P-values of 0.05 or more, and there were no statistically significant differences between the HHS and VAS scores according to the increased and decreased FO groups.
Ji et al.21)measured rotation-free FO using preoperative CT scans of the contralateral hip joint, and the FO was changed by less than 20% in 77% of patients and more than 20% in 23% of patients, indicating clinically unfavorable outcomes. Buecking et al.22)investigated clinical results by subdividing FO into rotation-corrected FO, relative FO, and contralateral FO at 1-year follow-up in 126 patients who underwent BHA due to femoral neck fractures. Results of a Spearman correlation analysis suggest there was a sig- nificant association of FO with HHS and instrumental activ- ities of daily living.
Lakstein et al.23)addressed that there were difficulties in verifying the association between the restoration of LLD and FO and functional outcomes at 1-year follow-up, and rehabilitation in old age was largely affected by the patient’s general medical and mental status. On the contrary, Hartel et al.24)reported that anatomical restoration of an artificial hip joint had an insignificant effect on short-term function- al outcomes by showing in-hospital mortality of 5.7% and one-year mortality of 30% among elderly patients who received BHA for femoral neck fractures. With a mean age of the patient group of 84 years (range, 78-94 years), the age of participants was relatively higher than in the current study.
Additionally the exclusion criteria were only those with a preoperative proximal femur fracture and a surgical history on the contralateral side. For this reason, it is believed patients having no difference between preoperative and postopera- tive clinical results appear to account for a large percentage.
Furthermore, since FO was not corrected for rotation the mea- sured FO was likely underestimated.
The strength of the current study is that the FO was obtained nearest to the real value by correcting for rotation and mag- nification errors in FO measurements. Moreover, this study strictly specified preoperative exclusion criteria to clarify clinical outcomes in compliance with the study purpose and to exclude obscure cases when determining differences between preoperative and postoperative results. The cur- rent study also aimed to identify changes in preoperative and postoperative results by investigating clinical outcomes according to the follow-up period. However, there are some limitations to note. First, this study has a relatively small sam- ple size. Second, the study was not conducted by a single surgeon and was retrospective. Third, although there were no statistically significant differences, this study was ana- lyzed using 3 different types of implants.
CONCLUSION
There was a statistically significant correlation between clinical outcomes and FO difference at 1 year after BHA in patients over 65 years of age with a femoral neck fracture.
Therefore, along with increasing life expectancy in aging societies, more careful attention is needed in FO restora- tion in femoral neck fracture patients.
CONFLICT OF INTEREST
The authors declare that there is no potential conflict of interest relevant to this article.
REFERENCES
01. Kanis JA, Odén A, McCloskey EV, Johansson H, Wahl DA, Cooper C. A systematic review of hip fracture incidence and probability of fracture worldwide. Osteoporos Int. 2012;
23:2239-56.
02. Bhandari M, Devereaux PJ, Tornetta P 3rd, et al. Operative management of displaced femoral neck fractures in elderly patients. An international survey. J Bone Joint Surg Am.
2005;87:2122-30.
03. Burgers PT, Van Geene AR, Van den Bekerom MP, et al.
Total hip arthroplasty versus hemiarthroplasty for displaced femoral neck fractures in the healthy elderly: a meta-analy- sis and systematic review of randomized trials. Int Orthop.
2012;36:1549-60.
04. Ullmark G. Femoral head fractures: hemiarthroplasty or total hip arthroplasty? Hip Int. 2014;24 Suppl 10:e12-4.
05. Hopley C, Stengel D, Ekkernkamp A, Wich M. Primary total hip arthroplasty versus hemiarthroplasty for displaced intra- capsular hip fractures in older patients: systematic review.
BMJ. 2010;340:c2332.
06. Lecerf G, Fessy MH, Philippot R, et al. Femoral offset: anatom- ical concept, definition, assessment, implications for preoper- ative templating and hip arthroplasty. Orthop Traumatol Surg Res. 2009;95:210-9.
07. Flecher X, Ollivier M, Argenson JN. Lower limb length and offset in total hip arthroplasty. Orthop Traumatol Surg Res.
2016;102(1 Suppl):S9-20.
08. Mahmood SS, Mukka SS, Crnalic S, Wretenberg P, 2 Sayed- Noor AS. Association between changes in global femoral off- set after total hip arthroplasty and function, quality of life, and abductor muscle strength. A prospective cohort study of 22 patients. Acta Orthop. 2016;87:36-41.
09. Bjørdal F, Bjørgul K. The role of femoral offset and abduc- tor lever arm in total hip arthroplasty. J Orthop Traumatol.
2015;16:325-30.
10. De Fine M, Romagnoli M, Toscano A, Bondi A, Nanni M, Zaffagnini S. Is there a role for femoral offset restoration during total hip arthroplasty? A systematic review. Orthop Traumatol Surg Res. 2017;103:349-55.
11. Sariali E, Klouche S, Mouttet A, Pascal-Moussellard H. The effect of femoral offset modification on gait after total hip arthroplasty. Acta Orthop. 2014;85:123-7.
12. Bae YJ, Kang KS, Tae SK, Jung YB, Lee HJ, Jin WJ.
Roentgenographic study on shape and size of the femoral
head of normal Korean adults. J Korean Orthop Assoc. 1995;
30:607-11.
13. Merle C, Waldstein W, Pegg E, et al. Femoral offset is under- estimated on anteroposterior radiographs of the pelvis but accu- rately assessed on anteroposterior radiographs of the hip. J Bone Joint Surg Br. 2012;94:477-82.
14. Weber M, Woerner ML, Springorum HR, Hapfelmeier A, Grifka J, Renkawitz TF. Plain radiographs fail to reflect femoral offset in total hip arthroplasty. J Arthroplasty. 2014;
29:1661-5.
15. Pasquier G, Ducharne G, Ali ES, Giraud F, Mouttet A, Durante E. Total hip arthroplasty offset measurement: is CT scan the most accurate option? Orthop Traumatol Surg Res. 2010;96:
367-75.
16. Lechler P, Frink M, Gulati A, et al. The influence of hip rota- tion on femoral offset in plain radiographs. Acta Orthop. 2014;
85:389-95.
17. Batemann JE. Single-assembly total hip prosthesis; prelimi- nary report. Orthop Digest. 1974;2:15-22.
18. Giuberty RP. A new concept of a bipolar endoprosthesis.
Orthop Rev. 1974;3:40-5.
19. Rösler A, Krause T, Niehuus C, von Renteln-Kruse W.
Dementia as a cofactor for geriatric rehabilitation-outcome in patients with osteosynthesis of the proximal femur: a ret- rospective, matched-pair analysis of 250 patients. Arch Gerontol Geriatr. 2009;49:e36-9.
20. Mahomed NN, Arndt DC, McGrory BJ, Harris WH. The Harris hip score: comparison of patient self-report with sur- geon assessment. J Arthroplasty. 2001;16:575-80.
21. Ji HM, Won SH, Han J, Won YY. Does femoral offset recov- er and affect the functional outcome of patients with displaced femoral neck fracture following hemiarthroplasty? Injury.
2017;48:1170-4.
22. Buecking B, Boese CK, Bergmeister VA, Frink M, Ruchholtz S, Lechler P. Functional implications of femoral offset fol- lowing hemiarthroplasty for displaced femoral neck fracture.
Int Orthop. 2016;40:1515-21.
23. Lakstein D, Atoun E, Wissotzky O, Tan Z. Does restoration of leg length and femoral offset play a role in functional out- come one year after hip hemiarthroplasty? Injury. 2017;48:
1589-93.
24. Hartel M, Arndt M, Eulenburg CZ, Petersen JP, Rueger JM, Hoffmann M. Restoration of hip architecture with bipolar hemiarthroplasty in the elderly: does it affect early func- tional outcome? Arch Orthop Trauma Surg. 2014;134:31-8.